Media spend for August 2015 was $10,370, media spend for August 2014 was $12,638.
|
|
|
- Magdalene Freeman
- 5 years ago
- Views:
Transcription
1 MONTHLY PERFORMANCE REPORT NMEDA August 2015 SUMMARY AT-A-GLANCE Media spend for August 2015 was $10,370, media spend for August 2014 was $12,638. Total website visitors was 12,140 which was right in line with the previous month amount. 33% Website users access the website through their mobile devices, before the new website it was only 10%. Top web referral site were Chrysler, Bing, B&D Independence, NMAM and VMI, We love our members. Top impressions were QAP (3,000), wheelchair accessible vehicles (1,300) & mobility vehicles (500) 2,481 zip code searches were performed. 46 Dealers were contacted by the web form, 11 dealers were called from the locator and 13 directions were clicked on. Visitors arriving via Paid Search brought 59 more conversions this month, an increase of 45%. NMEDA had 1,620,368 social impressions with a 17% increase in new Facebook fans and 53% increase in average engagement per Facebook post and 53% increase in Marketplace Ad CTR. 561 Social visitors reached the site for the first time. 13% Increase in new Twitter followers. Wrote questions, surveyed NMAM winners, Vets and media reps on new QAP campaign and tallied results, updated advertising, created presentation for marketing committee for review. Driving with MS enewsletter was sent out mid month with a open rate of 14.2%. Blogs were written, SEO'd and posted about Electronic Hand Controls, Accessible Scuba Diving and Disability Toys. Worked on partnership marketing and posted content for American Stroke Association and National MS Society. Page 1 of 27

2 OVERVIEW Monthly visits to NMEDA were virtually flat, as they rose 0.68% from last month, while visits compared to last August were up 6.8% Conversions went down very slightly, falling from 2,125 to 2,082 since the prior month with the conversion rate falling from 17.62% to 17.15%. Visits 12, % last month Bounce Rate 50.36% 1.01% last month 6.80% last year 26.92% last year Conversions 2, % last month Page 2 of 27
3 Monthly Visits and Conversions from All Channels Visits New Visits Conversions Jan Feb Mar Apr May Jun Jul Aug CHANNEL PERFORMANCE CHANNEL VISITS BOUNCE RATE CONVERSIONS CONVERSION RATE Organic Search 5, % 51.71% -4.00% % 15.04% -1.21% Direct 3, % 50.59% 12.14% % 20.50% % Referral 1, % 37.86% -3.29% % 17.04% 7.72% Paid Search % 49.15% -1.71% % 20.15% % Social % 71.05% 5.29% % 13.98% 5.01% SEO HIGHLIGHTS The new website is proving very effective amongst mobile users. Before the new website, only 10% of traffic viewed the site on mobile devices. Now over 33% of users access the website via mobile devices. Add a custom list Page 3 of 27
4 REFERRAL Monthly Visits and Conversions from Referrals Visits Conversions Jan Feb Mar Apr May Jun Jul Aug Visitors arriving from outside links brought 12 fewer conversions this month, a decline of 3.9%. TOP REFERRAL SOURCE REFERRAL SOURCES VISITS BOUNCE RATE CONVERSIONS CONVERSION RATE chryslerautomobility.com % 18.45% 20.31% % 8.93% % bing.com % 39.02% 21.11% % 15.45% % bdindependence.com % 10.29% % % 89.71% 1.87% mobilityawarenessmonth. com % 33.33% % % 23.81% % vantagemobility.com % 12.00% % % 8.00% % Page 4 of 27
5 ORGANIC SEARCH Monthly Visits and Conversions from Organic Search Visits Conversions Jan Feb Mar Apr May Jun Jul Aug Other than the Home Page, the healthiest pages for Search conversions were /locate-dealer/, /category/handicap-accessible-vehicles/, /how-to-afford-a-used-wheelchair-accessiblevehicle/, /how-to-buy/, and /the-va-helps-veterans-get-mobility-assistance/. Visitors landing on these pages are finding what they're searching for and are being guided toward conversion goals. There was a nice balance of visits between the Home Page and all of the other landing pages. In general, searchers landing on the Home Page are searching for your brand, while other pages usually bring in visitors searching for non-brand terms. However, Search visits landed a bit more heavily on the Home Page compared to July. The pages that brought in the most first-time Search visitors were the Home Page, /locatedealer/, and /category/handicap-accessible-vehicles/. There were a few landing pages that could be better optimized to guide Search users towards a conversion goal. Visitors don't bounce more than average on the Home Page, /category/handicap-accessible-vehicles/, and /members/annual-conference/, but they do have a lower-than-average conversion rate. 36% of your Search visits were on a mobile device or tablet in August, nearly identical to 36% last month. Yahoo drove 301 visits, up 15.3% from last month, and accounted for 5.5% of total Search traffic. Page 5 of 27
6 Page 6 of 27
7 TOP ORGANIC SEARCH LANDING PAGE LANDING PAGES VISITS BOUNCE RATE CONVERSIONS CONVERSION RATE the Home Page 1, % 32.62% 0.45% % 8.45% 4.75% /locate-dealer/ % 44.36% 6.61% % % 0.00% /category/handicap-accessible-vehicl es/ % 43.71% -5.71% % 6.59% -9.58% /members/qap-compliance/about-qa p-program-rules-guidelines/ % 83.12% -2.27% % 2.50% % /how-to-afford-a-used-wheelchair-acc essible-vehicle/ % 63.20% -4.50% % 10.40% 57.16% PAID SEARCH Monthly Visits and Conversions from Paid Search Visits Conversions Jan Feb Mar Apr May Jun Jul Aug Visitors arriving via Paid Search brought 59 more conversions this month, an increase of 45%. Among all keywords targeted by Paid Search ads, the three that were most likely to drive conversions were: "wheelchair accessible," "wheelchair accessible minivan," and "wheelchairs van." Page 7 of 27
8 27.7% of your Paid Search visits were on a mobile device in August, up a bit from 26.5% during the prior month. TOP PAID SEARCH KEYWORD KEYWORDS VISITS BOUNCE RATE CONVERSIONS CONVERSION RATE nmeda % 15.53% % % 22.98% % wheelchair access ramps % 62.77% % % disability aids % 63.08% 26.15% % wheelchair accessible % 68.85% % 15 1,400.00% 24.59% % buy wheelchair van % % SOCIAL Monthly Visits and Conversions from Social Networks Facebook 69.8% Pinterest 13.6% Twitter 11.9% LinkedIn 2.1% Tumblr 1.1% Other 1.6% The most effective sources of Social traffic were Facebook and Pinterest. They're both driving large numbers of visitors that are likely to convert, so it's important to continue maintaining activity there. The pages the Home Page, /funding-resources-for-accessible-vehicles-adaptive-equipment/, and /scuba-diving-adaptable/ received surges of traffic. the Home Page brought in 30 more visits than it did the prior month (+28%). Page 8 of 27

9 561 Social visitors reached the site for the first time. TOP SOCIAL NETWORK SOCIAL NETWORKS VISITS BOUNCE RATE CONVERSIONS CONVERSION RATE Facebook % 68.22% 7.69% % 8.30% -4.01% Pinterest % 80.21% 6.32% % 60.42% 27.55% Twitter % 83.33% 3.85% 0 No Change 0.00% No Change LinkedIn % 20.00% % 0 No Change 0.00% No Change Tumblr % 87.50% -5.21% 0 No Change 0.00% No Change TOTAL SOCIAL MEDIA ENGAGEMENT The following metrics showcase the engagement reporting for the month of August. The 'Big Wins' showcase our month-over-month performance in relation to goals and key performance indicators agreed upon by evok and the NMEDA team. Total Social Media Engagement FACEBOOK ENGAGEMENT Big Wins: 17% increase in new Facebook fans 53% increase in average engagement per Facebook post Page 9 of 27


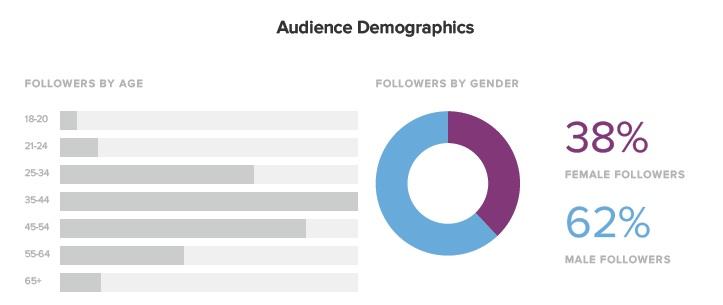
10 Facebook Growth and Page Impressions Facebook Demographics Page 10 of 27


11 Facebook Sharing Stats Facebook Content Breakdown Page 11 of 27
12 FACEBOOK MARKETPLACE ADVERTISING Total Marketplace Advertising Spend: $500 Impressions: 16,884 CTR: 6.14% (Average CTR for Sponsored Page Like Story is 0.30% and the average CTR for Automotive is 0.297%) CPC: 39 cents (Average CPC for auto/vehicle sector is 66 cents) Clicks: 1,036 New Page Likes: ,558 people like us to date. Is that a strong number comparatively speaking? For the number of dollars we're spending and the amount of time we've been online? Yes because: - All targeted individuals have listed Disabled sports, Motorized wheelchair, Muscular Dystrophy Canada, Iraq and Afghanistan Veterans of America, Disability.gov, Wounded Warrior Project, Disability, Caregiver AARP The Magazine, New Mobility magazine, Vietnam Veterans of America, BraunAbility, New Mobility, Christopher and Dana Reeve Foundation, Spinal cord injury as personal interests, making them all highly qualified brand leads. - These 896 likes are just from the Facebook Ad campaign itself, which doesn't include all additional organic growth. - Ad targeting is becoming more specific due to changes in the platform that ensure ads are only being shown to users most likely to click and most likely to engage with your brand. Big Wins: 53% increase in Marketplace Ad CTR Lowered Marketplace Ad CPC by 5% 6% increase in Marketplace Ad clicks 8% increase in Marketplace Ad new page likes 86% conversion rate of ad clicks to new page likes Page 12 of 27


13 TWITTER ENGAGEMENT Big Wins: 13% increase in new Twitter followers 6% increase in link clicks on Twitter Page 13 of 27

14 Page 14 of 27


15 PINTEREST ENGAGEMENT Followers: 1.1k Pins: 1.5k Likes: 43 Pinterest Daily Averages Pinterest Monthly Averages TUMBLR Page 15 of 27

16 GOOGLE+ Page 16 of 27


17 Google + Branded and Local Page Page 17 of 27

18 Page 18 of 27
19 CAMPAIGN The NMEDA August newsletter focused on driving with MS, all-inclusive playgrounds, and tips on buying auto insurance for those with disabilities. The newsletter was sent on Thursday, August 20th at 9:00am, with the subject line NMEDA enewsletter August The August newsletter showed continued improvement. Click and open rates are returning to their normal levels. The number of organic subscriptions remains high, and bounce and unsubscribe rates are remaining low. The areas that saw the most click traffic included the featured article Driving with MS: Knowing Your Options with 37% of total clicks; Smart Tips on Buying Auto Insurance for Those with Disabilities with 34% of total clicks; and All Inclusive Playgrounds - The Integrated Carousel with 13% of total clicks. The NMEDA website, dealer locator, and Facebook share were the next highest in click traffic. Big Wins and Key Insights Open rate and click rates are rising again a er their mid-summer slump. The organic subscription rate has been consistently high a er the launch of the new website. Unsubscribe and bounce rates remain low. The subscriber list continues to grow as organic subscriptions continue to surpass unsubscriptions. Page 19 of 27
20 Page 20 of 27
21 GOALS Conversions Assists Direct Organic Referral Paid Social Conversions are only credited to the most recent channel that brought in the visitor, even if they made multiple trips to the site before they converted. Assisted conversions give a credit to each channel that brought in that user before they ultimately converted. With 491 total conversions, the week of Aug was the strongest week of the month. Below is a view of interactions with the 'Why NMEDA/QAP', 'What to Buy', and blog pages. Page 21 of 27

22 Popular Page Visits and Interactions Page 22 of 27
23 Top Dealer Websites Clicked Page 23 of 27
24 Top Dealer Locator Searches Dealers Contacted Via Webform Page 24 of 27
25 Dealers Called from Dealer Locator Dealer Directions Clicked from Dealer Locator Page 25 of 27
26 GOAL BREAKDOWN GOAL CONVERSIONS CONVERSION RATE Locate a Dealer 2, % 17.15% -2.69% DEMOGRAPHICS Mobile Visits as a Percentage of Total Visits 50% 40% 30% 20% 10% 0% Sep 14 Oct 14 Nov 14 Dec 14 Jan 15 Feb 15 Mar 15 Apr 15 May 15 Jun 15 Jul 15 Aug About a third of the site's visitors were on mobile devices this past month. They completed a goal 15.5% of the time, a bit lower than the site's desktop users (18.0%). The mobile conversion rate represents a bit of an improvement from the site's six-month trailing average of 14.6%. Visitors reaching the site for the first time converted less o en (down 2.8%) than during the prior month, and accounted for about 60% of the site's conversions. The top states that sent traffic to the site were California (with 8.8% of visits), Florida (8.7%), and Texas (7.8%). Page 26 of 27
27 GEOGRAPHIC BREAKDOWN REGION VISITS BOUNCE RATE CONVERSIONS CONVERSION RATE California 1, % 50.19% 0.37% % 20.32% 10.73% Florida 1, % 43.63% 1.95% % 17.00% 7.94% Texas % 60.68% 17.29% % 10.20% % Illinois % 41.31% -1.99% % 34.75% 4.38% New York % 52.08% -2.15% % 15.85% -2.59% Page 27 of 27