The only media-advertising group in Poland, integrating the world of modern entertainment, social media and custom advertising solutions
|
|
|
- Virgil Carroll
- 5 years ago
- Views:
Transcription


1 The only media-advertising group in Poland, integrating the world of modern entertainment, social media and custom advertising solutions
2 EXECUTIVE SUMMARY Recognized brand 3 TV music channels Distribution : 3 x 7 mln HH (70% Poland s population) Over 1 mln fans in social media FUN APP downloads /month website users Sponsoring Department generating 15% total TV incomes and free marketing activities Strong Tech and IT Department introducing and managing interactive solution for viewers, users, clients and sponsors Strong programing Department. Growing B2B services (Program, B2F) Smart up-selling via consulting services Growing viewers ratings After drop in 2014, growth of incomes and Ebidta in 2015


. Multiple Effie Awards.")

3 KEY PERSONS INVESTORS NOVA GROUP ANETA PARAFINIUK RAFAŁ BARAN DARIUSZ STOKOWSKI ROSS NEWENS BOARD MEMBER / CFO PRESIDENT OF THE BOARD / CEO CHAIRMEN OF THE SUPERVISORY BOARD / MAIN SHAREHOLDER Has an extensive experience in audit, accounting, reporting and taxes, reviews of financial statements, transaction advisory, preparation of project budgets and conducting due diligence projects. She joined the Company in 2010 as a Financial Reporting and Controlling Director. 23 years of work experience in media and marketing communication. Since the very beginning on managing positions. Multiple landmark projects: campaigns for Commercial Union, Idea rebranding for Orange. Long term management of marketing communication services for Telekomunikacja Polska, Play. Two merges management: Testardo with Bates; Testardo Red Cell with Grey Warszawa. Two times Agency of the Year award (2006 Testardo, 2012 Grey Group). Multiple Effie Awards. The founder and the main shareholder of Nova Group Ltd. fund, the biggest shareholder of 4fun Media S.A. He is responsible for strategic development of the fund, investments, acquisitions and takeovers of new companies. Since the foundation of Nova Holding in 2002, he has been creating the foundations of assets and its companies. A dynamic and experienced director who has had a career path based upon developing and managing companies primarily in Media,Telecoms and New Technology sectors.
4 COMPANY DESCRIPTION 4FUN MEDIA SA - Polish media company founded in September FM is the owner and TV broadcaster of 4FUN.TV, 4FUN HITS and 4FUN DANCE. The group also includes companies: Program Sp.z o.o, Bridge2FUN Sp.z o.o. and Screen Network Sp.z o.o. The company is listed on the Warsaw Stock Exchange (GPW) - stock symbol 4FM since 2010
5 MARKET ENVIRONMENT COMPANY DESCRIPTION The Polish advertising market is the second largest media market in CEE right after Russia. PLN 7.9 bln

6 MARKET ENVIRONMENT Media categories share Changes of the Polish advertising market 2015 vs. 2014
7

8 GROUP OVERVIEW

9 4FUN OPERATIONAL MEDIA SYNERGIES CONTENT STRATEGY
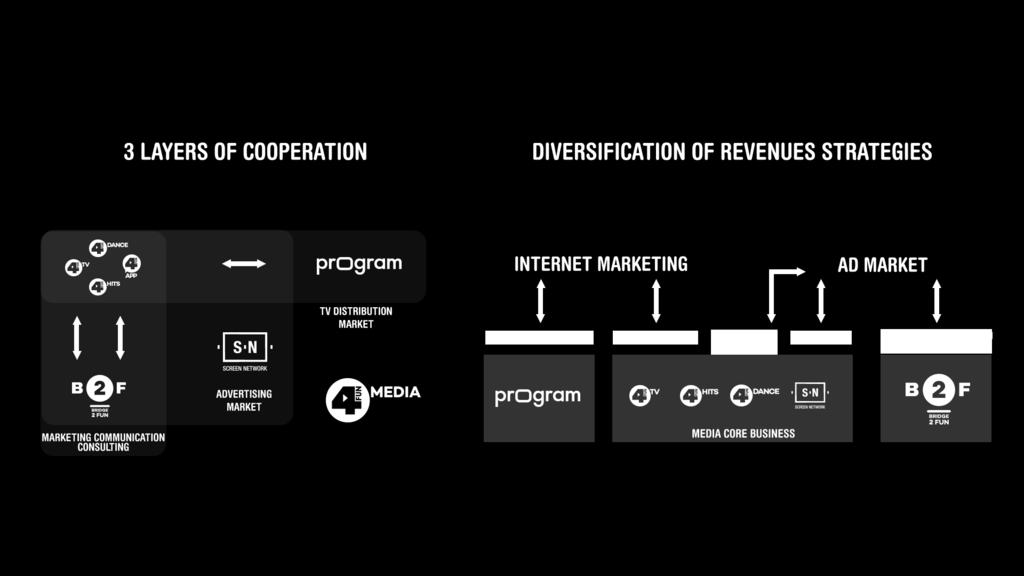
10 OPERATIONAL SYNERGIES
11

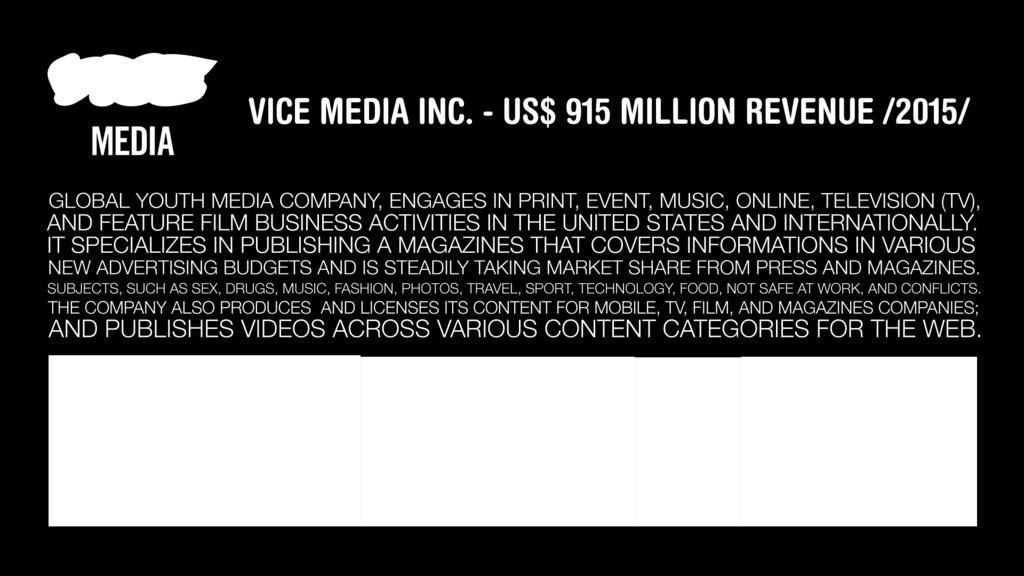
12 VICE NEW BUSINESS MODEL

13 4FUN MEDIA NEW BUSINESS MODEL T-MOBILE CASE


14 TV BROADCASTING UNIT
15 Polish TV market GENERAL DATA MARKET ENVIRONMENT
16 4FUN.TV DISTRIBUTION SOLID SATELLITE AND CABLE DISTRIBUTION
17 MARKET ENVIRONMENT POLISH TV MARKET TV ADVERTISING EXPENDITURES TOTAL TV AMR - TARGET GROUP ALL +4 SOURCE: SMG - ADVERTISING MARKET IN POLAND 2016 SOURCE: NIELSEN AUDIENCE MEASUREMENT

18 MARKET ENVIRONMENT ATV - TOTAL TV ATS MUSIC TV CATEGORY SOURCE: NIELSEN AUDIENCE MEASUREMENT

19 MARKET ENVIRONMENT POLISH TV MARKET BIG4" GENERALIST CHANNELS VS THEMATIC CHANNELS; TARGET ALL 4+ MUSIC TV CHANNELS TARGET GROUP ALL SOURCE: NIELSEN AUDIENCE MEASURMENT

20 4FUN IN MUSIC TV SEGMENT MARKET ENVIRONMENT MUSIC TV CHANNELS SEGMENT SHR
21 4FUN IN MUSIC TV SEGMENT
22 4FUN MEDIA SEGMENT SHR: 2015 VS. 2016

23 BRAND


24 BEST 2016 MUSIC TV IN EUROPE ( ) AWARDED TV CONCEPT

25 BRAND AWARNESS 4FUN.TV ONE OF FOUR MOST RECOGNIZABLE BRANDS IN MUSIC TV CATEGORY IN POLAND > MUSIC CHANNELS CATEGORY AVERAGE MUSIC TV CHANNELS AVERAGE SOURCE: BRAND DYNAMICS 07/2015


26 SOURCE: BRAND DYNAMICS 07/2015 BRAND AWARENESS

27 THREE MUSIC TV STATIONS UNDER ONE BRAND

28

29 TV OUR FANS

30 SOURCE: SOTRENDER SOCIAL MEDIA ENGAGEMENT

31 SOCIAL MEDIA ENGAGEMENT HIGHEST FANBASE ENGAGEMENT IN YOUTH ADRESSED TV STATIONS 30% SOURCE: SOTRENDER


32 59% OF POLES USE THEIR SMARTPHONES WHILE WATCHING TV * TV SET IS PRESENT IN MORE THAN 96% OF HOUSEHOLDS *


33

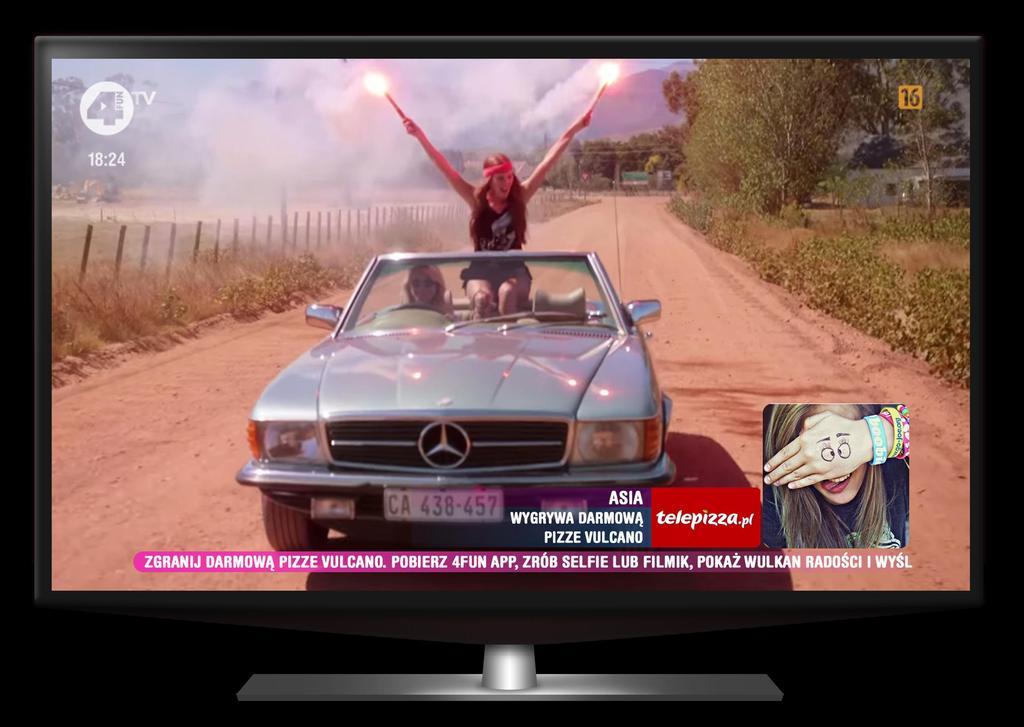
34 4FUN APP is a best way to get fresh, real content and get social intention of viewers, ready to support your WoM marketing. SOCIAL TV - OUR SOLUTION This solution is ready for implement to your channel and people are ready to join your show.

35 4FUN APP gives extended information about schedule, shows and materials in real time. Viewers can follow their favourite content like programmes / subjects / stars / hosts receiving push messages before the show.

36 SOCIAL TV

37


38 FACEBOOK USERS MOVIES INSTALLS PHOTOS 90% RETURNING USERS

39 PHOTOS SENT

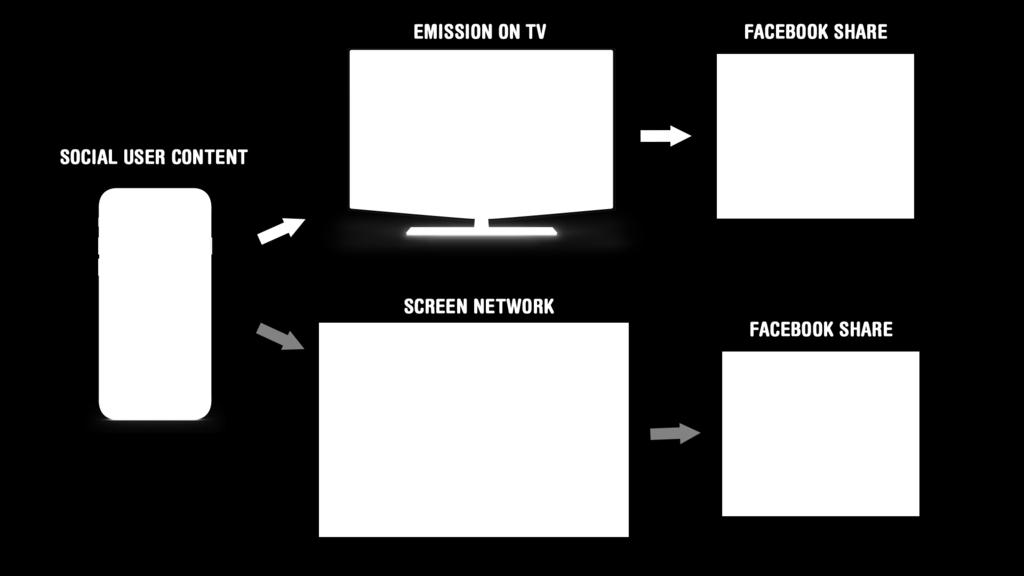
40 CROSS MEDIA ENGAGEMENT

41 B2B SERVICES

42 SPECIAL PROJECTS AIRED
 MARKET IS")

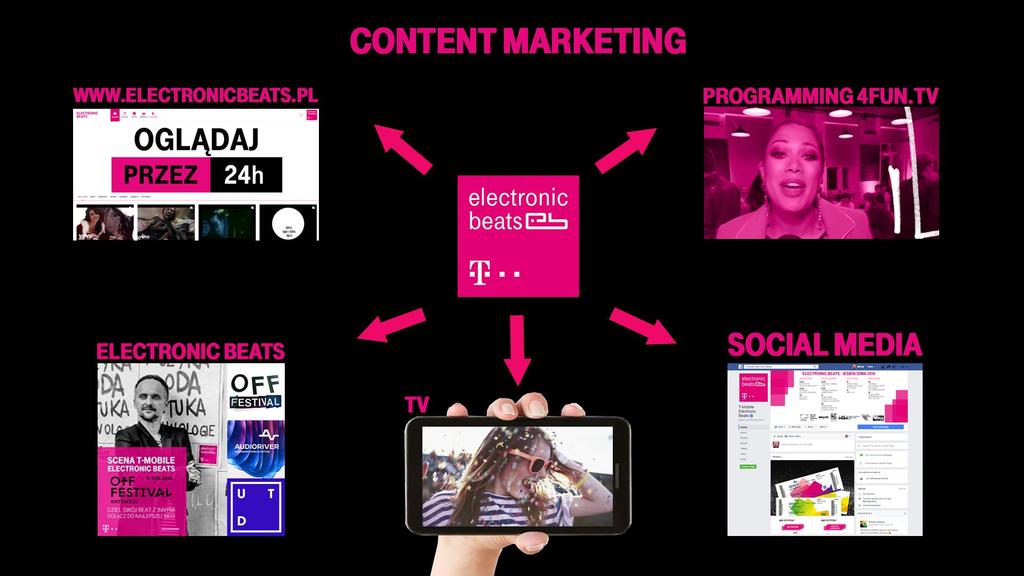
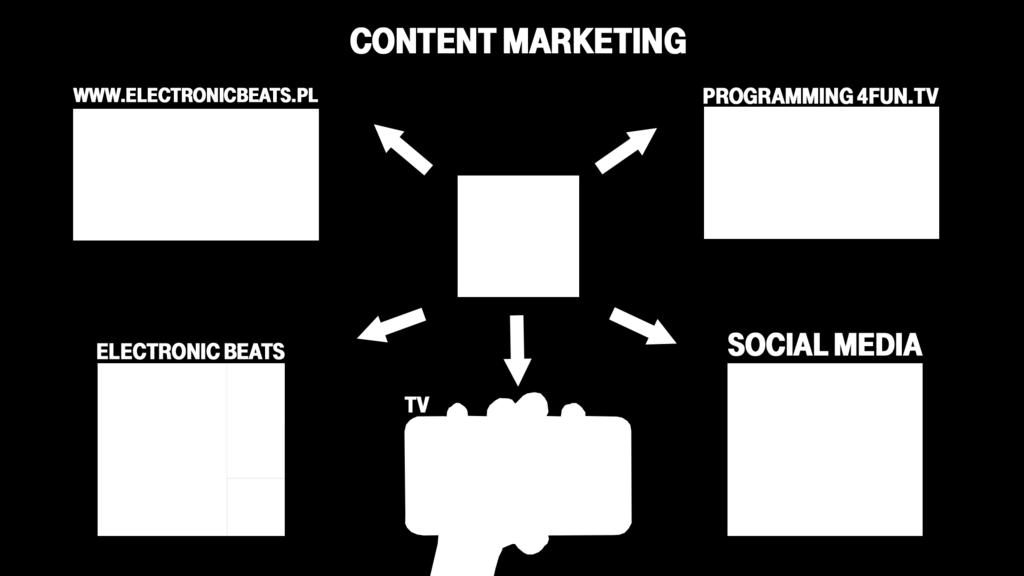
43 T-MOBILE ELECTRONIC BEATS / SPECIAL PROJECT T-MOBILE ELECRONIC BEATS IS A INTERNATIONAL LIFESTYLE PLATFORM OFFERING MUSIC/LIFESTYLE CONTENT GLOBAL VALUE OF EDM (ELECTRONIC DANCE MUSIC) MARKET IS ESTIMATED ON 7 BILL $ AND GROWS 12% A YEAR (SOURCE: FORBES) COVERAGE OF THE BIGGEST ELECTRONIC MUSIC FESTIVALS ELECTRONIC BEATS IS AIRED IN 4FUN.TV AND 4FUN DANCE WITH ADDITION OF 4FUN APP SOCIAL MEDIA PROMOTION

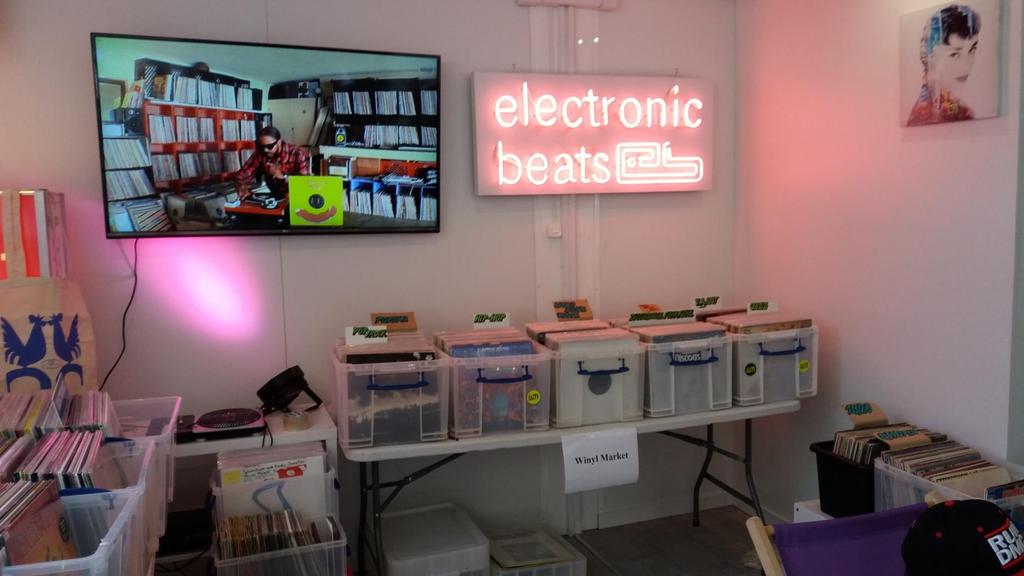
44 T-MOBILE / 4FUN ELECTRONIC BEATS STUDIO

45

46
47 OUR B2B SERVICE MARKETING AND SALES SERVICES FOR THEMATIC CHANNELS DISTRIBUTION AND SALES SUPPORT Leveraging relationships with CATVs and digital platforms. Strategy planning and negotiations. Managing license agreements and processing data and reports. MARKETING / CONSULTING Preparing marketing strategies. Design and order of marketing materials. Managing advertising campaigns and co-operation with partners. PROGRAM SPECIALIZES IN SERVICES DEDICATED TO SALES AND DISTRIBUTION OF TELEVISION CHANNELS THROUGH CATV S DIGITAL PLATFORMS AND INTERNET. THE PORTFOLIO NOW INCLUDES:

48
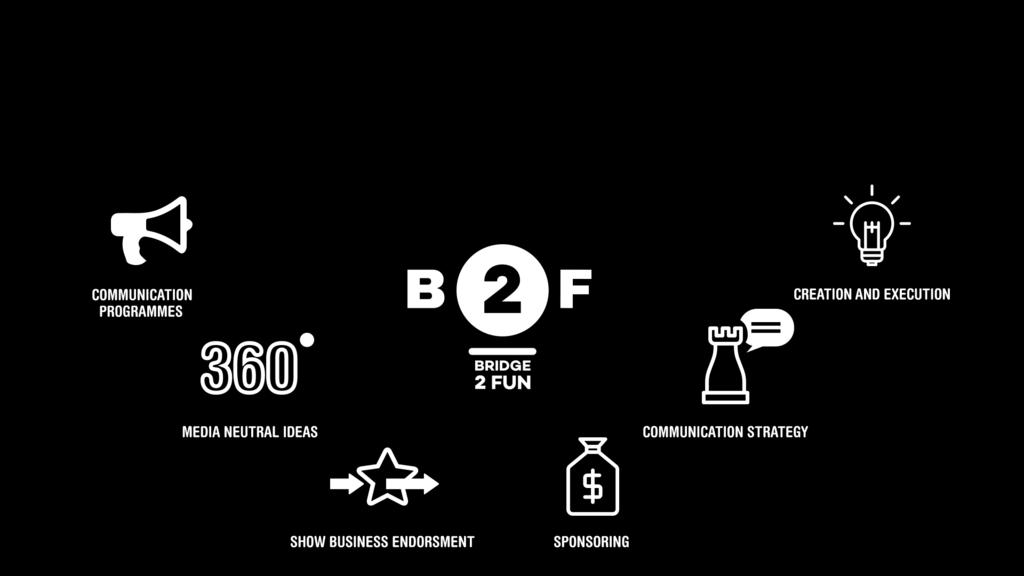
49 BRAND NEW ADVERTISING AGENCY

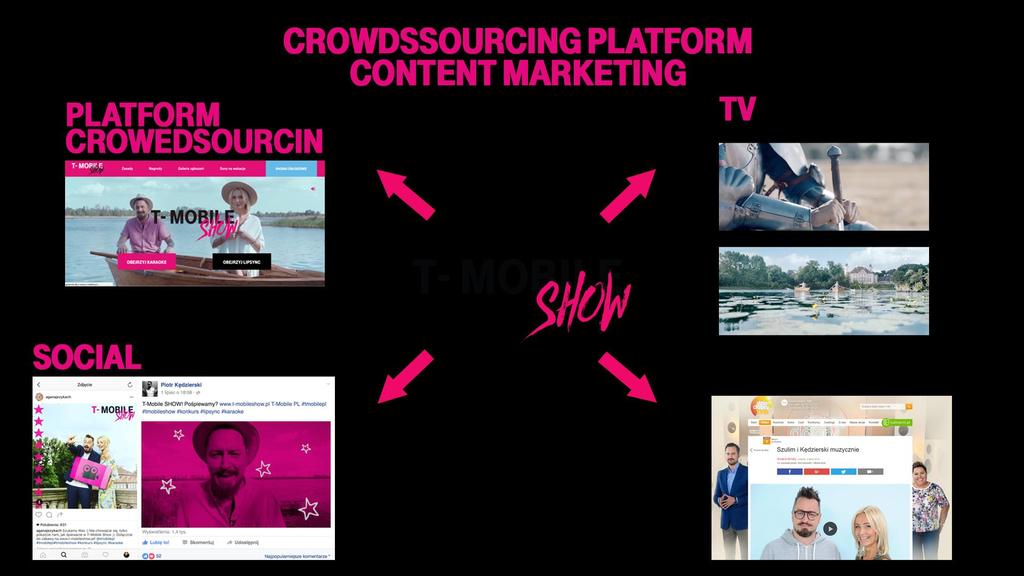
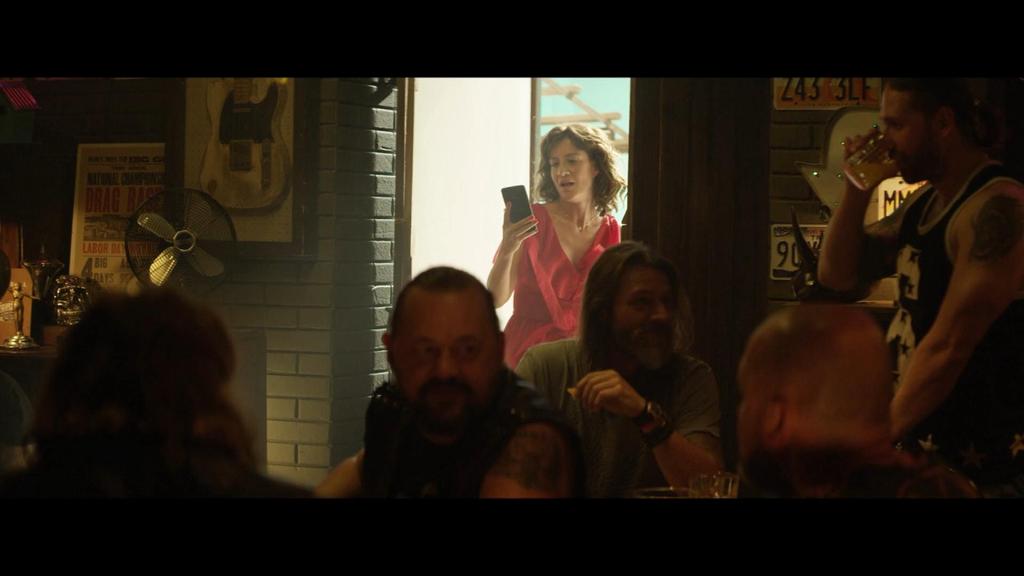
50 SHOW BUSINESS ENDORSEMENT FILM
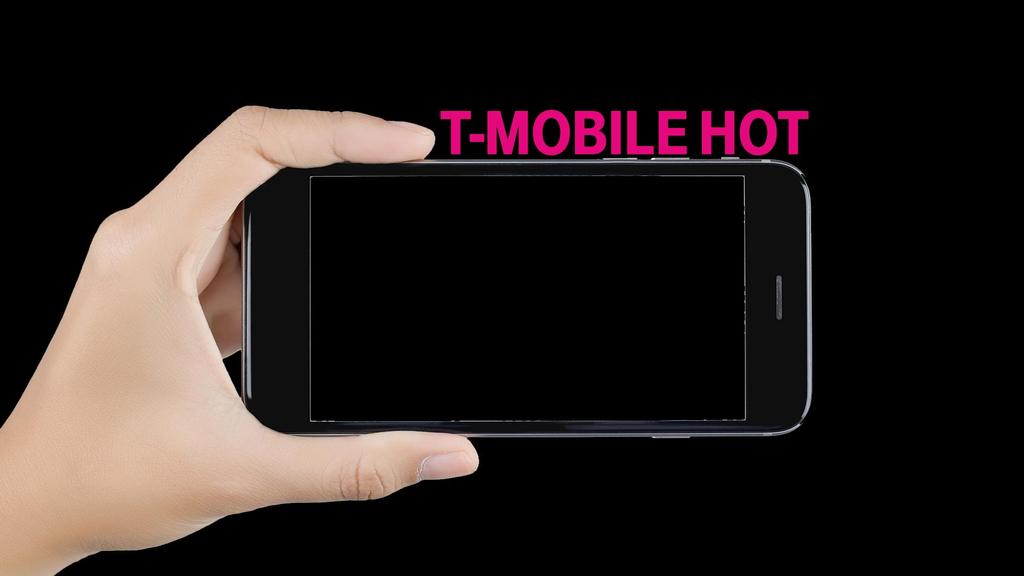
51 CHANGE OF T-MOBILE S COMMUNICATION PLATFORM SCOPE OF RESPONSIBILITIES ATL BTL EVENT MANAGEMENT PROGRAMMING CONTENT CREATION
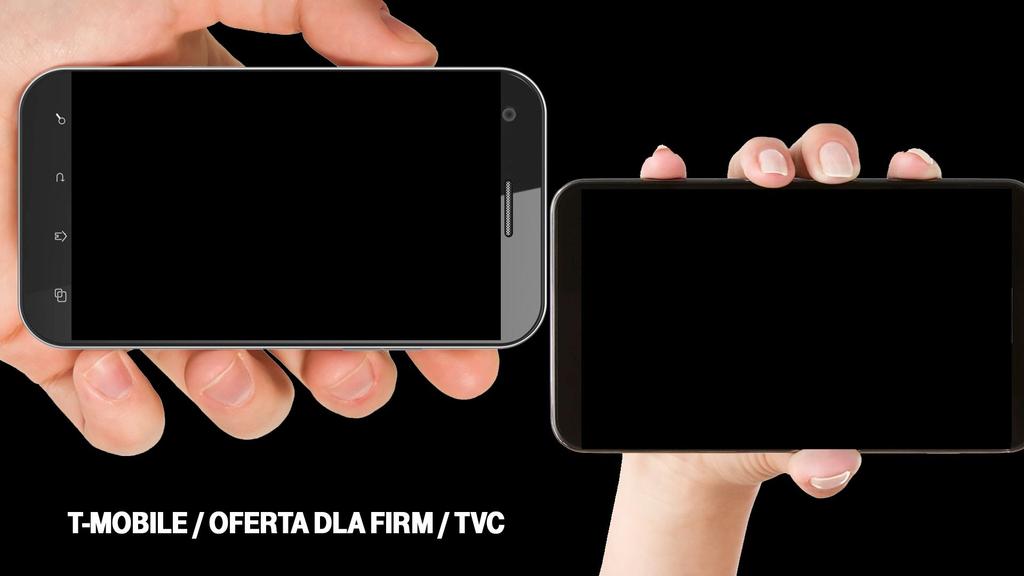


52


53
54
55 SMARTFONERIA CONCEPT
56 ELECTRONIC BEATS CONCEPT


57

58


59

60 DOOH AFTER THE INTERNET FASTEST GROWING MEDIUM IN THE WORLD* * PQ Media Digital Out-of-home media Worldwide 2014 Survey


61 DIGITAL OOH / OOH TV OUTDOOR LED INDOOR

62 OUTDOOR LED INDOOR
63 Source: Global digital OOH hand book update 2014, GLOBAL OOH MARKET

64 DIGITAL OOH IN POLAND MARKET CHARACTERISTICS: FAST GROWING MARKET SMALL RANGE - HUGE GROWTH POTENTIAL HIGHLY FRAGMENTED DOMINATED BY SMALL OPERATORS LACK OF INTEGRATION - A VARIETY OF HARDWARE, SOFTWARE, SERVICES WITHIN FEW YEARS OHH DIGITAL WILL BE NECESSARY TOOL FOR POLISH RETAIL NETWORK ESTIMATED NUMBER OF ALL OVER SCREENS ESTIMATED NUMBER OF ALL NETWORKS - OVER 200

65 SCREEN NETWORK MARKET SHARE Screen Network S.A. - it s a rapidly growing company in the industry Digital Out of Home in Poland. The company has existed since It specializes in building brand presence strategy in DOOH channel, planning and comprehensive implementation of the campaigns.

66 140+ LOCATIONS LED CITY NETWORK INFORMATION 140+ LOCATIONS DAILY VIEWERSHIP

67 53 LOCATIONS 22 LOCATIONS SCREENS SCREENS NO. OF TRANSACTIONS ATTENDANCE PER LOCATION


68 115 LOCATIONS PRESS BOOTHS RELAY 141 SCREENS INMEDIO 1MINUTE HUBIZ NO. OF TRANSACTIONS PER LOCATION PER 1 SQ.M. DEMOGRAPHICS 49,9% MEN 51,1% WOMEN


69 30 LOCATIONS 34 SCREENS AIRPORTS NO. OF TRANSACTIONS PER LOCATION DEMOGRAPHICS 55,8% MEN 45,2% WOMEN

70 41 LOCATIONS 141 SCREENS TRAIN STATIONS NO. OF TRANSACTIONS PER LOCATION DEMOGRAPHICS 50,6% MEN 49,4% WOMEN

71 84 LOCATIONS TUI 84 SCREENS NO. OF TRANSACTIONS PER LOCATION DEMOGRAPHICS 55,4% MEN 44,6% WOMEN


72 KEY ADVERTISERS
73 FINANCIALS

74 FINANCIAL RESULTS Q vs. Q3 2015

75 FINANCIAL RESULTS Q vs. Q MAIN SOURCES OF REVENUE

76 SALES REVENUE: Q3 EBITDA SALES REVENUE EBITDA

77 REVENUE STRUCTURE EBIDTA 2017

78