DIGITAL REVENUE OPTIMIZATION USING LISTENER Hightower Trail Bld. A, Ste. 100 Atlanta, GA
|
|
|
- Trevor Boyd
- 5 years ago
- Views:
Transcription

1 DIGITAL REVENUE OPTIMIZATION USING LISTENER 1215 Hightower Trail Bld. A, Ste. 100 Atlanta, GA

2 LISTENER APPROACH AND CASE STUDIES FUTURE FOR PUBLISHING AGENDA

3 LISTENER 3
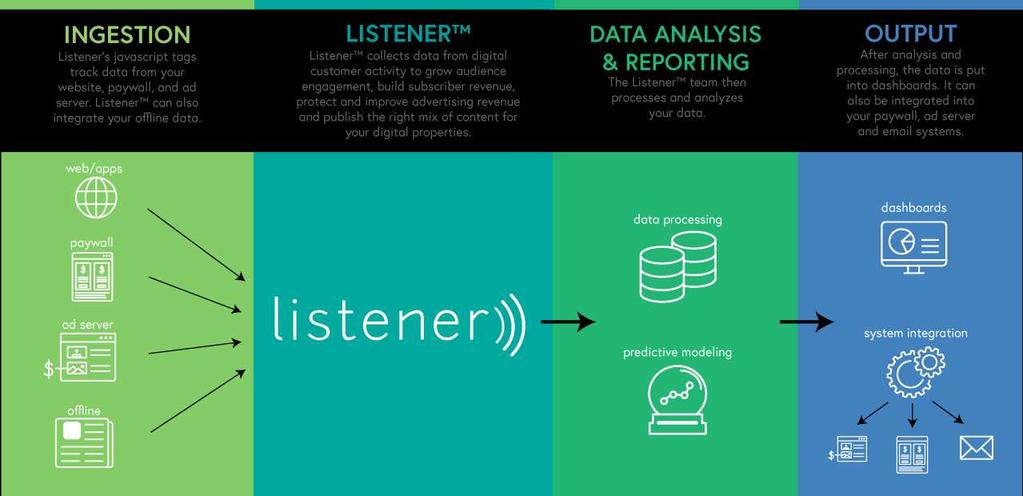
4 TECHNOLOGY OVERVIEW 4

5 AUDIENCE GOALS 5
6 PAID SUBSCRIBER ACQUISITION EXECUTION 6
7 2017 MILESTONES 1B PV/Month September M events per day 179% Growth year-over-year 22TB New Data processed each month 7
8 PRODUCT ROADMAP 2017 Q1: Launched Audience Package 2017 Q2: Development launched for the Content Module 2017 Q2: Launched Listener Tag Manager 2017 Q2: Launched metricsxchange digital benchmarking 2017 Q2: Patent pending 2017 Q3: Audience Hub and Clustering (add-on to AP) 2017 Q4: Finalize Content Module with Article Lifetime Value 2017 Q4: Productize digital user CLV and acquisition model 8
9 2017 CASE STUDIES IN PROGRESS Intelligent paywall Predictive modeling for digital acquisition First party data Economics of content Cart abandonment Targeted newsletter signups Behavioral clustering 9

10 APPROACH & CASE STUDIES 10


11 AUDIENCE SEGMENTATION FLYBYS 74% of users One page view/mo Social media referrers Goal: convert to repeat visitor STABLE USERS 10% of users 5 page views/mo 2-3 article views/mo Repeat visitors 4:51 minutes on site Goal: collect via registration FANATICS 2% of users 30 page views/mo 5 content areas 20% of Fanatics are already registered Multiple devices, e- edition, apps, Goal: convert AND retain subscribers 11
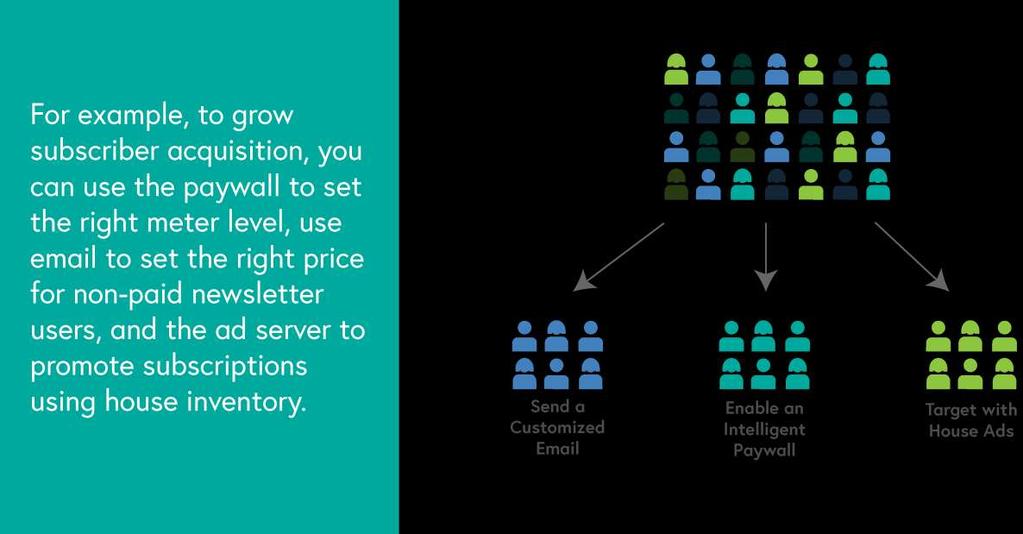
12 Anonymous Identified User Known USER TARGETING Low Medium High Heavy marketing to engage Minimal subscription offers Heavy ad targeting Targeted s based on preference subscription offers Segments for ad targeting Target content Enroll in elite membership program First party ad targeting Targeted s Retain/engage Engage and grow through social media, commenting Newsletter signup Registration Segments for ad targeting Register and convert to grow known audience Forced monetization: remove ad blocker or pay for content Engagement Level 12
13 OVERALL CONVERSION TRENDS Desktop converts better than mobile Direct (typed) traffic converts best Google shows the best social/search conversion Facebook shows the worst conversion Local converts better than non-local audience Content depends on market, property, quality etc. 13

14 DEVICE EXAMPLE LARGE METRO 0.04% of monthly users convert on Desktop vs. 0.01% on Mobile 0.34% users who hit the paywall convert on Desktop 14 vs. 0.15% on Mobile

15 REFERRER EXAMPLE LARGE METRO Of the users who hit the paywall, the conversion rate by referrer is: 0.47% Direct 0.16% Google 0.07% Facebook 15
16 Unique Users AUDIENCE EXAMPLE LARGE HYPERLOCAL 0.200% 0.180% 0.160% 0.140% 0.120% 0.100% 0.080% 0.060% 0.040% 0.020% 0.000% 0.015% 0.029% Conversion Rate 0.065% 0.189% 0.009% 0.035% 0.143% 16
17 Anonymous Users Conversion Probability ANONYMOUS USER PROPENSITY Acceleration in page views and unique days for local users are best predictors RECOMMENDATION: apply user targeting to high propensity users with a custom subscription offer without the traditional checkout process Anonymous User Conversion Estimate Users Seen an Offer Selected an Offer Reached Payment Probability 90,000 80,000 70,000 60,000 50,000 40,000 30,000 20,000 10, User Conversion Rank 0.30% 0.25% 0.20% 0.15% 0.10% 0.05% 0.00% 17
18 18 INTELLIGENT PAYWALL FORECASTING Incremental Revenue Incremental Subscribers Incremental Revenue Estimate - Conversion Impact 12-month Sub Revenue 12-month Advertising Risk 12-month Net Subscribers $700,000 3,500 $600,000 3,000 Incremental subscription revenue at different meter settings $500,000 $400,000 $300,000 $200,000 $100,000 $83,429 $130,497 $200,657 $324,996 2,500 2,000 1,500 Incremental advertising revenue risk at different meter settings $0 -$100,000 -$200,000 -$300, $8,669 -$23,211 -$50,267 -$105,628 Meter Setting (number of free articles per user) 1,
19 TARGETING TEST Over 3X conversion for users identified as high propensity Users were targeted based on acquisition propensity via Volumes are low due to small list of engaged registered non-paid users testing confirmed and refined the model Now launching campaign for newsletter opt-ins who are not registered and for anonymous users through paywall List Name s sent Open rate Click rate Total conversions Conversion rate Rank 3 - Mather Ranking of most likely to convert 2, % 1.20% % Rank 2 6, % 1.83% % Rank % 0.76% % Rank 0 (random registration list that ST picked) 7, % 0.51% % 19


20 AD SERVER TARGETING USING HOUSE ADS 2X conversions targeting engaged users vs. control 20
21 FIRST PARTY DATA 9% of entities matched from current and former Dispatch subscribers 16% of entities matched from all Blue Jackets ticket buyers 2,400 entities (11% of matches) accessed content online Matched 21,416 The Columbus Dispatch 221,247 Columbus Blue Jackets 116, , ,663

22 LOOKALIKE AUDIENCES Statistical analysis completed on subscribers in the local DMA 210,238 subscriber entities given a ticket score Statistical analysis completed on anonymous users in the local DMA 625,986 entities given a ticket score Columbus Dispatch current and previous subscribers ranked from 0 to 100 on probability of buying Blue Jackets tickets Columbus Dispatch anonymous web visitors ranked from 0 to 100 on probability of buying Blue Jackets tickets
23 FIRST PARTY DATA TAKEAWAYS 15-20% lift in engagement vs. comparable ad sizes for advertiser 9:1 ROI for SEO 18:1 ROI for display Known users are key to growing value of advertising Improves yield for local direct advertising sales Can be connected to programmatic exchanges, retargeting tools, and DMPs See the article in our new monthly newsletter! = 23
24 CONTENT MODULE 24

25 DRILL DOWN TO ARTICLE LEVEL 25

26 KEY METRICS BY ARTICLE AND AUTHOR Internal, direct, fanatics, local, desktop rank high for conversion 26
27 Share Ratio BREAKDOWN CONTENT/ARTICLE 35% 30% 25% 20% 15% 10% 5% 0% Fanatics Audience Size by Content Type Share Ratio 50% 40% 30% 20% 10% 0% 27


28 EACH ARTICLE AND AUTHOR ARE SCORED 28

29 FUTURE 29
30 2018 REVENUE GENERATION Subscriber revenue growth Digital & Print Nurturing users with targeted messaging Registration for incremental access to content Growing known users onsite Intelligent paywall + dynamic metering Article lifetime value First party data for advertising yield 30