EVERYTHING COMPETES WITH. Everything
|
|
|
- Bryan Wood
- 5 years ago
- Views:
Transcription


1 EVERYTHING COMPETES WITH Everything

, US only,")
2 THE EVOLUTION OF ADVERTISING New Metrics for New Channels PRINT BILLBOARDS RADIO DIRECT MAIL TV DESKTOP MOBILE CONNECTED DEVICES CROSS- EVERYTHING Subscribers Traffic Listeners Households Nielsen Rating Points CTR CPM/CTR CTR/CPC/CPA ROI/Sales/Brand Lift MEASUREMENT METRICS Source: From One Screen to Five, FBIQ in conjunction with Millward Brown Digital and Firefly Millward Brown, (commissioned by Facebook IQ), US only, March
3 NO CORRELATION TO ROI
4 4
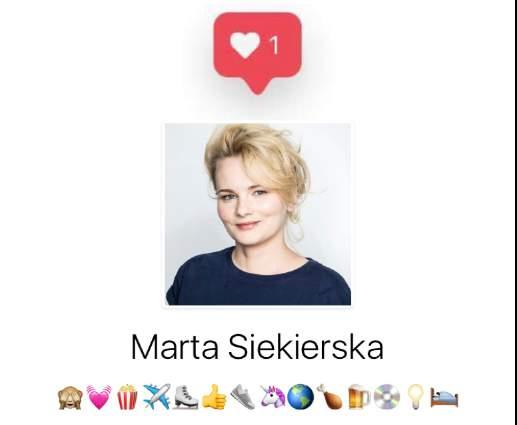
5 MARTA SIEKIERSKA


6 People thumb through one Big Ben every day on feed.

7 AWARENESS MESSAGE ASSOCIATION PURCHASE INTENT Mobile-optimized creative increases the probability of brand lift Mobile-optimized creative increases the magnitude of brand lift Index Index 2X 2.6X 4.5X 2.1X 3.4X 4.8X Results as measured by Nielsen Brand Effect / Millward Brown Brand Lift and indexed to EMEA norms as of June 2015
 MOBILE")


8 ORIGINAL TVC OPTIMIZED FOR MOBILE (10 SECS) MOBILE OPTIMIZED VERTICAL VIDEO Bose Sponsored Bose Sponsored VS + 20% More people completed viewing the optimized video +10PTS Ad Recall, +6pts higher than original TVC

9 Understanding real results drives real business growth


10 Siloed measurement of channels leads to missed results TV Desktop Mobile In-App GRP CTR CPM CPA NO COMMON DENOMINATOR OR CONNECTIONS BETWEEN CHANNELS FOR MEASUREMENT 11


11 MEASURING ACROSS EVERYTHING UNDERSTANDING VALUE


12 Metrics That Matter Proxy metric True value Cookies only People Clicks Lift CPM True ROAS and ROI
. Based on net spending Facebook ROI is 1.")
13 Get more for your money with Facebook Facebook campaigns have more impact per PLN spent than TV, based on: ROI, Cost per GRP (-19.1%) and Cost per Reach-Points (-45.6%). Off-target impressions are high in TV (62.8% of measured TV contacts were outside of the target group, whereas only 7.6% with Facebook). Based on net spending Facebook ROI is 1.4 times higher than TV ROI. ROI: TV: 1.5PLN Facebook: 2.1PLN Based on 5 CPG cross-platform campaigns (TV and Facebook) Source: GfK Poland Crossmedia Link Base: 15+ years, 32,7m
14 Maximizing the number of contact on Facebook increases sales impact faster For a given number of total impressions the impact is highest if the distribution between TV and Facebook 45:55 Total 15+ Upifts / weekly contacts Uplifts / weekly contacts ,00 1,06 1,10 1,13 1,15 1 1,11 1,18 1,22 1,26 1,28 2 1,18 1,26 1,30 1,34 1,36 3 1,24 1,32 1,36 1,40 1,42 4 1,28 1,36 1,41 1,45 1,47 5 1,32 1,40 1,45 1,49 1,52 1,54 6 1,35 1,43 1,49 1,52 1,55 1,58 5 1,17 1,30 1,38 1,45 1,50 6 1,19 1,32 1,40 1,47 1,52 1,56 1,60 Reading Example: 6 Facebook contacts and no TV contact generate an uplift of 1,35. 6 TV contacts and no Facebook contact generate an uplift of 1,19. 3 TV and 3 Facebook contacts (total 6 contacts) generate an uplift of 1,40. In terms of 6 contacts* the combined mid-contacts 2TV/4FB have the highest effectiveness Ø Net Campaign Reach in % TV: 87,2% FB: 15,7% *Based on 5 CPG cross-platform campaigns (TV and Facebook) ** The chosen example of 6 contacts is an examplatory contact dosis Source: GfK Crossmedia Link Base: 15+ years, 32,7m
15 Norms: EU on target % Average GENDER AGE SPAN SIZE INDUSTRY AVERAGE FACEBOOK AVERAGE M, F Broad: >30 years 62% 92% M, F Medium: years 43% 84% M, F Narrow: 15 years 32% 66% Source: Nielsen Digital Ad Ratings through 3/31/2016, *EU contains data from France, Germany, UK and Italy Sample Requirements: Industry = 30 site observations, Facebook = 3 campaigns

16 Clicks aren t a good proxy for brand results There is no significant correlation between click through rate (CTR) and any nielsen brand effect metrics AD RECALL BRAND AWARENESS PURCHASE INTENT % POINT LIFT % POINT LIFT 43. % POINT LIFT CTR (%) CTR (%) CTR (%) CTR (%) CTR (%) CTR (%) CTR (%) CTR (%) CTR (%) CORRELATION IS LESS THAN 1% Source: Nielsen BrandEffect meta-analysis of 478 online global campaigns that ran between Oct 2014 April 2015
 meta analysis: There is no correlation between CTR and ROI Source: Nielsen NetEffect CPG home scanner panel, meta-analysis of 200+ online")
17 Clicks are not a proxy for sales 1400% Click-through rate vs. ROI 900% ROI% 400% -100% 0.00% 0.10% 0.20% 0.30% Click-through rate Correlation (R 2 ) -.07% Nielsen NetEffect (CPG) meta analysis: There is no correlation between CTR and ROI Source: Nielsen NetEffect CPG home scanner panel, meta-analysis of 200+ online campaigns, October 2009


18 Measuring the wrong metrics costs advertisers more CLICKY USERS ARE 5.5 x more expensive than the 50% of users that are least clicky Source: Placeholder text. 19 Source: Facebook Marketing Science, internal data, US Mobile News Feed, 28 day average, July, 2016
19 Clicks are not a good proxy for Business Performance IN-STORE SALES 90 %+ of people who viewed ads and then bought, did not click Source: Facebook internal data, based on Datalogix analysis of 50 CPG campaigns in Q3 2012, analysis of a major Telco campaign in September 2013


20 Bank Zachodni WBK Reaching a wider audience with Facebook video ads Thanks to Facebook and Instagram, we were able to target efficiently and make a significant impact on the perception of the BZ WBK brand. According to brand lift studies after the campaign, favourability increased, which is a big achievement in the retail banking vertical. We are very excited to work closely with Facebook on our next projects." What s on your mind? Wioleta Białowąs, Media Strategy, Digital Communication, Bank Zachodni WBK 23-point 3.7 -point 15 -point increase in ad recall lift in brand favourability This established retail bank found that Facebook ads resulted in a 23- point lift in ad recall and a 3.7 -point boost in brand favourability. increase in willingness to recommend among people aged 18-24


21 Driver of Performance: Placement Optimization Drive efficiencies by optimizing across Facebook, Instagram and Audience Network Placement Optimization vs. Facebook-only 1 15 % Increase in Brand Awareness % Incremental reach 5.2 % Lower CPM +6.4 % Incremental reach with Reach and Frequency 5.8 % Lower cost per person reached 1. Measured by consumer Attention 2. Video Views is the number of times your video was viewed for over 3 seconds or more. 3. White Post Engagement is not a recommended driver of advertiser ROI, buying across the family of apps does increa post engagement results. Numbers represented are averages. Source: Facebook Internal Data, August 2016
22 THE NEXT CONSUMER SHIFT DESKTOP TO HANDHELD TELEVISION TO MOBILE VIDEO FEED TO STORIES


23
 1.")

24 PERFORMANCE case study 33% lower cost per reservation (vs other ad formats) 1.5M people reached OpenTable used ads in Instagram Stories to drive online restaurant reservations and make its ad campaigns more efficient, resulting in a 33% lower cost per reservation versus other ad formats.


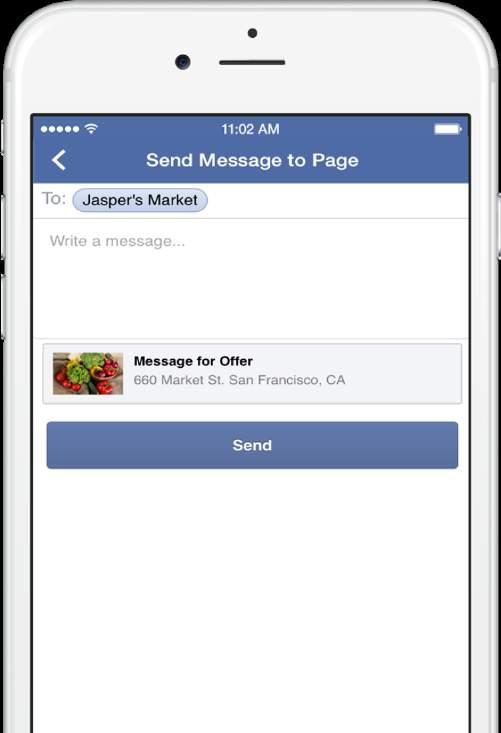
25 Introducing Branded content Bring your existing branded content deals to Facebook. Business partners that have been tagged in the posts will be able to: SEE METRICS SEE SPEND SHARE & BOOST


26 BUZZFEED TASTY + RITZ CRACKERS SUCCESS STORY RITZ CRACKERS PARTNERED WITH BUZZFEED S TASTY FOOD CHANNEL TO CREATE A BRANDED, MADE-FOR-FACEBOOK RECIPE VIDEO, RESULTING IN AN INCREMENTAL SALES LIFT AMONG NEW AND EXISTING CRACKER BUYERS. 2.1 % 1.4 % 1.2X Sales lift among new buyers Lift in household penetration with branded video Return on ad spend Buzzfeed used Facebook s branded content product to feature a holidaythemed recipe video with RITZ Crackers. It tested 2 videos with different degrees of brand integration and measured the campaign with a DLX study. Buzzfeed discovered that the video with the heavier brand integration performed better in terms of sales lift. Source:


27 No. 30


28 ON-THE-GO LEAN FORWARD LEAN BACK IMMEDIATE INTERACTIVE IMMERSIVE


 + 10PT Message")
 Short Video")


29 Use placements and creatives to match goals REACH AND BRAND AWARENESS ENGAGEMENT COMPLETED VIEWS + 16PT Ad recall (2x P&G average) + 10PT Message Association (4x P&G average) Short Video Instagram Stories Facebook Live Long form video ON-THE-GO LEAN FORWARD LEAN BACK Short bursts of attention High, captivated attention 32


30 33

31 Thank you 34