Aligning DMO Metrics in Reporting ODMO 2017 Winter Conference
|
|
|
- Magnus Riley
- 5 years ago
- Views:
Transcription

1 Aligning DMO Metrics in Reporting ODMO 2017 Winter Conference Kari Westlund, President & CEO


2 DMO Reports Reviewed Seaside COVA Travel Portland Visit Tillamook Coast OCVA Visit Corvallis Visit Bend Travel Medford Travel Oregon Washington County Visitors Association Visit Tualatin Valley Travel Lane County Eugene, Cascades & Coast Clackamas County Tourism & Cultural Affairs Oregon s Mt. Hood Territory Travel Salem
3 Community Connections Content Mission Statement 11/13 Staff Roster 3/13 2 with photos Board Roster 10/13 2 with photos CEO Message 8/13 4 with photos Local Government Share of TLT/TRT Emphasis area for Bend and Medford Grant Programs Out 5/13 Level of Detail Varies Product Development 11/13 Details Later in Deck
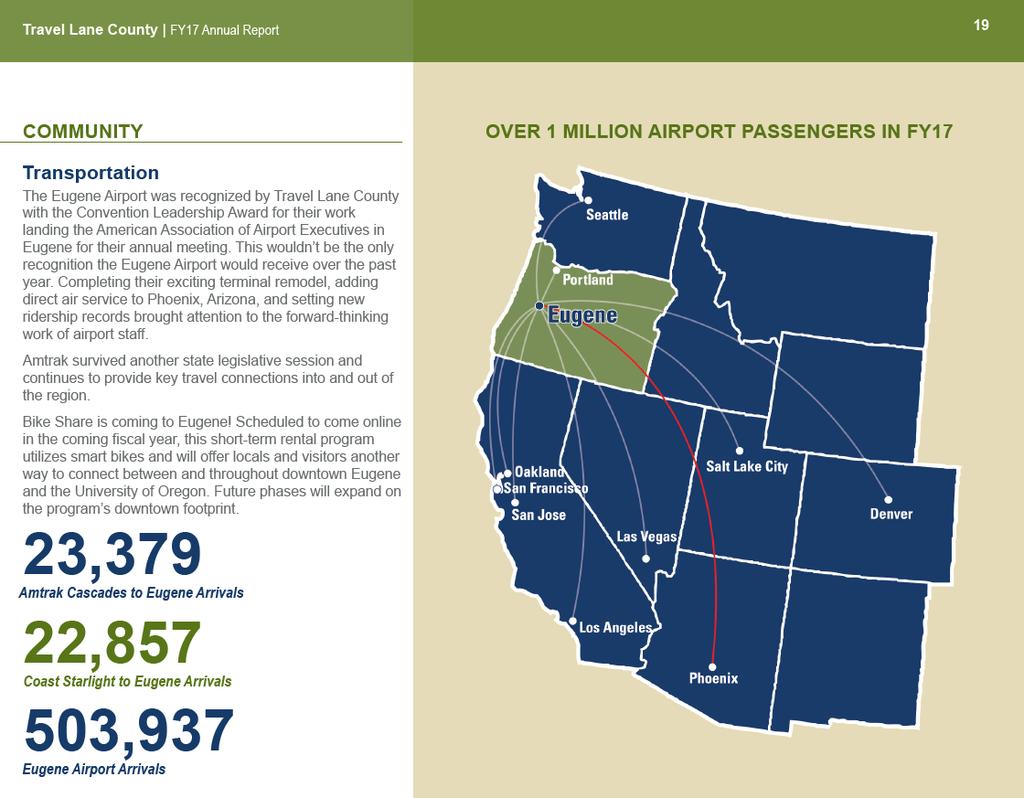
4 Industry Health Metrics Transient Room Tax 11/13 Visitor Volume 6/13 Economic Impact11/13 Visitor Spending 10/13 Jobs 9/13 Earnings Local/State Tax Generation Rail 1/13 Hotel Statistics 10/13 Occupancy 8/13 ADR 6/13 RevPAR 4/13 Demand/Rooms Sold 4/13 New Development Air Service 5/13

5 Industry Health Metrics
6

7 Industry Health Metrics

8 Industry Health Metrics
9 January February March April May June July August September October November December 16 Hospitality Indicators Full 2016 Calendar Year Occupancy Rate Calendar Year Occ % Change Demand % Change Room Revenue % chng Ave Daily Rate % Chng RevPAR % Change Room Supply % 10.00% 5.00% 0.00% 11.80% Springfield Eugene Lane County Oregon U.S. Calendar Year 2016 TRT Growth 7.50% 5.90% 13.80% Eugene Springfield Florence Cottage Grove 11.70% 10.20% 10.50% Other Total County Turnover $450,000 $400,000 $350,000 $300,000 $250,000 $200,000 $150,000 Springfield Lodging Revenues By Month

10 Lane County Room Tax Collections by Fiscal Year $12,000,000 $11,603,578 $10,546,243 $10,000,000 $9,441,491 $8,282,726 $8,000,000 $6,611,718 $7,229,995 $6,769,782 $6,273,289 $6,879,677 $7,242,202 $7,519,298 $6,000,000 $4,000,000 $2,000,000 $- FY07 FY08 FY09 FY10 FY11 FY12 FY13 FY14 FY15 FY16 FY % 15.00% 10.00% 5.00% 9.90% 9.35% Actual Lane County TLT Change from Prior Year 9.67% 10.15% 5.27% 3.83% 13.99% 11.70% 10.03% 0.00% -5.00% % -6.37% -7.33% FY07 FY08 FY09 FY10 FY11 FY12 FY13 FY14 FY15 FY16 FY17

11
12
13
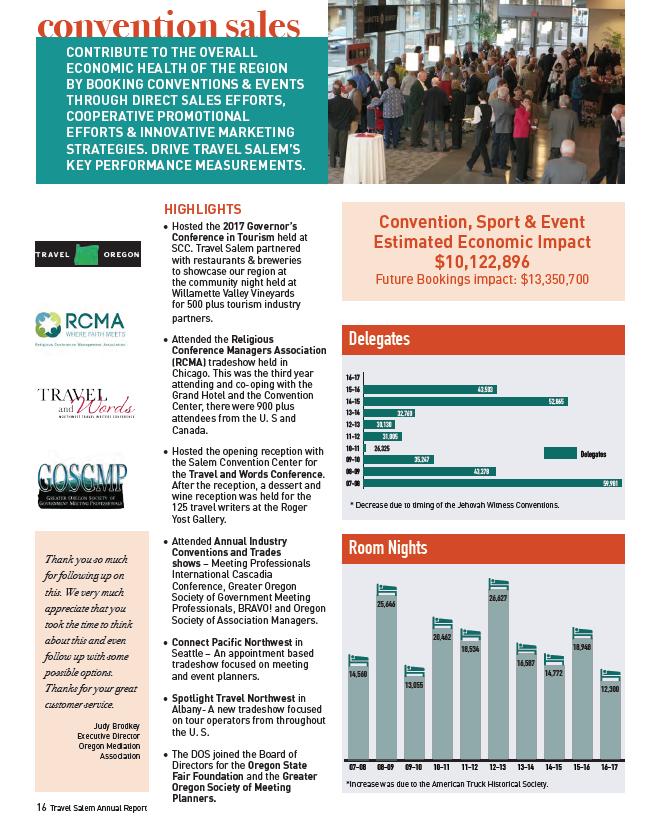
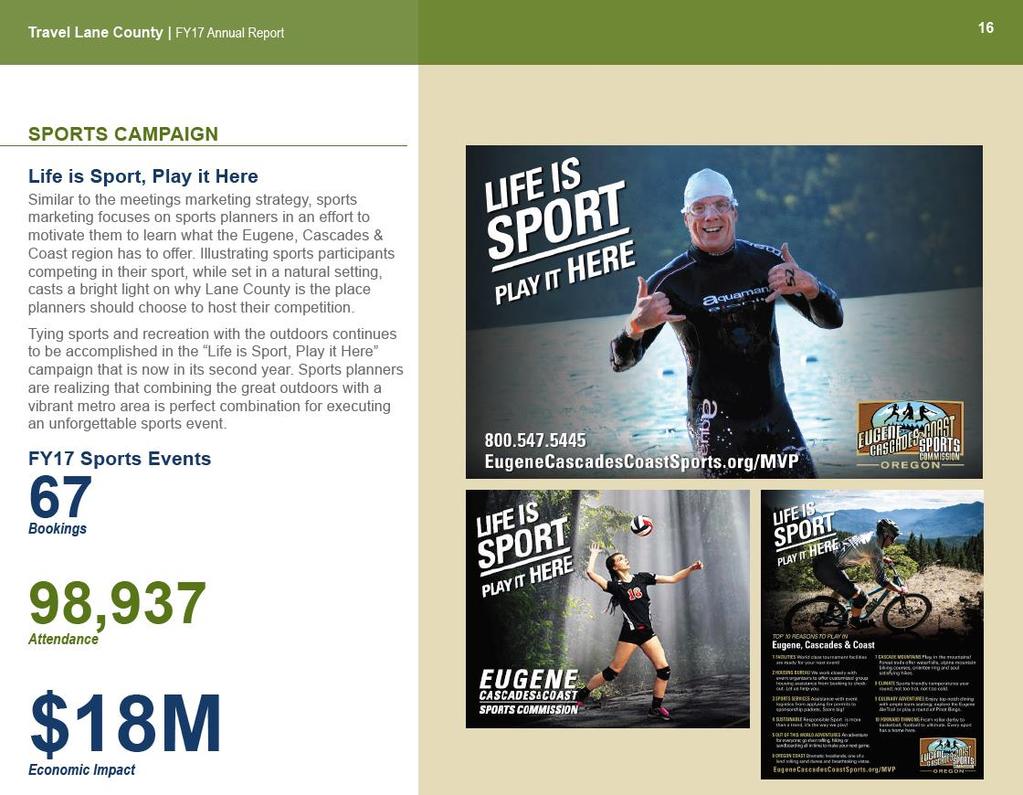
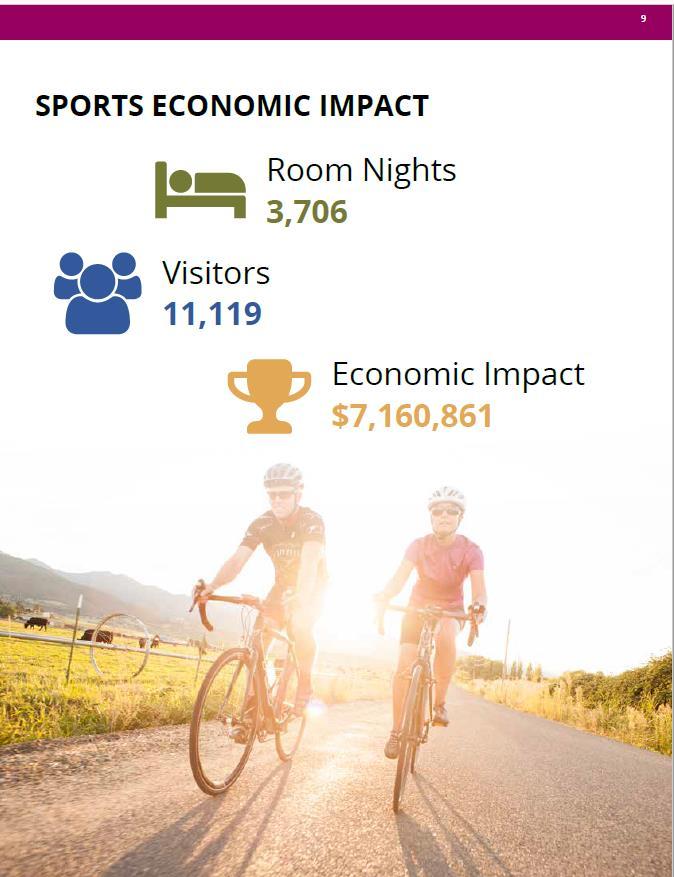
14 Program Performance Metrics Convention Data 9/13 # Groups Booked # Room Nights Projected # Delegates Projected $ EEI of Bookings # Events Held/Delegates/Rm Nights Convention Trade Shows Attended Appointments Contacts Attendance Sports Event Data 7/13 # Groups Booked # Room Nights Projected # Participants Projected $ EEI of Bookings # Events Held/Delegates/Rm Nights Sports Trade Shows Attended Appointments Contacts Attendance
15

16
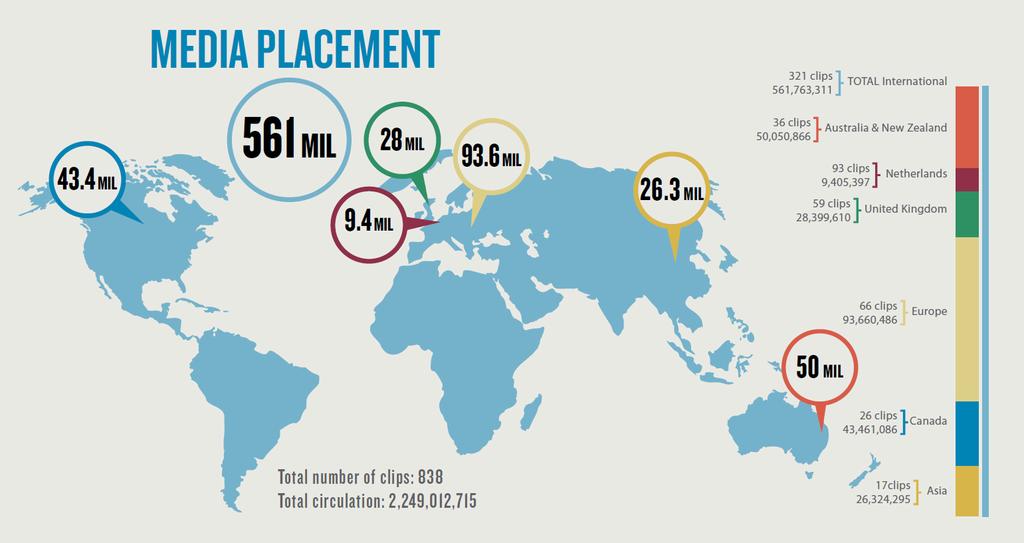
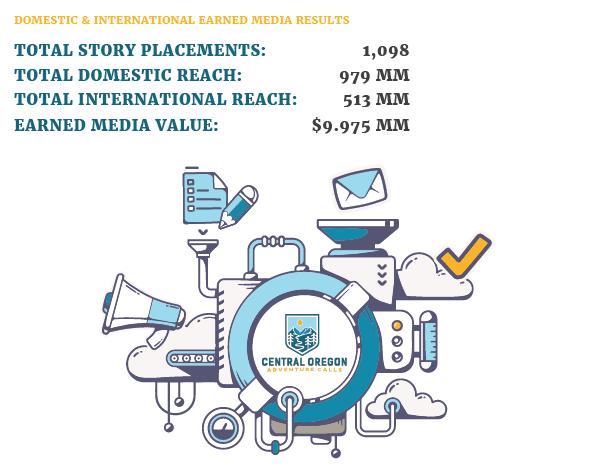
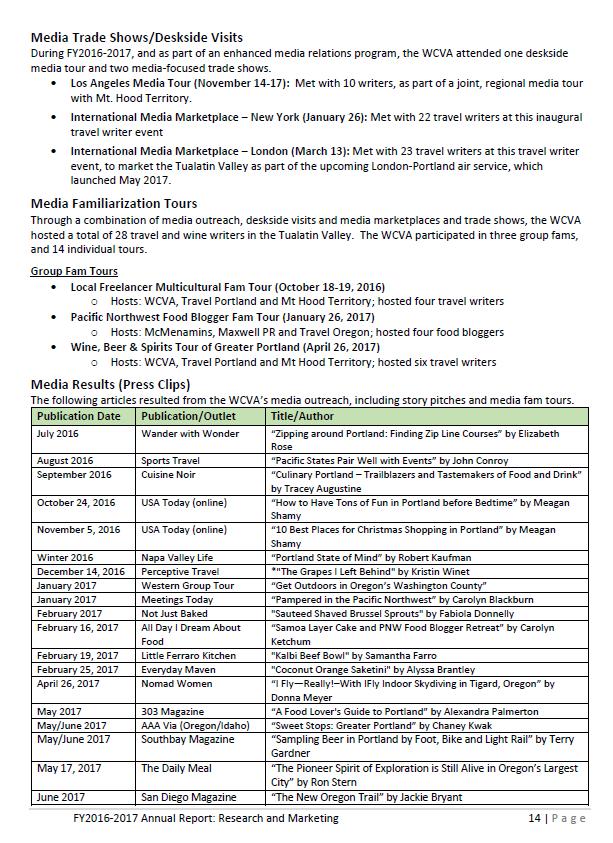
17 Program Performance Metrics Customer Satisfaction Data 4/13 Convention Center Ratings Convention Services Ratings Visitor Ratings via Survey Social Media Listening Analysis Helpful Rating of Web Site Earned Media 10/13 # Media Fams # Articles Generated Reach of Articles Value Equivalency of Articles Domestic vs International Visitor Guide 9/13 # Distributed Distribution Breakdowns
18

19
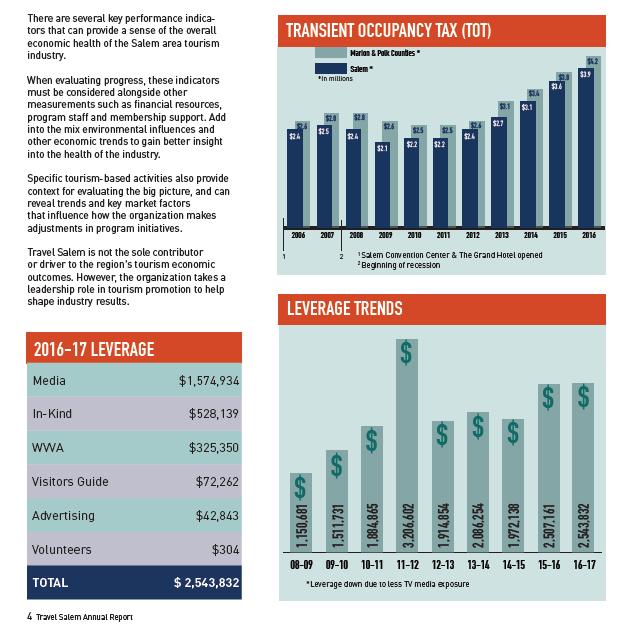
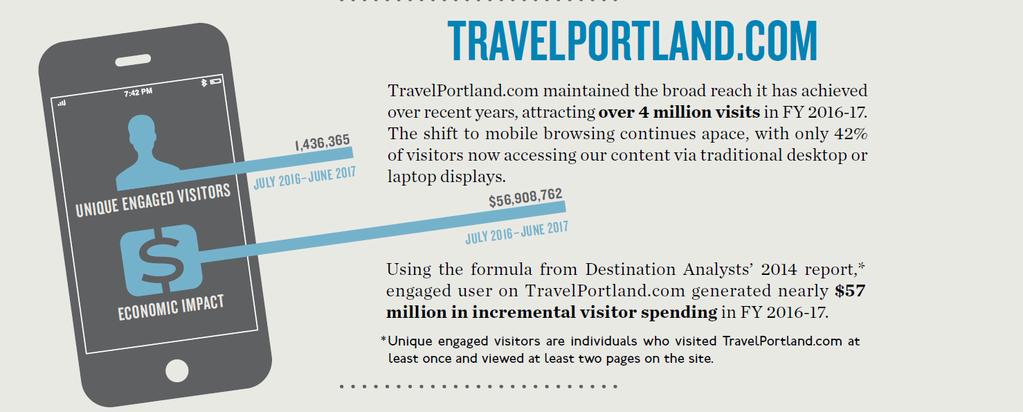
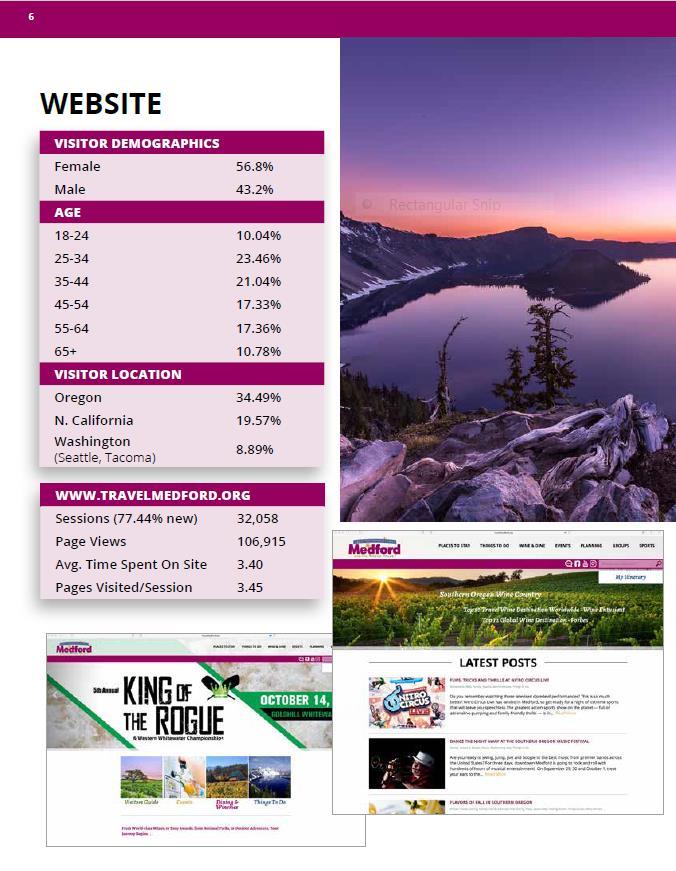
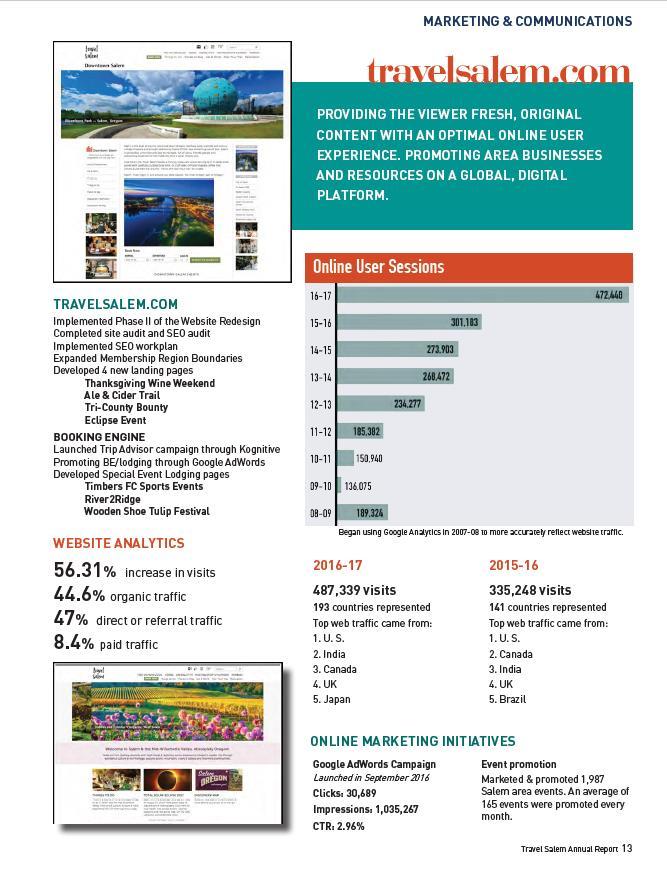
20 Program Performance Metrics Program ROI 4/13 Trvl Ln Cnty - By Program and Overall Travel Medford - Public Share of TRT compared to DMO share of TRT T.O. Advertising ROI Travel Salem Leverage Match to TRT (media, in-kind, WVVA, VG ads, Vol Val) E-News Subscribers 2/13 Open Rate Engagement Website 10/13 Sessions Unique Users User Profiles Demo/Origin Acquisition Page Views & Top Pages Viewed SEO Audit & Other Projects EEI Launch / ReDesign Engagement Metrics - downloads
21
22
23
24
25
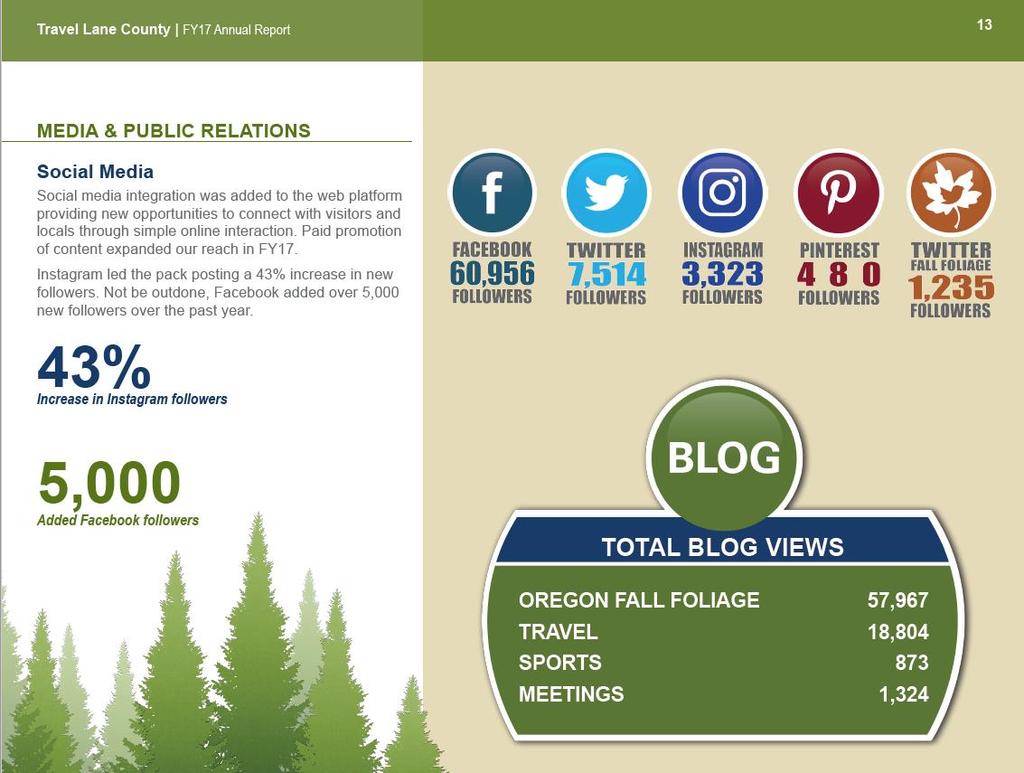
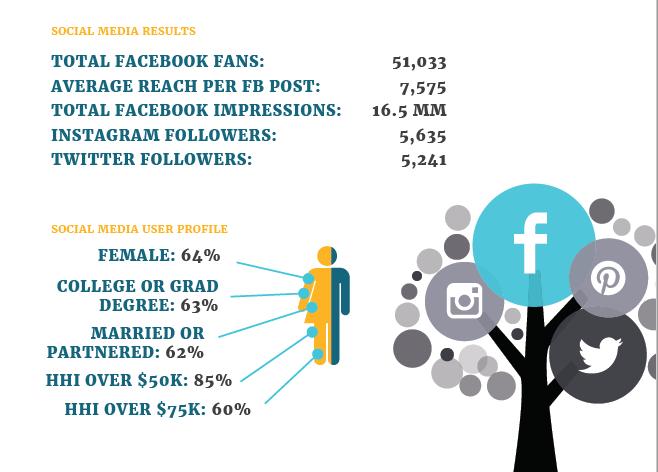
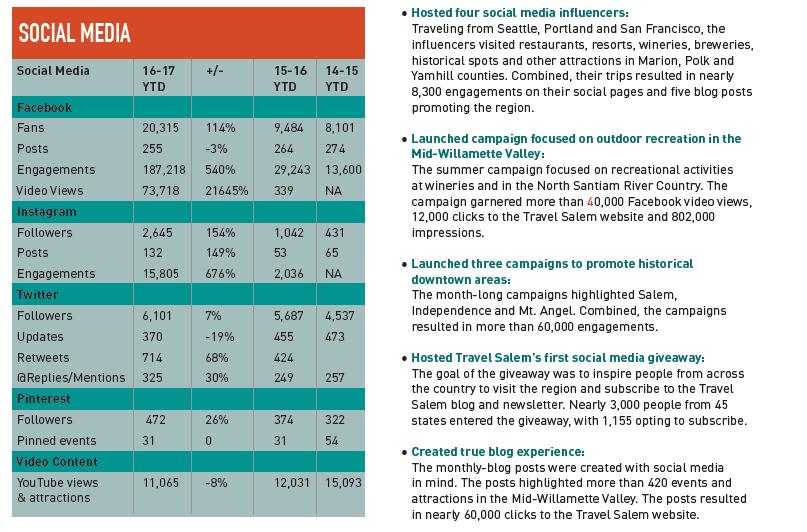
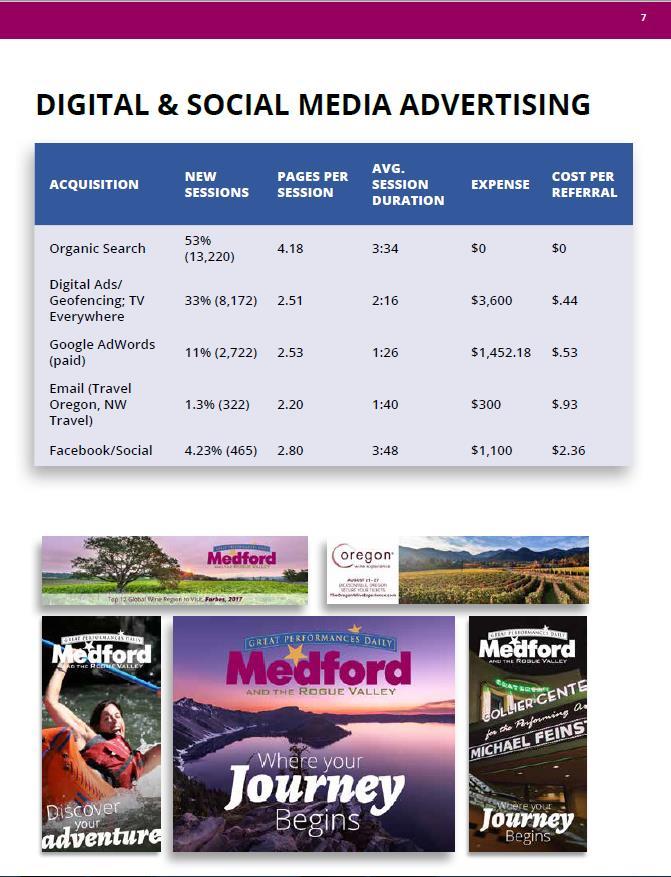
26 Program Performance Metrics Social Media 8/13 FB Fans/Followers Instagram Twitter Profile Data & Geo Origins Impressions / Engagements by channel Growth Rates by channel Ad Spend & Results by channel Blog Views Stories Published Marketing 13/13 Brand Refresh & Defined (Pillars) Campaigns and Results By Media Impressions, CTR Trade Shows, Contacts Fams, results RCTP Program Results Awards Won Projects if not campaigns Video & Photo Development Domestic vs International
27
28
29

30
31
32
33 Program Performance Metrics Visitor Services 9/13 By Month and Origin VIC Visits Trail Completions Maps Distributed Interactions or Fulfillments Geo-Analysis Kiosk Deployment and Profile Data Mobile VIC Deployment & Results Volunteer Hours Research 9/13(+) DMA West Web Study (4) Golf Traveler Profile Visitor Profiles Intent to Travel Data Stakeholder Surveys Visitor Geo-Analysis by media Brand Awareness Campaign Analytics Ad Effectiveness Travel Barometer Impacts & STR
34
35

36
37
38 Program Performance Metrics Development 11/13 Product Development Trails, Maps, Gift Cards Studios, Trainings Destination Development Wayfinding Byways, Bikeways Facilities Public Art Member Data 4/13 Number Growth Geo-Breakdown Category Breakdown Revenue

39

40 Financials
41 Report Formats & Length
42

43
44

45