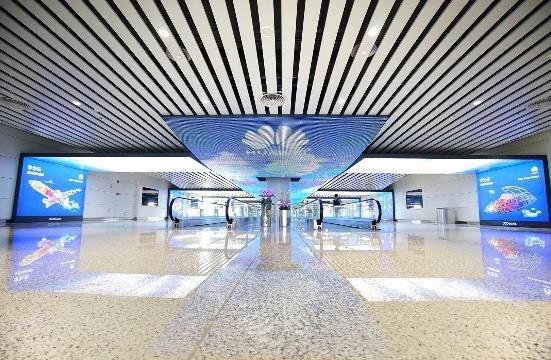
H RESULTS. July 26 th, Digital immersive corridor, Guangzhou Baiyun International airport (Terminal 2), China
|
|
|
- Shanna McKinney
- 5 years ago
- Views:
Transcription

1 H RESULTS July 26 th, 2018 Digital immersive corridor, Guangzhou Baiyun International airport (Terminal 2), China


2 BUSINESS OVERVIEW H Jean-Charles Decaux Chairman of the Executive Board and Co-CEO
3 H RESULTS In million Euros, except %. Adjusted figures (1) except when IFRS. H H Revenue (2) 1, , % Operating margin % EBIT before impairment charge (3) % Net income Group share before impairment charge, IFRS (4) % Net income Group share, IFRS % Net cash flow from operating activities % Free cash flow % Net debt as of end of period, IFRS (1) Adjusted figures include our prorata share in companies under joint control accounted for using the equity method under IFRS 11. (2) The 2017 comparative figures are resta ted f rom the retrospec tive application of IFRS 15 Revenue f rom Contracts wi th Customers, applicable from January 1 st, The application of IFRS 15 leads to the change in presentation of invoices relating to adv ertising taxes. The impact on previously published H figures is million onadjusted revenue. There is no impact on operating margin. (3) The impact of the impairment charg e on EBIT in H corresponds to a - 0.8m impairment on intangible assets and PP&E and a 0.7m reversal on provisions for onerous contracts. Th e impact of the impairment cha rge on EBI T in H corresponds to a + 3.0m reversal on impairment on intangible assets and PP&E and a + 0.6m reversal on provisions for onerous contracts. (4) The impact of the impairment charge on Net income Group share in H corresponds to an impairment charge on intangible assets and PP&E and a reversal on provisions for onerous contracts (net of tax and net of the impact on minority interests) for - 0.1m. The impact of the impairment charge on Net income Group share in H corresponds to a reversal on impairment on intangible assets and PP&E and a reversal on provisions for onerous contracts (net of tax and net of the impact on minority interests) for + 2.1m. Please refer to the Appendices section for financial definitions. 3
4 H ADJUSTED REVENUE GROWTH BY SEGMENT Reported growth (%) Organic growth (%) (1) +7.0% +2.9% +4.0% +1.2% -1.2% -0.5% -2.8% Street Furniture Transport Billboard Group Street Furniture -0.9% Transport Billboard Group (1) Organic growth = excluding acquisitions / divestitures and the impact of foreign exchange. 4
5 ACCELERATION FROM Q TO Q % Organic growth (%) (1) +7.0% +2.1% +3.5% +2.9% +5.0% +2.8% +4.9% +4.0% -0.6% -1.1% -0.9% Q Q H Q Q H Q Q H Q Q H Street Furniture Transport Billboard Group (1) Organic growth = excluding acquisitions / divestitures and the impact of foreign exchange. 5
6 H ADJUSTED REVENUE GROWTH BY REGION +14.5% Organic growth (%) (1) +2.5% +6.1% +0.7% +0.1% +4.0% Europe (2) Asia-Pacific -4.7% France Rest of the World United Kingdom North America Group (1) Organic growth = excluding acquisitions / divestitures and the impact of foreign exchange. (2) Excluding France and the United Kingdom. 6
7 H ADJUSTED REVENUE BREAKDOWN Billboard 14.7% Street Furniture United Kingdom North America 10.5% 7.7% 27.2% Europe (1) 45.2% Rest of the World 12.7% Transport 40.1% France 17.5% 24.4% Asia-Pacific (1) Excluding France and the United Kingdom 7
8 STRONG EXPOSURE TO FASTER-GROWTH MARKETS In million. Adjusted figures. 26% 29% 32% 34% 37% 36% 37% 36% 37% 1,185 1,236 1,275 8% H H Revenue from faster-growth markets Faster-growth markets' revenue as a % of Total revenue "Faster-growth markets include Central & Eastern Europ e (excl. Austria), Baltic countries, Russia, Turkey, Ukraine, Latin America, Asia (China incl. Hong Kong and Macau, Mongolia, Thailand, South Korea, Singapore, India), Africa, Middle-East and Central Asia. 8
9 DOOH DRIVES GROWTH Breakdown by segment Adjusted figures +31% CAGR H H % Billboard 5.1% Street Furniture 14.7% Billboard 7.5% Street Furniture 7.9% 9.9% 11.5% 15.6% 40.4% 52.1% 80.2% H H H H H Transport Transport Group digital revenue as a % of total Group revenue 9

10 STRONG GROWTH OF DIGITAL STREET FURNITURE Adjusted figures +72% CAGR 16.6% 12.6% 2.3% 4.4% 6.4% H H H H H Street Furniture digital revenue as a % of total Street Furniture revenue Digital free-standing street furniture, Dublin, Ireland 10

11 DIGITAL CONTINUES TO DRIVE STRONG GROWTH IN TRANSPORT Adjusted figures +18% CAGR 21.9% 24.1% 17.2% 17.6% 19.0% H H H H H Transport digital revenue as a % of total Transport revenue Digital arch at the entrance of Linate International airport, Milan, Italy 11

12 DIGITAL BILLBOARD: LESS IS MORE Adjusted figures +45% CAGR 4.9% 6.5% 8.1% 9.5% 2.3% H H H H H Billboard digital revenue as a % of total Billboard revenue Digital billboard, Edinburgh, United Kingdom 12
 57% 44% 17% 13% Digital bus shelter, New York, United States 13")
13 4 COUNTRIES GENERATE 68% OF DIGITAL REVENUE IN H Digital penetration (% of country revenue) 57% 44% 17% 13% Digital bus shelter, New York, United States 13
14 RECENT CONTRACT WINS & RENEWALS STREET FURNITURE New contracts STREET FURNITURE Contract renewals / extensions Myanmar Singapore Yangon street furniture Singapore street furniture The Netherlands The Hague CIPs South Korea Bus shelters on Central Bus platform Jongro in Seoul France Digital screens in Monoprix s shop windows Germany Germany Portugal Luxembourg Berlin street furniture Berlin automatic public toilet Lisbon street furniture and large-format Veloh self-service electric bikes TRANSPORT China Chongqing airport (Terminal 3) TRANSPORT China The Netherlands China Hong Kong MTR (7 metro lines & Airport Express) Amsterdam trams Macau International airport Includes digital 14

15 PARIS: JCDECAUX ENTERS THE SMART DATA SELLING ERA WITH MONOPRIX Monoprix: 150 stores in Paris and Greater Paris 445 stores in France More than 800,000 clients per day Close to 3 million ticket sales every week Audience screens will cover more than 50% of the population locally 100 screens deployed since the end of June in Paris and Greater Paris 80% of the campaigns are booked with the use of VIOOH platforms for unlimited creative potential, driven by the data from Monoprix 85" Ultra HD digital screen in a Monoprix s shop window, Paris, France 15

16 VÉLO V IN LYON: 4,000 BIKES DEPLOYED IN 7 HOURS 4,000 new Vélo v deployed in 7 hours overnight from July 17 th to 18 th, 2018 in the framework of a 15-year street furniture advertising contract Without interruption of service +25% of bike rentals on July 18 th compared to the day before Vélo v key elements: New Vélo v service totally redesigned for an easier use, at the forefront of urban mobility New smartphone app for a new user experience 73,000 subscribers 6.5 rents on average per day per Vélo v Vélo v ready to be deployed, Lyon, France 16

17 SUCCESSFUL COMMERCIAL AND OPERATIONAL LAUNCH IN GUANGZHOU BAIYUN AIRPORT (TERMINAL 2) State-of-the-art experiential advertising area, Guangzhou Baiyun International airport (Terminal 2), China 17
18 AUSTRALIA: APN OUTDOOR ACQUISITION Acquisition by way of a scheme of arrangement To be approved by APN Outdoor shareholders Subject to Australian Competition and Consumer Commission clearance Brisbane Complementarity of our assets JCDecaux Street Furniture APN Outdoor Billboard Transport Perth Adelaide Melbourne Sydney Wellington Street Furniture Transport Billboard 18

19 VIOOH: MAKING A GREAT IMPRESSION Open, independent and global marketplace for Out-of-Home, combining data and technology to connect brands to the right audience, all with full transparency Separate and independent organisation Develop, deploy and support a Best-in-Class Global OOH Planning and Trading Platform Access incremental market for Digital and Online Revenues Increase OOH s market share and competitiveness 19
20 VIOOH BRINGS SOLUTIONS TO CURRENT DIGITAL ADVERTISING ISSUES MEASUREMENT TRANSPARENCY BRAND SAFETY VIEWABILITY BOT TRAFFIC FRAUD GDPR VIOOH: An industry opportunity VIOOH is not only a timely initiative for JCDecaux, it is a genuine industry opportunity for the OOH ecosystem to differentiate effectively in a digital world VIOOH is offering new solutions to current issues Out-of-Home is brand safe and measurable, connecting brands to real people in a GDPR compliant, transparent and now efficient way 20
21 VIOOH: INDEPENDENT GLOBAL OOH PLANNING AND TRADING PLATFORM VIOOH AUTOMATION SmartBRICS Enabling automated trading for Out-of-Home inventory and impressions Includes: # Inventory data (format, location) and audience data # Inventory availability, sales policy and pricing # Compliance reports VIOOH EXCHANGE SmartEXCHANGE Enabling programmatic trading connecting Demand Side Platforms (DSP) and media owners VIOOH CONTENT SmartCONTENT Enabling media buyers to schedule and manage content based on in-built rules Delivering proof of play and play out reports 21
22 FINANCIAL HIGHLIGHTS David Bourg Chief Financial & Administrative Officer
23 H RESULTS In million Euros, except %. Adjusted figures (1) except when IFRS. H H Revenue (2) 1, , % Operating margin % EBIT before impairment charge (3) % Net income Group share before impairment charge, IFRS (4) % Net income Group share, IFRS % Net cash flow from operating activities % Free cash flow % Net debt as of end of period, IFRS (1) Adjusted figures include our prorata share in companies under joint control accounted for using the equity method under IFRS 11. (2) The 2017 comparative figures are resta ted f rom the retrospec tive application of IFRS 15 Revenue f rom Contracts wi th Customers, applicable from January 1 st, The application of IFRS 15 leads to the change in presentation of invoices relating to adv ertising taxes. The impact on previously published H figures is million onadjusted revenue. There is no impact on operating margin. (3) The impact of the impairment charg e on EBIT in H corresponds to a - 0.8m impairment on intangible assets and PP&E and a 0.7m reversal on provisions for onerous contracts. Th e impact of the impairment cha rge on EBI T in H corresponds to a + 3.0m reversal on impairment on intangible assets and PP&E and a + 0.6m reversal on provisions for onerous contracts. (4) The impact of the impairment charge on Net income Group share in H corresponds to an impairment charge on intangible assets and PP&E and a reversal on provisions for onerous contracts (net of tax and net of the impact on minority interests) for - 0.1m. The impact of the impairment charge on Net income Group share in H corresponds to a reversal on impairment on intangible assets and PP&E and a reversal on provisions for onerous contracts (net of tax and net of the impact on minority interests) for + 2.1m. Please refer to the Appendices section for financial definitions. 23
24 ANALYSIS OF OPERATING MARGIN Overall YoY variation (in m) Adjusted figures H margins by segment (% of revenue) Adjusted figures 15.4% -140bp -70bp -40bp +10bp 13.0% (22.8) (11.6) (6.5) bp % -190bp -240bp 8.2% -100bp 4.7% 13.0% Street Furniture Transport Billboard Group 24
25 TFL IN LONDON: CONTRACT RAMP-UP EXAMPLE +62% +11% e e: Estimates 25
26 OPERATING MARGIN TO EBIT In million Euros, except %. Adjusted figures. H H Operating margin % Maintenance spare parts (16.9) (24.4) 7.5 Amortisation and provisions (net) (123.0) (123.0) 0.0 o Of which net depreciation of PP&E and intangible assets (134.4) (134.9) 0.5 o Of which impact of depreciation and reversal on provisions for onerous contracts related to PPA (4.1) o Of which net provision charge Other operating income and expenses EBIT before impairment charge % Net impairment charge, excluding goodwill (1) (0.1) 3.6 Goodwill impairment - - EBIT after impairment charge % (1) Including impairment charge on net assets of companies under joint control. Please refer to the Appendices section for financial definitions. 26
27 ANALYSIS OF EBIT Overall YoY variation (1) (in m) Adjusted figures H EBIT (1) by segment (% of revenue) Adjusted figures (40.6) (4.1) bp 8.4% -250bp 4.0% -140bp -200bp 5.0% Street Furniture -2.6% Transport Billboard Group (1) Before impairment charge 27
28 EBIT TO NET INCOME In million Euros, except % H H Adjusted EBIT after impairment charge % Restatement of EBIT from companies under joint control (41.1) (51.5) EBIT after impairment charge, IFRS % Financial income / (loss) (1) (11.3) (15.3) Tax (9.6) (18.1) Equity affiliates Minority interests (1) (1.8) (6.2) Net income Group share, IFRS % Net impact of impairment charge 0.1 (2.1) Net income Group share before impairment charge, IFRS % (1) Excluding discounting and revaluation of debt on commitments to purchase minority interests (- 0.3m in H and - 1.1m in H1 2017). Please refer to the Appendices section for financial definitions. 28
29 CASH FLOW STATEMENT In million Euros H H Adjusted funds from operations net of maintenance costs Adjusted change in working capital requirement (37.5) (14.3) (23.2) Adjusted net cash flow from operating activities Adjusted capital expenditure (94.2) (93.2) (1.0) Adjusted free cash flow Restatement from companies under joint control (35.1) (31.5) Free cash flow, IFRS 8.1 (1.4) Dividends (131.7) (129.3) Equity increase (net) 2.2 (1.6) Financial investments (net) (1) 3.5 (5.3) Others (2) Change in Net debt (Balance Sheet), IFRS Net debt as of end of period, IFRS (1) Excluding net cash of acquired and sold companies. (2) Non cash variations (mainly due to consolidation scope variations, translation differences on net debt, the impact of IFRS 9 and finance lease and reclassifications), variation of interests on debt and including net cash of acquired and sold companies. Please refer to th e Appendic es section for financial definitions. 29
30 BREAKDOWN OF CAPEX In million. Adjusted figures % % 6.4% % % 7.2% 7.1% % % 5.7% H H General investments Renewal capex Growth capex Capex as a % of revenue 30
31 H FINANCIAL HIGHLIGHTS # Reported growth impacted by the forex effect but good organic growth with a sequential acceleration over the first half of the year # Margins affected by the situation in Paris, the simultaneous ramp-up of new significant contracts at Group level and our investments in programmatic and data # An investment policy focused on strengthening our positions in major cities and airports around the world and on the digital transformation of our medium # Strong free cash flow and strong balance sheet will allow us to pursue further external growth opportunities 31
32 GROWTH STRATEGY AND OUTLOOK Jean-François Decaux Co-CEO

33 STRONG OUTDOOR GROWTH DRIVERS Outdoor advertising: growing audiences Urbanisation accelerates. By 2050, the urban population will represent: North America: 89% Latin America: 88% Europe: 84% Asia: 66% Africa: 59% Air traffic will double in the next 15 years Sources: World Health Organization, Airbus Tokyo, Japan 33
34 URBANISATION DRIVES GROWTH By 2050, the global urban population will have increased by 60% 8 Population in billion 7 6 Urban population and megacities Amongst today s 33 megacities (1), 19 are located in Asia and 5 in Latam 10 additional megacities will be created by 2030 (1) 10 million inhabitants or more Sources: United Nations, World Population Prospects, JCDecaux estimates x % World urban population Megacities
35 PRESENCE IN 16 OF THE 20 CITIES WHERE CONSUMPTION WILL BE THE STRONGEST FROM 2015 TO 2030 Top cities by consumption growth between 2015 and 2030 (in $ billion) JCDecaux's presence Sources: McKinsey Global Institute 35

36 AIRPORTS: 6 TH CONTINENT WITH 4.3 BILLION EYEBALLS Total air passenger traffic is expected to grow at +4.4% CAGR over the next 15 years Operating 218 airports in 38 countries and covering 28% of global air traffic 60% air traffic coverage among the Top 15 airports worldwide Heathrow International airport, London, United Kingdom 36


, China Changi ,")
37 UNIQUE WORLDWIDE AIRPORT PLATFORM Los Angeles International airport, United States Roissy-Charles de Gaulle International airport, Paris, France Guangzhou Baiyun International airport (Terminal 2), China Changi International airport, Singapore 37
38 OOH AD SPEND IS EXPECTED TO INCREASE 33% 31% UK EXAMPLE: TIME SPENT VS. MEDIA SPENT 25% 25% 25% Time spent 17% 18% Media spent 10% 6% 5% 3% 3% Internet Mobile Television OOH Radio Print Sources: UK data, Touchpoints 8 Total Time spend per day, WARC Revenue by Media 38
39 DOOH: SECOND FASTEST GROWING MEDIUM Ad spend growth by medium (CAGR) 21.5% 12.5% 4.1% 2.6% 1.3% 1.1% -4.5%% -5.3%% -6.4% Sources: ZenithOptimedia June 2018, Allied Market Research, JCDecaux estimates 39
40 PROGRAMMATIC ADVERTISING IS TRANSFORMING THE MEDIA LANDSCAPE Over PROGRAMMATIC ADOPTION (%) +4.1% CAGR for Global Ad Spend +10.3% CAGR for Digital advertising +12.5% CAGR for DOOH +11.0% CAGR for Programmatic buying Non- Programmatic Programmatic Non- Programmatic Programmatic 33% Mobile Internet + OOH are a powerful combination 51% % 2020 Consumers exposed to Mobile advertising + OOH are showing 3 times to 5 times uplift in Drive-to-Store vs. unexposed consumers 67% Sources: MAGNA Global Forecast, ZenithOptimedia June 2018, JCDecaux estimates 40
41 MAIN TENDERS EXPECTED IN Europe Street Furniture Berlin bus shelters Paris CIPs Paris Columns and Flagpoles Bilbao North America San Francisco Asia-Pacific Sydney Vietnam Indonesia India Japan Rest of the World St. Petersburg Belo Horizonte bus shelters and clocks Campinas Europe Budapest metro Network Rail AENA airports Asia-Pacific Transport Metros in Chinese cities Terminals in Chinese airports India Rest of the World Abu Dhabi airport South African airports Billboard Rest of the World St. Petersburg On-going tenders 41
42 STRONGEST BALANCE SHEET IN THE INDUSTRY JCDecaux Ströer Lamar OUTFRONT Media CCO / iheartmedia Net debt / EBITDA, IFRS (1) 0.6x 1.4x 3.6x 5.0x 9.4x / 12.7x Gross debt $1.7bn $658m $2.6bn $2.3bn $5.3bn / $20.6bn Maturity date / Credit Rating (S&P) BBB n.a. BB- BB- CCC+ / CCC+ Credit Rating (Moody s) Baa2 n.a. Ba3 Ba3 n.a. / Caa2 0.6x 1.4x 3.6x 5.0x 9.4x Source: Company news releases. Currency conversions are based on an exchange rate $/ of (closing rate) as of December 31 st, 2017 for JCDecaux and Ströer. (1) For consistency purposes, maintenance spare parts have been reclassified in the Operating margin for JCDecaux x
43 CONSOLIDATION TO ACCELERATE 3,922 (1) 2017 Out-of-Home revenue ($m) International operations excluding North America 3,587 2,562 1,335 1,540 Equity method 30% North America operations 335 1,256 1,780 1, , JCDecaux CCO Focus Media Lamar Ströer (3) OUTFRONT Media Exterion Media (2) APG SGA ooh!media (4) APN Outdoor (5) Metrobus Intersection (2) Clear Media Asiaray Adshel (4) Russ Outdoor Sources: Company news releases. Currency conversions are based on an annual average exchange rate $/ of , CHF/ of , HKD/ of , RMB/ of , AUD/ of and RUB/ of (1) Does not include revenue from APG SGA and Metrobus, companies integrated through the equity method injcdecaux s financial statements. (2) JCDecaux s estimate of 2017 revenue. (3) Ströer s revenue are split into Ströer Digital ($802m) and Ströer Germany and International ($738m). (4) On June 25 th, 2018, ooh!media announced entering into a binding agreement to acquire 100% of the share capital in Adshel from HT&E Limited. Completion of the acquisition is expected in 2018 and is subject to ACCC approval. (5) On June 26 th, 2018, JCDecaux announced it has entered into an agreement with APN Outdoor to acquire 100% of APN Outdoor s share capital by way of a scheme of arrangement to be approved by APN Outdoor shareholders and subject to Australian Competition and Consumer Commission clearance. 43
44 CONCLUSION H financial performance Reported growth impacted by the forex effect but good organic growth with a sequential acceleration over the first half of th e year Margins affected by the situation in Paris, the simultaneous ramp-up of new significant contracts at Group level and our investments in programmatic and data An investment policy focused on strengthening our positions in major cities and airports around the world and on the digital transformation of our medium Strong free cash flow and strong balance sheet will allow us to pursue further external growth opportunities Investments for future growth Pursue the Street Furniture s digitisation in premium locations On-going organic growth Further consolidation opportunities Automated trading platform roll-out A worldwide leadership position Well-diversified geographical exposure to benefit from mature and faster-growth markets Acceleration of digital transformation in our 3 business segments On-going focus on innovation 44
45 Q OUTLOOK As far as Q is concerned, we expect our adjusted organic revenue growth rate to further accelerate at around +7%. 45
46 APPENDICES
47 IMPLEMENTATION OF IFRS 11 Under IFRS 11, applicable from January 1 st, 2014, companies under joint control previously consolidated using the proportionate method are accounted for using the equity method. However, operating data of the companies under joint control will continue to be proportionately integrated in the operating management Group reports on which operating management relies in their decision making. Indeed, operating management considers this information to measure the operating performance and to inform their decision making. Consequently, the operating data presented in this document is adjusted to reflect the contribution of companies under joint control. As regards the Profit & Loss, it concerns all aggregates down to the EBIT. As regards the cash flow statement, it concerns all aggregates down to the free cash flow. We systematically present the reconciliations between the IFRS data and the adjusted data, in compliance with the AMF s instructions. Reconciliations are provided in the Appendices section. 47
48 RECONCILIATION BETWEEN ADJUSTED FIGURES AND IFRS FIGURES PROFIT & LOSS H H In million Euros Adjusted Impact of companies under joint control IFRS Adjusted Impact of companies under joint control IFRS Revenue (1) 1,643.3 (195.5) 1, ,651.4 (200.6) 1,450.8 Net operating costs (1) (1,428.9) (1,285.4) (1,396.4) (1,254.8) Operating margin (52.0) (59.0) Maintenance spare parts (16.9) 0.7 (16.2) (24.4) 0.7 (23.7) Amortisation and provisions (net) (123.0) 9.7 (113.3) (123.0) 6.6 (116.4) Other operating income / expenses EBIT before impairment charge 82.8 (41.1) (51.5) 63.6 Net impairment charge (2) (0.1) - (0.1) EBIT after impairment charge 82.7 (41.1) (51.5) 67.2 (1) The 2017 comparative figures are restated from th e retrospective application of IFRS 15 Revenue from Contracts with Customers, applicable from January 1 st, The application of IFR S 15 leads to the change in presentation of invoices relating to advertising taxes. The impact on previously published H figures is million on adjusted revenue. There is no impact on operating margin. (2) Including impairment charge on net assets of companies under joint control. 48
49 RECONCILIATION BETWEEN ADJUSTED FIGURES AND IFRS FIGURES CASH FLOW STATEMENT H H In million Euros Adjusted Impact of companies under joint control IFRS Adjusted Impact of companies under joint control IFRS Funds from operations net of maintenance costs (18.7) Change in working capital requirement (37.5) (20.8) (58.3) (14.3) (58.6) (72.9) Net cash flow from operating activities (39.5) (37.9) 85.4 Capital expenditure (94.2) 4.4 (89.8) (93.2) 6.4 (86.8) Free cash flow 43.2 (35.1) (31.5) (1.4) 49
50 RECONCILIATION OF ORGANIC GROWTH (1/2) In million Euros Q1 Q2 H adjusted revenue (a) , IFRS revenue (b) ,447.8 IFRS 11 impacts (c) adjusted revenue (d) = (b) + (c) ,643.3 Currency impacts (e) adjusted revenue at 2017 exchange rates (f) = (d) + (e) ,717.6 Change in scope (g) (0.3) (0.5) (0.8) 2018 adjusted organic revenue (h) = (f) + (g) ,716.8 Organic growth (i) = (h) / (a) +2.8% +4.9% +4.0% 50
51 RECONCILIATION OF ORGANIC GROWTH (2/2) In million Euros Impact of currency in H Average exchange rate H H USD 14.8 HKD 11.8 BRL 7.6 RMB 7.3 GBP 3.9 Other 28.9 Total 74.3 USD HKD BRL RMB GBP
52 FINANCIAL DEFINITIONS Organic growth The Group s organic growth corresponds to the adjusted revenue growth excluding foreign exchange impact and perimeter effect. The reference fiscal year remains unchanged regarding the reported figures, and the organic growth is calculated by converting the revenue of the current fiscal year at the average exchange rates of the previous year and taking into account the perimeter variations prorata temporis, but including revenue variations from the gains of new contracts and the losses of contracts previously held in our portfolio Operating margin Revenue less Direct Operating Expenses (excluding Maintenance spare parts) less SG&A expenses EBIT (Earnings Before Interests and Taxes) Operating Margin less Depreciation, amortisation and provisions (net) less Impairment of goodwill less Maintenance spare parts less Other operating income and expenses Free cash flow Net cash flow from operating activities less capital investments (property, plant and equipment and intangible assets) net of disposals Net debt Debt net of managed cash less bank overdrafts, excluding the non-cash IAS 32 impact (debt on commitments to purchase non-controlling interests), including the non-cash IFRS 9 impact on both debt and hedging financial derivatives 52
53 FORWARD LOOKING STATEMENTS This presentation may contain some forward-looking statements. These statements are not undertakings as to the future performance of the Company. Although the Company considers that such statements are based on reasonable expectations and assumptions on the date of publication of this presentation, they are by their nature subject to risks and uncertainties which could cause actual performance to differ from those indicated or implied in such statements. These risks and uncertainties include without limitation the risk factors that are described in the Registration Document registered in France with the French Autorité des Marchés Financiers. Investors and holders of shares of the Company may obtain copy of such Registration Document by contacting the French Autorité des Marchés Financiers on its website or directly on the Company website The Company does not have the obligation and undertakes no obligation to update orrevise any of the forward-looking statements. 53

54