REPORT CARD. Reporting on data July 2015 to June wettropicswaterways.org.au
|
|
|
- Jonas Moore
- 5 years ago
- Views:
Transcription

1 REPORT CARD Reporting on data July 2015 to June wettropicswaterways.org.au

.")


2 Marine Debris Community groups cleared 2.62 tonnes of marine debris from Wet Tropics beach clean ups during The majority of the 35,067 items picked up were plastics, which pose a threat to marine wildlife. *AMDI Banana Industry The banana industry is working to improve on-farm practices to reduce runoff. By mid-2016, 46 growers completed training in Best Management Practice, covering 6,748 hectares (55% of production land). This figure is expected to grow significantly. The Department of Agriculture and eries assess 37 Wet Tropics marine fish, crabs and a lobster species to determine sustainability of the stocks. Commercial fishers, recreational anglers and seafood processors all contribute valuable data to these assessments. No Wet Tropics stocks are currently classified as overfished. Urban Sugar Cane Industry The cane industry is shifting towards improved practices to reduce runoff. By June 2016, 550 farming businesses were benchmarked in the SmartCane Best Practice program, representing 63% of cane production land. Investment in extension support is expected to increase this figure. Regional councils are trialling steam technology to replace the use of herbicides to manage weeds along roadsides and beaches.


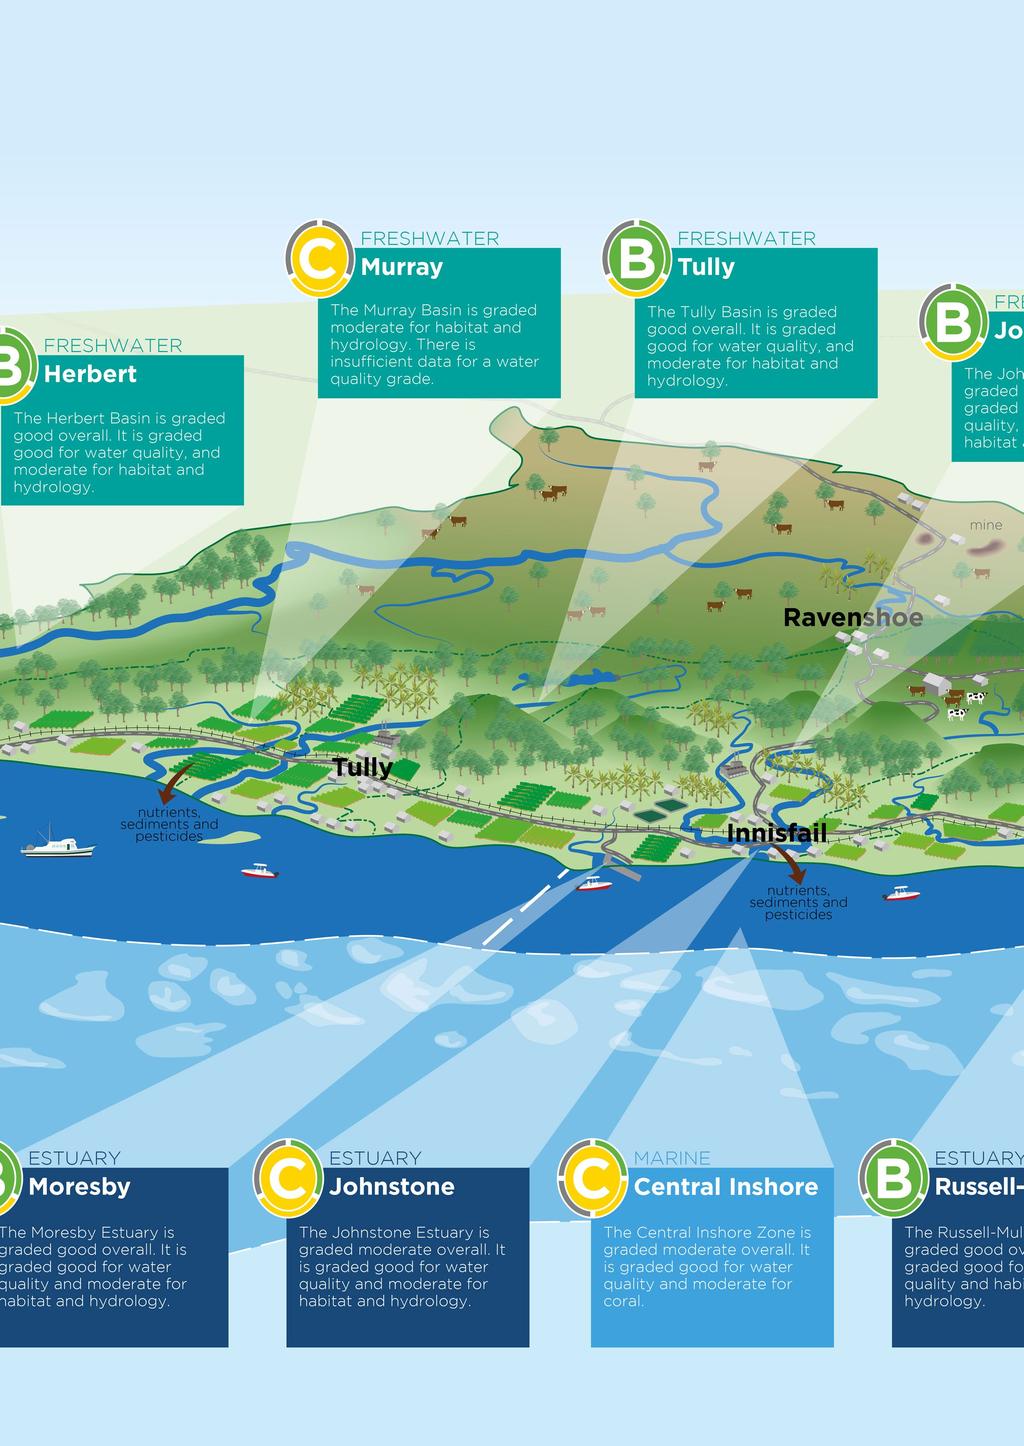
3 Measuring Progress The Wet Tropics Report Card tracks changes in the condition of our waterways. It allows us to measure the progress being made by the many innovative caretakers in our region who are working hard to ensure the future health of our waterways. barriers It also enables us to determine how and where to focus our efforts as a community to improve waterway health. New research undertaken by the Partnership shows that the movement of fish between freshwater and estuaries is less impacted by barriers than other regions. Most basins were graded good or very good. For the majority of Wet Tropics waterways are graded as good or moderate. These results reflect a continuation of low rainfall conditions. We are tracking these results over time. Go to to track trends Invasive Weeds Discharge during 2015/16 Long-term average annual discharge rt y H er be ra lly ur M e on st hn Jo Tu ll e se us av gr ul M R ro n an ar B sm os ai nt re e 0 M Climatic conditions were similar to the previous reporting period with continuing below average rainfall in most basins. Lower rainfall years can result in reduced sediment, pesticide and nutrient runoff. Discharges from major rivers continued to be below long-term averages. River flows (GL) D Climate These monitored rivers do not align with reported estuaries Coral The results for coral show improvement in the reporting period. However, offshore reefs were surveyed before the effects of the coral bleaching in early 2016 were fully evident. Tree Planting Over 200,000 trees were planted by community groups and councils throughout the region, including riparian zones. These help stabilise streambanks and reduce sediment and nutrient loads entering waterways. Invasive weeds cause major impacts on waterway health. The Murray and Herbert basins were identified as experiencing the greatest impact (very poor). The basins experiencing least impact were the Tully (very good) and Mulgrave (good).

4 Waterway grades The science behind the grades These waterway grades were developed by analysing and integrating scientific monitoring data contributed by many organisations. This process was overseen by an independent panel of scientists. Timing This Report Card, although released in 2017, presents data from July 2015-June The time delay is due to the time required for quality control, scientific analysis and expert review. Extra monitoring Last year s Wet Tropics Pilot Report Card identified a number of monitoring gaps, some of which have since been addressed by the Partnership to present a more complete picture of waterway health. For the reporting period an additional four estuaries have been monitored for water quality, and both the Cairns Regional Council and Cassowary Coast Regional Council expanded their estuary monitoring to include additional indicators selected for the Wet Tropics Report Card. Changed methodology Since the release of the Pilot Report Card last year, the Partnership has applied improvements to the methodology used to generate estuary and freshwater basin scores, and the offshore coral index. The revised methodology has been applied to both the and results. More detailed information about the grades and the methods used to generate them can be found on the website. wettropicswaterways.org.au
5

6 Regional drivers


7 Legend A very good B good C moderate D poor E very poor insufficent data Freshwater indicators Estuary indicators Inshore Marine indicators Offshore Marine indicators score Water quality score Water quality score Water quality score Water quality Habitat and hydrology Habitat and hydrology Seagrass Coral Coral


8 The Wet Tropics Healthy Waterways Partnership The Wet Tropics Report Card has been developed by the Wet Tropics Healthy Waterways Partnership as an initiative of the Reef 2050 Long-Term Sustainability Plan. Our aim is to conserve the natural values of our region and improve the condition of our freshwater and estuary waterways that flow to the Great Barrier Reef. The Partnership brings together community, industry, researchers, businesses and all levels of government. Partnering for healthy tropical waterways and vibrant communities wettropicswaterways.org.au Acknowledgement of Country The Wet Tropics Healthy Waterways Partnership respectfully acknowledges the Traditional Custodians and First People of the land and water on which we work and live. on Newt Brad / s e g a Wet Tropics Im Thanks to our partners CAREFISH ** CAirns REcreational ing Industries StakeHolders Wet Tropics Sugar Industry Partnership **CANEGROWERS Cairns, CANEGROWERS Herbert River, CANEGROWERS Innisfail, CANEGROWERS Mossman, CANEGROWERS Tablelands, CANEGROWERS Tully Acknowledgements The Wet Tropics Healthy Waterways Partnership would like to acknowledge the following organisations for their contribution to the Wet Tropics Report Card: Australian Institute of Marine Sciences; Australian Marine Debris Initiative; Department of Science, Information, Technology & Innovation; James Cook University; CSIRO; Tourism Tropical North Queensland; Department of Natural Resources & Mines; Department of Agriculture & eries; Mackay Whitsunday Healthy Rivers to Reef Partnership. Design and layout Contact information Kate Hodge, Hodge Environmental Suzanne Jenkins Executive Officer Wet Tropics Healthy Waterways Partnership E: info@wettropicswaterways.org.au P: Photo credits Terrain NRM, Cairns Marine, Carefish, Tangaroa Blue, Wet Tropics Management Authority Released 5 December, 2017