Grouping Strategies for Feeding Lactating Dairy Cattle. V.E. Cabrera University of Wisconsin-Madison Dairy Science
|
|
|
- Grant O’Brien’
- 5 years ago
- Views:
Transcription


1 Grouping Strategies for Feeding Lactating Dairy Cattle V.E. Cabrera University of Wisconsin-Madison Dairy Science Farm Business and Produc0on Management instructors at the WAAE summer conference, Green Bay, WI, 26 June 2013

2 What seems to be the problem? Dairy farmers might be over-feeding lactating cows Same ration in a group No feeding groups or only a few groups Preferred higher rations Low producing animals receive more nutrients than required


3 What could be a possible solution? Consider additional feeding groups for lactating cows Less nutrient excretion Decreased environmental concerns Improved nutrient use efficiency Diet closer to cow requirements Less overfed animals Decreased overweighted cows Lower feeding costs Higher milk income over feed cost


4 Cost Why dairy farmers do not group more? There could be a myriad of reasons! Not enough expertise or knowledge available Management constraints Time Scope Other reasons Trying to find them Farm facilities or equipment limitations Physical constraints Not enough labor or personnel Labor constraints


5 Strategies for grouping lactating cows Depend on farm and herd characteristics Individual cow nutrient requirements Energy Protein Farm characteristics Capacity to handle lactating feeding groups Number of lactating cows on the herd Adapted from McGilliard et al., 1983; St-Pierre and Thraen, 1999
 = NEmaintenance +")

6 Cow nutrient requirement Energy Total net energy (NEtotal) Energy required for maintenance + energy required for milk production NEtotal (Mcal) = NEmaintenance + NEmilk NEmaintenance Function of animal body weight NEmaintenance = x BW 0.75 NEmilk Function of milk and fat production NEmilk = Milk x ( x Fat%) NRC, 2001
 McGilliard et al.")
7 Cow nutrient requirement Protein Total crude protein (CPtotal) Protein required for maintenance + protein required for milk production CPtotal (g) = CPmaintenance + CPmilk CPmaintenance Function of animal body weight CPmaintenance = x BW x BW 2 CPmilk Function of milk and fat production CPmilk = Milk x ( x Fat%) McGilliard et al., 1983
 = (0.372 x 4% FCM + 0.0968 x BW 0.75 ) x (1 - e (-0.192 x ((DIM/7) + 3.67) ) 4% FCM = 0.")
8 Cow feed requirement Dry matter intake Total dry matter intake (DMI) Function of DIM, BW, and 4% fat corrected milk (4% FCM) DMI (kg) = (0.372 x 4% FCM x BW 0.75 ) x (1 - e ( x ((DIM/7) ) ) 4% FCM = 0.4 x Milk + 15 x (Fat%/100) x Milk NRC, 2001
 Lactation > 1 (1,320 lb) 200 400 600 800 Days after calving Korver et al.")
9 Cow body weight Measurements are not always available 1,400 Estimation based on Lactation DIM Cohorts average BW Body weight, lb 1,300 1,200 1,100 Lactation 1 (1,100 lb) Lactation > 1 (1,320 lb) Days after calving Korver et al., 1985 function fitted to NRC, 2001
 = 83 rd Percentile (NEgroup_cows) CPgroup (%) = 83 rd Percentile (CPgroup_cows) Stallings and McGilliard,")
10 Nutrient requirement for a group of cows Energy and protein Lead factor Multiplicative factor to adjust nutrient requirements of a group NEgroup (Mcal) = 83 rd Percentile (NEgroup_cows) CPgroup (%) = 83 rd Percentile (CPgroup_cows) Stallings and McGilliard, 1984

11 Number of groups for lactating cows Optimal maximum number of feeding groups Farm characteristics Facilities Equipment Management Labor Previous findings Published reports Empirical analyses Number of groups 1, 2, 3, or 4 groups McGilliard et al., 1983; St-Pierre and Thraen, 1999

12 Criteria for grouping Several criteria exist Days after calving (DIM) Based on stage of lactation Dairy merit Function of both FCM and BW Cluster Function of NE and CP. Seems to be most efficient criterion. Fat corrected milk Based on level of production measured as FCM CP NE McGilliard et al., 1983; St-Pierre and Thraen, 1999
 Corn %CP + Corn Mcal NE = $/kg Corn Price SBM %CP + SBM Mcal NE = $/kg SBM Price Value of NE and CP could be available on a farm Based on farm")
13 Calculate the value of NE and CP Determine diets cost Value of NE and CP could be deducted Using referee feeds Price NE and CP Nutrient values NE ($/Mcal) and CP ($/kg) Corn %CP + Corn Mcal NE = $/kg Corn Price SBM %CP + SBM Mcal NE = $/kg SBM Price Value of NE and CP could be available on a farm Based on farm experience
 IOFCgroup = Milk Value - Feed Cost Milk Value = SUM (Milkcow) x Milk Price Feed Cost = SUM (DMcow) x 83% CP x CP price + SUM (DMcow) x 83% NEl x NEl")
14 Optimize cows belonging to a feeding group Maximize the income over feed cost Non-linear optimization Iterative process Search for global maxima IOFC Max(IOFC) = SUM(IOFCgroup) IOFCgroup = Milk Value - Feed Cost Milk Value = SUM (Milkcow) x Milk Price Feed Cost = SUM (DMcow) x 83% CP x CP price + SUM (DMcow) x 83% NEl x NEl price

15 Additional costs and benefits Impacts grouping feeding strategies Management cost Additional labor Extra management Milk depression Cow social interactions Diet changes Avoid costs Additives savings
 - Extra management - Milk depression + Savings")
16 Overall net return Bottom line grouping strategies Net return + Max (IOFC) - Extra management - Milk depression + Savings VS


17 Decision support system Perform your own calculations Group feeding strategies are farm specific Every farm is different Herd demographics changes dynamically Re-grouping is permanent Market conditions change permanently Might impact decisions User-friendly application Easy to use, still robust


18 Grouping strategies For feeding lactating dairy cattle


19 Feeding grouping strategies Where to find it DairyMGT.info Tools

20 Grouping strategies Farm possibilities Currently grouping? no yes How many groups farm can do? How many groups farm does? Current diet formulation Size of possible groups How many groups farm can do? Additional costs and benefits Current diet formulation Size of possible groups Additional costs and benefits
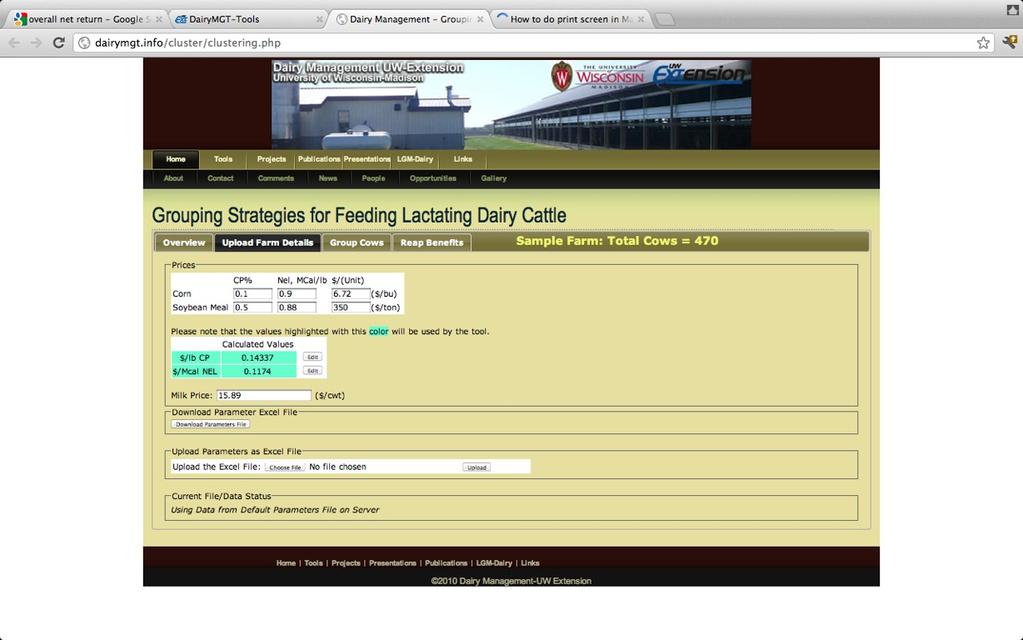
21 Decision support system illustration Economic impact of grouping Current situation Lactating cows 470 Number groups None NE, Mcal/lb 0.80 CP, % 17% Possible situation Number groups 3 Group sizes 100, 100, 270 Added cost, $ $1,000/month Milk loss 5 lb/cow Milk loss time 4 days Saved cost, $ $0

22 Decision support system illustration Cluster grouping criteria Possible situation Cow numbers NE, Mcal/lb CP, % IOFC, $/cow/day Group Group Group ,189 No grouping 3 clusters 1,336 1,100 1,175 1,250 1,325 1,400 Herd net return, $/herd per year (x1,000)

23 Analysis from dairy farm records 30 Wisconsin dairy farms No grouping vs. 3 groups Same size groups Same prices for all $15.89/cwt milk $ /lb CP $0.1174/Mcal NEl Projected body weight 1,100 lb primiparous 1,300 lb multiparous Cluster grouping 83 rd percentile CP and NEl
24 Analysis from dairy farm records 30 Wisconsin dairy farms Number of lactating cows (n=30) Income over Feed Cost (no grouping) $/cow per year Income over Feed Cost (3 groups) Mean 788 $2,311 $2,707 Minimum < 200 $697 $1,059 Maximum > 1,000 $2,967 $3,285 Increase of IOFC ($/cow per year) Between 7 and 52% Mean = $396 Range = $161 to $580 After reasonable extra costs Still increased net margin of between 5 and 47%

25 Acknowledgement Project support This project is supported by Agriculture and Food Research Initiative Competitive Grant No from the USDA National Institute of Food and Agriculture


26 Thanks 2011 Wisconsin Milk Marketing Board, Inc.