With High Fertilizer Prices. Gerald Bryan Extension Agronomist UM Extension Jackson, MO
|
|
|
- Coral Bradley
- 5 years ago
- Views:
Transcription
1 With High Fertilizer Prices Gerald Bryan Extension Agronomist UM Extension Jackson, MO

2 Good fertility = Good Pastures = Good Crops Know where you are..soil Test
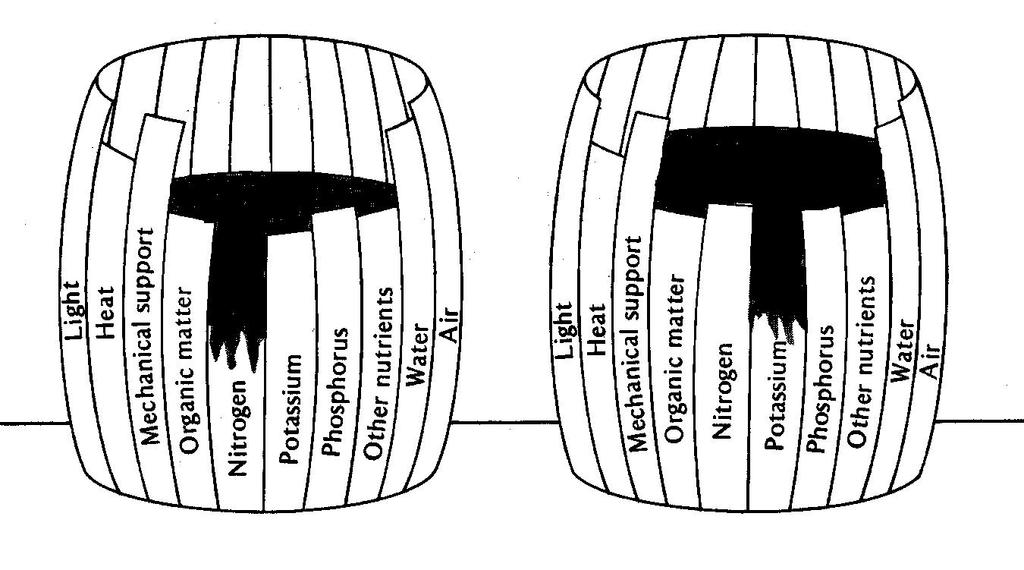
3 What Nutrients Do Plants Require? Macro nutrients N, P, K, Ca, Mg, S Needed in greatest quantities N, P, K likely to show economic responses Micro nutrients B, Fe, Cu, I, Mn,, Mo, Zn, Cl,, Na, Co, Si Unlikely to show economic responses unless severely deficient Soil ph not a nutrient, but regulates the availability of nutrients to plants Air and Water,


4 Determine nutrients in Soil Yield - Replace the nutrients removed Soil Capability and Nutrient Buildup Crop and System- No till or irrigated Hay or Grazing System/ manure recycling
5 Why Soil Test Meet plant needs Optimize production Use fertilizer $$$$ effectively Reduce potential pollution to water Reduce fertility effects on livestock and crops Improve quality of forage and crops Maintain and improve soil fertility
6 Each test should represent 20 acres or less Avoid sampling near limestone roads, feeding areas, water tanks, loafing areas, ditches, fresh manure piles, etc. Take 15 to 20 cores at random locations in the paddock. A zig-zag or M pattern works well. Take cores to a 6 inch depth or hit rock
7 University Extension University of Missouri-Columbia Soil Test Report Soil Testing Laboratory 23 Mumford Hall, MU Columbia, MO Phone: (573) or Soil Testing Laboratory P.O. Box 160 Portageville, MO Phone: (573) Serial no. S Lab no. D FIELD INFORMATION County Iron Region 7 Field ID ADAMS FIELD Sample no 1 Submitted Processed Acres 35 Last Limed >5 yrs Irrigated No 3/19/2008 4/4/2008 Last crop 18 COOL SEASON GRASS HAY FSA Copy N Soil sample submitted by: Firm Number: Outlet: This report is for: DARRELL MILLER RT 1, BOX 165 ANNAPOLIS MO SOIL TEST INFORMATION RATING Very Low Low Medium High Very High Excess ph s (salt ph) 6.7 ********************************** Phosphorus (P) 7 lbs/a ****** Potassium (K) 174 lbs/a **************************** Calcium (Ca) 2647 lbs/a *********************************** Magnesium (Mg) 700 lbs/a ************************************ Sulfur (SO 4-S) ppm Zinc (Zn) ppm Manganese (Mn) ppm Iron (Fe) ppm Copper (Cu) ppm Organic matter 3.0 % Neutralizable acidity 0.5 meq/100g Cation Exch. Capacity 10.3 meq/100g PH in water Electrical Conductivity Mmho/cm Sodium (Na) lbs/a Nitrate (NO 3-N) Topsoil ppm Subsoil ppm Sampling Depth Top Inches Subsoil Inches NUTRIENT REQUIREMENTS LIMESTONE SUGGESTIONS Pounds per acre Cropping options Yield goal N P 2O 5 K 2O Zn S 3 CLOVER/CLOV-GRASS EST Effective Neutralizing 0 6 OVERSEEDING LEGUMES Material (ENM) 16 CLOVER/CL-GRASS HAY 2 T/A Effective magnesium 0 16 CLOVER/CL-GRASS HAY 3 T/A (EMg) Comments ---No nitrogen fertilizer is recommended when establishing legumes because it promotes grass and weed competition. ---Some herbicide labels list restrictions based on soil ph in water. This sample has an estimated ph in water of 7.2. Use this estimated ph in water as a guide. If you wish to have soil ph in water analyzed, contact your dealer or Extension specialist listed below.

8 Soil Test Report
9 (A) Field information This section contains information provided by you to identify the field and summarize previous management. This information includes, for example, the field name or number, field size and previous crop.
10 B) Soil test information This provides the results of the soil tests performed on your sample. The regular soil tests include the soil salt ph; available phosphorus, potassium, calcium and magnesium; organic matter; neutralizable acidity; and cation exchange capacity. Tests for other nutrients can be obtained at additional charge. The basic set of tests provides the necessary data to develop nitrogen, phosphate, potash, and ag lime recommendations for your intended cropping plan.
11 C) Rating This section provides a rating for the salt ph and nutrients tested. The rating system helps you interpret the soil test information in Section B. The soil test rating indicates the relative level of each nutrient tested and provides information on the probability that application of a particular fertilizer will increase crop yield. Use Table 1 to determine the probability of a yield increase from fertilizer applications for your soil test rating.
12 Table 1 Your probability of yield increase from fertilizer drops as your soil test ratings in Section C rise. Rating Very low Low Medium High Very high Excess Probability of response to fertilizer ***** very high *********** high ******************* medium ************************** low ************************************* none ********************************************** none
13 (D) Nutrient requirements This section contains three parts: cropping options, yield goal, and fertilizer recommendations


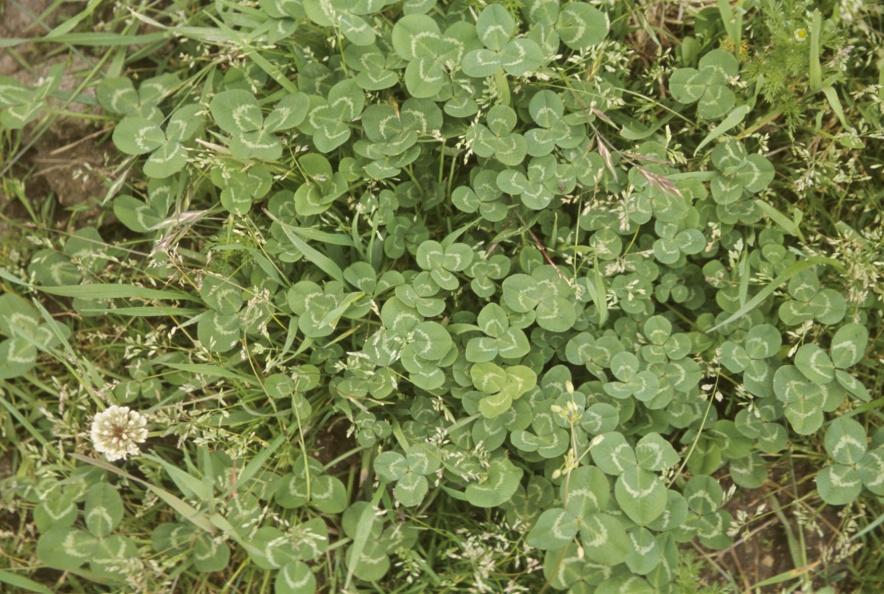
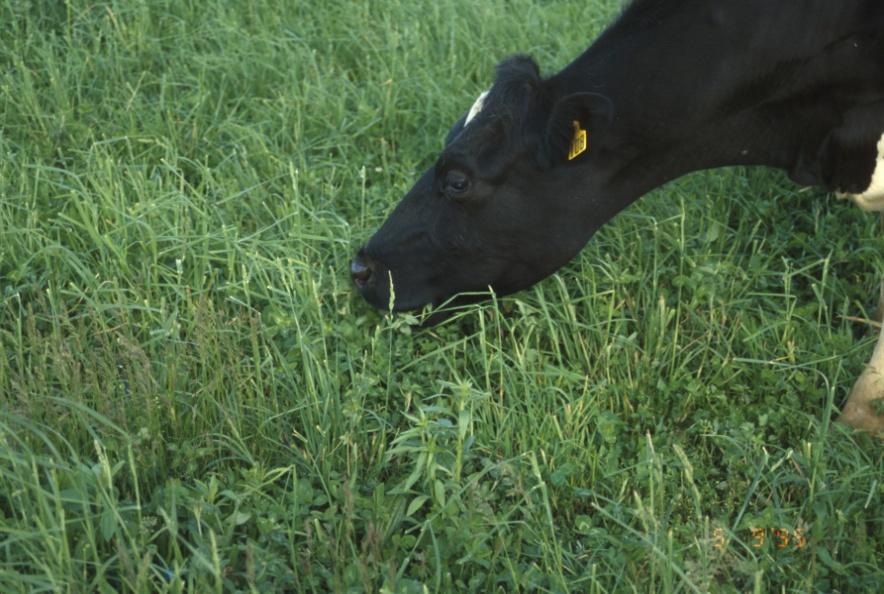
14 Fescue Cattle Warm Season Grass Clovers
15 (E) Cropping options This section lists cropping plans or crops for requested fertilizer recommendations. You can request recommendations for up to four different cropping scenarios. Additional scenarios can be done at your local MU Extension center if you change plans after you receive your lab report.
16 (F) Yield goal The yield goal section shows the level of production you selected for the crops listed in Section E, "Cropping Options. Common yield goal ranges for Missouri crops are given in the appendix table in this publication. The yield goal you choose should be based on soil type, yield history, fertility level, irrigated versus nonirrigated land, and economic considerations.
17 (G) Pounds per acre Fertilizer recommendations for the crops and yield goals listed. The recommendations are reported as pounds of N (nitrogen), P 2 O 5 (phosphate), and K 2 O (potash) per acre. The fertilizer recommendation is designed to provide a recommendation of the nutrients needed to: meet yield goal in Section F improve soil fertility over time. Following soil test recommendations will build or maintain soil test phosphorus and potassium to the high rating category if the recommended fertilizer rate is applied annually for eight years. Micronutrient recommendations, for example zinc and sulfur, should be applied once and the soil resampled in three to five years to determine the need for additional applications.
18 (H) Limestone suggestions This section gives the suggested amount of limestone to raise soil salt ph to an optimal level for the cropping options listed. Desired soil salt ph ranges for Missouri crops are given in Table 2.
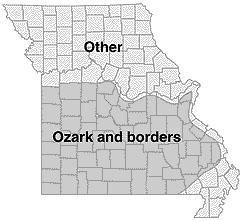
19 Crop Soil region Ozark and borders Other Alfalfa and alfalfa grass establishment 6.6 to to 6.5 Birdsfoot trefoil and birdsfoot trefoil grass establishment 6.1 to to 6.0 Clover and clover grass establishment 6.1 to to 6.0 Cool season grass establishment and production 5.6 to to 6.0 Lespedeza and lespedeza grass establishment 6.1 to to 6.0 Overseeding legumes 6.1 to to 6.0 Warm season grass establishment and production 5.6 to to 6.0 Sudan grass and sudan/sorghum crosses 5.6 to to 6.0 All row crops 6.1 to to 6.5
20
21 (H) Limestone suggestions The limestone recommendation is given for the cropping option requiring the highest salt ph range. For example, if a cool season grass and alfalfa were both listed in Section E, the limestone recommendation would be for alfalfa since it requires a higher soil salt ph level. The recommendation is reported as pounds of ENM (effective neutralizing material) per acre.
22 (H) Limestone suggestions To determine the amount of lime needed in tons per acre, divide the ENM value by the ENM guaranteed by your ag lime dealer. If the soil test ENM requirement is 1,395 pounds per acre and lime quarry guarantees 400 pounds ENM per ton of limestone, then you need 3.48 tons of limestone per acre (1, = 3.48).
23 (I) Special notes (II) Many times notes appear at the bottom of the soil test report to help you interpret and use your results and recommendations.

24 Fertilization Soil Test Lime Raise ph 1 level= 2X available NPK More Growth Prior to Dry Weather Deeper roots, better uptake of water and nutrients Favors legumes Increases N from clovers/soybeans Lowers N costs Save $$$ Improves Forage/Hay Quality and distribution Winter survival
 Best growth & most efficient fertilizer use: 6.2 6.5")
25 Soil ph The Regulator A measure of acidity or alkalinity ph scale = 1 14 (7 = neutral) Best growth & most efficient fertilizer use:

26 Low ph Reduced nutrient availability Phosphorus Poor legume growth Survival and activity of N fixing bacteria reduced Increased aluminum availability Stunted root growth Reduced nutrient uptake-mg, Ca, P
27 ph (salt) Lime Makes Fertilizer Work Percent Nutrient Availability Nitrogen % Phosphorus % Potassium %
28
29
30 Fertilizer Nitrogen for Yield 40# N = 1 ton forage 1.0 t0 1.2 #N per bushel corn or wheat Phosphorus for Healthier Stands/ Yields Roots Legumes Potash (K) for Persistance and Drought Resistance Hay Legumes and soybeans Apply only what is needed and saleable Avoid micros, wonder products Boron alfalfa, soybeans Zinc corn Sulfur wheat
31 Soil Test Reports Report is: Good as your sample Don t get sample from truck wheel well Sample less than 20 Acres with 1 or more subsamples per Acre Recommendations are annually except for lime apply one time only Resample every 3 5 years
32 Summary Soil Test Talk to spouse and banker Lime First Limiting Nutrient(s) Meet Crop Needs Healthy Stands Control Weeds Pray for Rain
33 Thank you For additional information contact: Local Extension Office Gerald Bryan Extension Agronomist Jackson, MO
34
35 Minimum Soil Fertility Species ph(s) P K lb / acre Cool season grass Warm season grass Alfalfa Red Clover White Clover Birdsfoot Trefoil Lespedeza
36 ph Ranges for Successful Production Fescue Alfalfa Red Clover Lespedeza
37 Added Expense of a Low ph 3 Ton Cool Season Grass Hay Crop ph (salt) Fertilizer Wasted % Required Fertilizer Bill $ $ $ $ $102
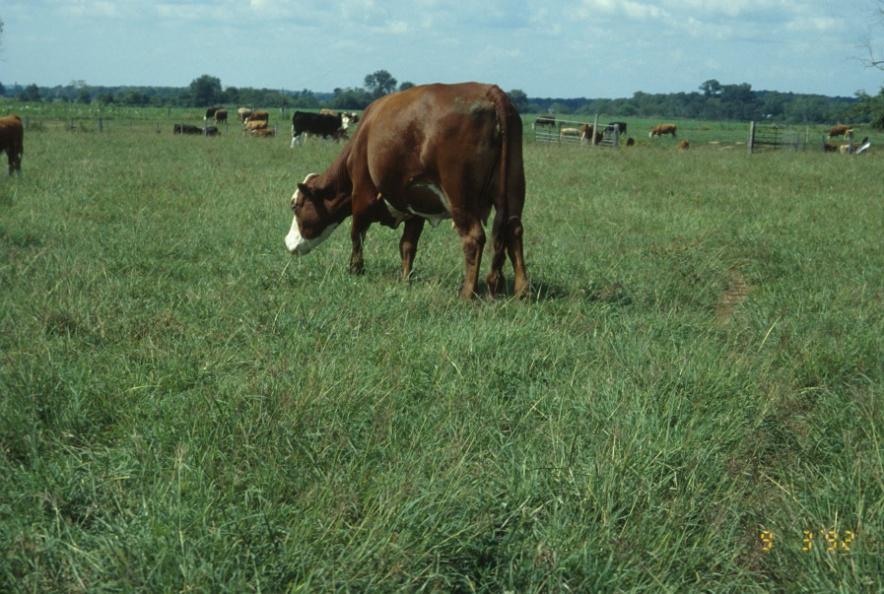
38 Pasture Fertility Fertilizer requirements for pastures are different than for cropping systems or even hay production More than 90% of phosphorus (P) and potassium (K) are returned to the soil About ½of the nitrogen applied to pasture is returned about ½ lost If apply $40 of N $20 returned to soil If apply $40 of P&K $39 to soil Growing legume to supply N cheaper
39 Nutrient Removal for Pasture Crop N P 2 O 5 K 2 O lb / acre Alfalfa hay (6 ton) 270* Cool season grass hay (3 ton) Cow calf pair