Irrigation Evaluations of Santa Clara County. Michael Cahn Irrigation and Water Resources Advisor University of California, Cooperative, Monterey Co
|
|
|
- Cynthia Flynn
- 5 years ago
- Views:
Transcription
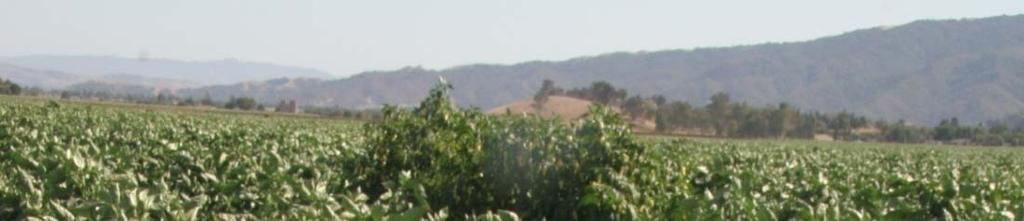
1 Irrigation Evaluations of Santa Clara County Pepper Production Michael Cahn Irrigation and Water Resources Advisor University of California, Cooperative, Monterey Co
2 Why improve irrigation management? Maximize e production and quality Conserve fertilizer Conserve water Water quality: ground and surface water


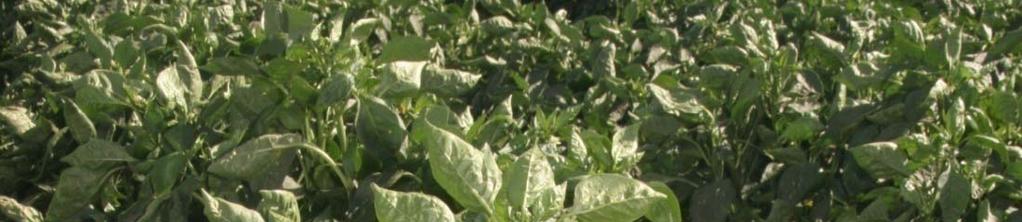


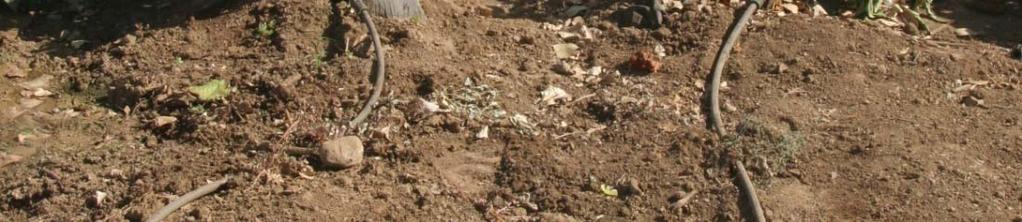
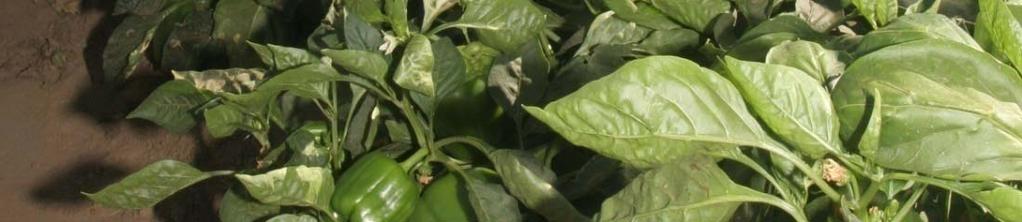
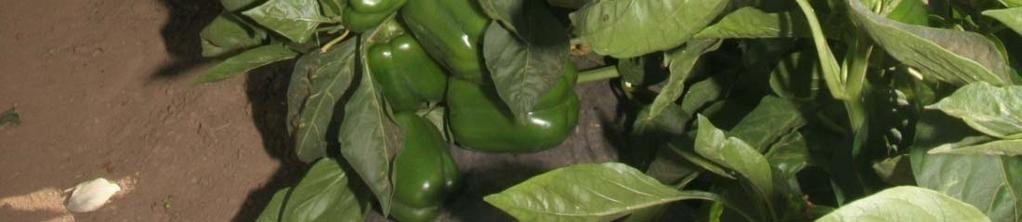

3 Optimizing Pepper Production Moderate soil moisture deficits it can cause yield loss
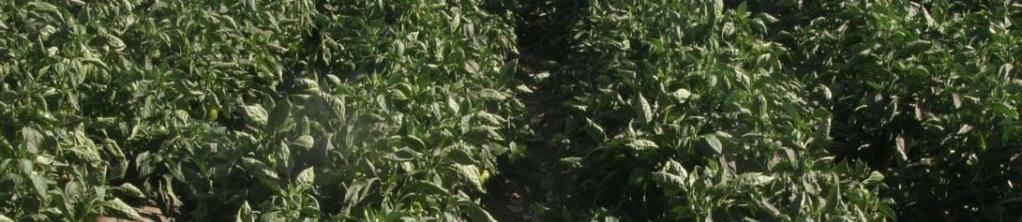
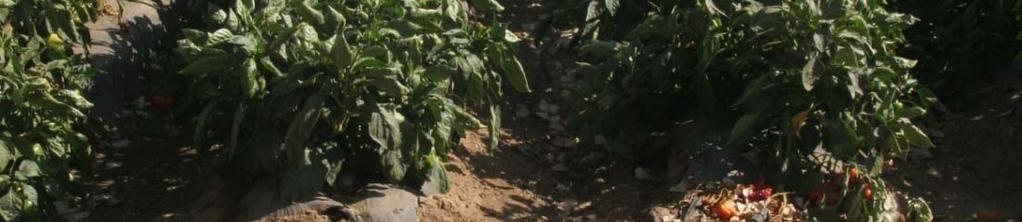
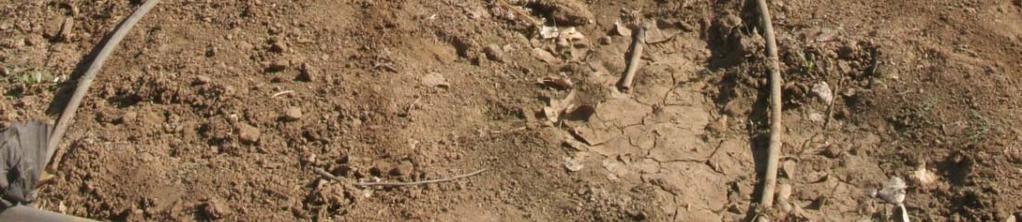
4 Principal Irrigation Strategies for Pepper Subsurface rfacedrip High distribution uniformity (> 85%) Frequent irrigations (< 3 day intervals) Soil moisture tensions < 20 cbars Apply more than 100% of crop ET
5 Irrigation Efficiency i = Water Requirement of Crop Total Amount of Water Applied Irrigation Requirement = Water Requirement of Crop Distribution Uniformity
6 Effect of non-uniformity on fertigation 0.6 Total Discharge Total NItrogen (gallons) Total Discharge Total Ni itrogen (gr ams) Distance Along the Lateral (feet) B. Hanson 1998
7 Piloting an Irrigation Efficiency Program in Santa Clara County Joint effort of Central Coast Ag Water Coalition, Farm Bureau, UCCE, and Santa Clara Valley Water Agency Turf, tomatoes, peppers, cherries, wine grapes, flowers (greenhouse) Subsurface drip, surface drip, overhead sprinklers, micro sprinklers, hand watering
8 Central Coast Irrigation Evaluation Program Goal: Provide a technical service that can address the needs of a sophisticated i agriculture system Build local lexpertise Experienced in irrigation/nutrient management Knowledge of regional agriculture and economic challenges Connected to network of agency resources
9 Components of the Irrigation Efficiency Program in Santa Clara County Uniformity evaluation System design and operation audit Scheduling evaluation


10 Irrigation Efficiency Report Part of the 2009 Santa Clara Irrigation Efficiency Project, a cooperative effort between ten Santa Clara County Farmers, Santa Clara County Farm Bureau, University of California Cooperative Extension, and the Central Coast Agricultural Water quality Coalition. Made possible by funding from the Santa Clara Valley Water District.
11 Map locations of all measurements
12 Distribution Uniformity Evaluation
13 Distribution Uniformity Evaluations Location Field 1 Field 2 DU lowest quarter head middle Tail Overall 85 88
14 Evaluation of Pressure Uniformity it
15 Pressure Effects on Tape Discharge Rate Tape Dis scharge Rate (gp pm/100 ft) (+ 22%) (- 29%) Pressure (psi)
16 Pressure Evaluation (Field 1)
17 Pressure Evaluation (Field 2) Measurement Time 1 Time 2 average submain pressure (psi) variation in submain pressure measurements (%) average tail pressure (psi) variation in tail pressure measurements (%) pressure loss along lateral line (psi) average within field pressure (psi) variation in within field measurements (%)
18 Distribution Evaluation and System Audit (drip systems) System pressure varied during the irrigation Pressure P too low in tape/drip hose Leaks at submain connections Material Mt ilin drip di lines Plugging of emitters
19 Summary of Warm Season Vegetable Irrigation Evaluations crop irrigation system DU lq Efficiency Irrigation % % pepper subsurface drip pepper subsurface drip freshmarket tomato subsurface drip freshmarket tomato surface drip Average 88 78
20 Irrigation Schedule Evaluation


 Gilroy")
21 Evapotranspiration p can be estimated using CIMIS weather stations: Solar Radiation Wind Speed Relative Humidity Air Temperature Active CIMIS Stations: San Benito (126) San Juan Valley (143) Gilroy (211) wwwcimis.water.ca.gov


 80.00 70.")


22 Converting Reference ET to Crop ET: Crop Coefficients ET crop = ET ref K crop Estimat ted Canopy Cover (%) K c can vary from 0.1 to wwwcimis.water.ca.gov % canopy: 29 DAP 5/7 5/27 6/16 7/6 7/26 8/15 9/4 9/24 10/14 62% canopy: 77 DAP
23 Compare Crop Water Requirements to Applied Water (Field 2) ied Water (inc ches) Applied Water Estimated Crop ET Cum mulative Appl /7 5/27 6/16 7/6 7/26 8/15 9/4 9/24 10/14 Date
24 Actual vs Recommended Irrigation (Field2) Applied Water per Irrigaitio (inches) n Difference btn Grower and Recommended Applied Water (inches) 5/ /30 6/6 6/ /13 6/ /20 6/ /27 7/4 7/ /11 7/ /18 7/ /25 8/1 8/8 8/ /15 8/ /22 8/ /29 9/5 9/ /12 9/ /19
25 Cumulative Crop ET and Applied Water (Field 1) inches) pplied Water ( Cumulative A Applied Water Estimated Crop ET /7 5/27 6/16 7/6 7/26 8/15 9/4 9/24 10/14 Date
26 Irrigation Schedule Summary Summary of Irrigation Schedule Field 1 Field 2 coefficient of variation of system flow rate (%) average flow rate (gpm) lowest flow rate (gpm) highest flow rate (gpm) average irrigation amount (inches) minimum irrigation amount (inches) maximum irrigation amount (inches)
27 Summary of Scheduling Evaluations Variation in flow rate among irrigation events (12% to 17%) Frequent irrigations (1 to 4 days) Applied water per irrigation ( inches) Average irrigation time (6 to 9 hours) 130% to 190% of crop ET
28 Lessons Learned All drip di fields evaluated dhdhi had high h distribution ib i uniformities Pressure in drip di systems needs to be regulated Crop ET is a good cross check of the irrigation schedule to avoid over irrigating i i
29 Thank you!