The Challenge for Growers
|
|
|
- Delilah Blair
- 5 years ago
- Views:
Transcription

1 1
2 The Challenge for Growers Majority of growers have already adopted more broadly accepted BMP s and are seeking new ways to increase productivity & profitability The number of products available to growers have grown dramatically in recent years with many new products diverging from what has been recommended and used on the Prairies While often intrigued by new or novel products, growers realize it is not possible to utilize every available input / tool and still remain profitable In many cases access to sound, third-party data to help determine which products are most likely to provide a return on investment is limited 2
3 Specialty Products spe cial ty (sp sh l-t ) An item or a product of a distinctive kind or of particular superiority Examples in Agriculture 1. Controlled release fertilizers / fertilizer enhancers ESN, Agrotain, Avail, Ortho-P (ie: Alpine ), Wolftrax DDP micronutrients, MES15 2. Seed dressings / inoculant Wolftrax Protinus TM, OMEX Primer, Alpine Seed Nutrition, Jumpstart ) 3. Soil Enhancers Best Environmenal Technologies TM Custom Formula Fertilizers 4. Foliar Nutrition OMEX P3 /C3, Alpine Foliar, Loveland/UAP - Black Label Zn, etc.) 5. Other miscellaneous products pod sealants, growth regulators, etc. Can be difficult to make distinction between specialty and conventional products depending on the context and frequency in which they are used (ie: fungicides) 3

 canola harvest management varietal")
4 What about practices? Many practices are also promoted and/or adopted, again often with limited supporting 3 rd party data Examples in Agriculture variable rate fertilizer fungicide timing (ie: with herbicide) canola harvest management varietal blends for disease management intercropping row spacing 4
5 The Origi of Yield Busters Initiated by IHARF Board of Directors February 2010 in respoe to two main concer: 1. Strong desire as Directors (& Farmers) to become more directly engaged in process of establishing research priorities 2. Unprecedented influx of products introduced & marketed with little or no 3 rd party research supporting their efficacy Researchers saw the project as an effective mea of connecting with farmers to identify their current challenges & potential gaps in research knowledge while enhancing public awareness & interest in activities Process involved canvassing individuals within agricultural community & challenging them to present the top 2 or 3 agronomic questio which they would like to see addressed All ideas put forward coidered with final selectio based on what was: 1. Important to producers 2. Practical and relatively straight forward to evaluate 3. Has not / is not already been exteively tested in W. Canada 5
6 Field Trials Two separate trials initated for 2010 growing season with funding provided by IHARF and Viterra and in-kind contributio from Western Ag Labs, BASF and Western Applied Research Corporation (WARC) 1. Micronutrient Seed Dressings on Various Crops 2. Fungicide Applicatio on Flax 6

7 Field Trials Secured additional funding from ADOPT & initiated a 3 rd trial in 2011 AGRICULTURAL DEMONTRATION OF PRACTICES & TECHNOLOGIES 1. Evaluating Various Fungicide Applicatio on Canola In-kind contributio from BASF, Bayer CropScience & Syngenta 7
 Canora 2) Indian Head 3) Scott 4) Swift")
 Untreated 2) Treated* *Omex")
 Data Collection 1) Emergence 2)")
8 MicroNutrient Seed Dressings on Various Crops Locatio 1) Canora 2) Indian Head 3) Scott 4) Swift Current Crops 1) Wheat 2) Canola 3) Lentil 4) Field Pea Seed Treatments 1) Untreated 2) Treated* *Omex Zn Primer for wheat/canola & Omex Pulse Primer for lentil/field pea) Data Collection 1) Emergence 2) Yield 8

9 Emergence Rate (All Crops) Indian Head Untreated Treated Plant Deity (plants m -2 ) : not significant * : 0.05 < P <= 0.10 ** : 0.01 < P <= 0.05 *** : P <= Days From Planting 9
10 Emergence Rate (All Crops) Indian Head Untreated Treated Plant Deity (plants m -2 ) : not significant * : 0.05 < P <= 0.10 ** : 0.01 < P <= 0.05 *** : P <= Days From Planting 10
11 Emergence Rate (All Crops) Scott Plant Deity (plants m -2 ) Untreated Treated : not significant * : 0.05 < P <= 0.10 ** : 0.01 < P <= 0.05 *** : P <= Days From Planting 11
12 Emergence Rate (All Crops) Swift Current Untreated Treated Plant Deity (plants m -2 ) : not significant * : 0.05 < P <= 0.10 ** : 0.01 < P <= 0.05 *** : P <= Days From Planting 12
13 Seed Dressing Effects on Grain Yield Canora 2010 Treated vs Untreated* Wheat: P = Canola: P = Lentil: P = Pea: P = All: P = *Results presented are from contrasts comparing yield with treated seed directly to untreated yields for each crop Grain Yield (kg ha -1 ) Untreated Treated 0 Wheat Canola Lentil Field Pea All Crops Crop Type 13
14 Seed Dressing Effects on Grain Yield Indian Head 2010 Treated vs Untreated* Wheat: P = Canola: P = Lentil: P = Pea: n/a All: P = *Results presented are from contrasts comparing yield with treated seed directly to untreated yields for each crop Grain Yield (kg ha -1 ) Untreated Treated 0 Wheat Canola Lentil Pea All Crops Crop Type 14
15 Seed Dressing Effects on Grain Yield Scott 2010 Treated vs Untreated* Wheat: P = Canola: P = Lentil: P = Pea: P = All: P = *Results presented are from contrasts comparing yield with treated seed directly to untreated yields for each crop Grain Yield (kg ha -1 ) Untreated Treated Wheat Canola Lentil Field Pea All Crops Crop Type 15
16 Seed Dressing Effects on Grain Yield Swift Current 2010 Treated vs Untreated* Wheat: P = Canola: P = Lentil: P = Pea: P = All: P = *Results presented are from contrasts comparing yield with treated seed directly to untreated yields for each crop Grain Yield (kg ha -1 ) Untreated Treated Wheat Canola Lentil Field Pea All Crops Crop Type 16
17 Seed Dressing Effects on Grain Yield Canora 2011 Treated vs Untreated* Wheat: P = Canola: P = Lentil: P = Pea: P = All: P = *Results presented are from contrasts comparing yield with treated seed directly to untreated yields for each crop Grain Yield (kg ha -1 ) Untreated Primer 0 Wheat Canola Lentil Field Pea All Crops Crop Type 17
18 Seed Dressing Effects on Grain Yield Indian Head 2011 Treated vs Untreated* Wheat: P = Canola: P = Lentil: P = Pea: P = All: P = *Results presented are from contrasts comparing yield with treated seed directly to untreated yields for each crop Grain Yield (kg ha -1 ) Untreated Treated 0 Wheat Canola Lentil Pea All Crops Crop Type 18
19 Seed Dressing Effects on Grain Yield Scott 2011 Treated vs Untreated* Wheat: P = Canola: P = Lentil: P = Pea: P = All: P = *Results presented are from contrasts comparing yield with treated seed directly to untreated yields for each crop Grain Yield (kg ha -1 ) Untreated Treated Wheat Canola Lentil Field Pea All Crops Crop Type 19
20 Seed Dressing Effects on Grain Yield Swift Current 2011 Treated vs Untreated* Wheat: P = Canola: P = Lentil: P = Pea: P = All: P = *Results presented are from contrasts comparing yield with treated seed directly to untreated yields for each crop Grain Yield (kg ha -1 ) Untreated Treated Wheat Canola Lentil Field Pea All Crops Crop Type 20
 Proline (0.")
21 Flax Respoe to Fungicide Locatio: 1) Indian Head 2) Canora 3) Swift Current Treatments Untreated Headline EC (0.16 l/ac) Proline (0.15 l/ac only) Data Collected: 1) Seed Yield 21

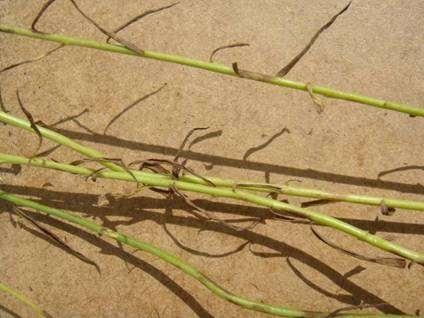


22 Visible Respoe 22


23 Visible Respoe 23
24 Effects of Fungicide on Flax Yield Fungicide Treatment by Location 3000 Seed Yield (kg/ha) *** *** ** Check Headline *** CAN-10 CAN-11 IH-10 IH-11 SWC-10 SWC-11 ALL Location 24
 Untreated 4) Lance + Headline (142")
 3) Lance (142 g/ac) 6) Astound (390 g/ac) Data Collected")
25 Canola Respoe to Fungicide Locatio 1) Indian Head 2) Canora 3) Swift Current Treatments 1) Untreated 4) Lance + Headline (142 g/ac+0.12 l/ac) 2) Headline (0.16 l/ac) 5) Proline (0.15 l/ac) 3) Lance (142 g/ac) 6) Astound (390 g/ac) Data Collected 1) Seed Yield 25
26 Canola Yield Canora Seed Yield (kg/ha) a 32 a 31 a 32 a 37 a 33 a Check Headline Lance Headline & Lance Proline Astound 26
27 Canola Yield Indian Head Seed Yield (kg/ha) c 43 ab a ab bc 45 ab Check Headline Lance Headline & Lance Proline Astound 27
28 Canola Yield Swift Current a a a a a a Seed Yield (kg/ha) Check Headline Lance Headline & Lance Proline Astound 28
29 Canola Yield All Sites Seed Yield (kg/ha) a 41 a a a a a Check Headline Lance Headline & Lance Proline Astound 29
30 Top Research Priorities 2011 Rank Research Topic # of Votes #1 Fungicide application (more crops) Rank Research Topic # of Votes 12 #7 Effects of elemental S on P2O5 availability 6 #2 Foliar (micro) nutrient products #3 In-crop nutrition (micro and/or macro-nutrient products #4 Effects of ESN on canola yield (seed place vs side band) #5 Row-spacing research (canola, pulses) #6 Fungicides at herbicide timing 11 #8 Nutritional / growth regulator products as safeners for seitive herbicide / crop combinatio 7 #9 Intercropping research (various aspects) 7 #10 MES P/S fertilizer vs ammonium sulphate blends 7 #11 Variety blends of wheat and/or canola (high disease pressure) 6 #12 Pod sealants for preserving grain quality (cereals and pulses)
31 How many site-years are enough? % 112% SWATHED STRAIGHT-CUT Grain Yield (kg/ha) % 110% 78% 92% 119% 101% 98% 0 IH-09 IH-10 SC-09 SC-10 ME-09 ME-10 SW-09 SW-10 ALL Site-Year 31
32 What is the probability of respoe? 4000 UNTREATED POD SEALANT #1 POD SEALANT #2 Grain Yield (kg/ha) ** Contrast - Treated vs Untreated : not significant * P = ** P = *** P < IH-09 IH-10 SC-09 SC-10 ME-09 ME-10 SW-09 SW-10 ALL Site-Year 32


33 Small Plots vs Field-Scale Pros & co to each Best approach varies with subject matter & objectives 33
34 Advantages Small Plot Research Relatively easy to control spatial variabilty Suitable for studies with large numbers of treatments (ie: variety trials, multiple factors) Lower risk / cost associated with failure Inteive data collection and monitoring of treatments is feasible Disadvantages Specialized equipment required Edge effects Largely limited to established research farms 34
35 Field-Scale Research Advantages Utilize commercial equipment Implemented by growers on their own farms Edge effects generally not an issue Lower cost Easier than ever with GPS and GIS Disadvantages Difficult to manage spatial variability Not practical for large number of treatments Higher risk if treatment results in yield loss Certain types of data collection not practical 35

36 Yield (bus/ac) Why statistical evaluation? Naturally occurring variability what is the probability that observed differences are due to chance? NO TREATMENTS APPLIED Pass # 36
37 Plot Size and Replication Source: Wuest et al J. Prod. Agric. 7:
38 Take Home Messages Yield-Busters can not possibly address every agronomic question brought bring forward but it is a small step in the right direction Data from multiple years & locatio is always desirable Probability of respoe is arguably just as important as average overall respoe Statistical analyses is critical for interpretation naturally occurring variability is inherent in field trials & can be misleading if not accounted for BUYER BEWARE Not unreasonable to request respoe data & to be critical of testimonials and non-replicated field trials 38


39 Acknowledgements East Central Research Farm AGRICULTURAL DEMONTRATION OF PRACTICES & TECHNOLOGIES 39


40 Chris Holzapfel Indian Head Agricultural Research Foundation Website: Phone: (306)