Farm Labor. Hired Workers Unchanged, Wage Rates Up 4 Percent From a Year Ago
|
|
|
- Juniper Burke
- 5 years ago
- Views:
Transcription

1 Washington, D.C. Farm Labor Released May 8, 007, by the National Agricultural Statistics Service (NASS),, U.S. Department of Agriculture. For information on call Mark Aitken at , office hours 7:0 a.m. to :00 p.m. ET. Hired Workers Unchanged, Wage Rates Up Percent From a Year Ago There were 96,000 hired workers on the Nation s farms and ranches during the week of April 8-, 007, unchanged from a year ago. A large increase in California was enough to offset the large declines in hired workers in most other regions, resulting in a net change of zero from last April. Of these hired workers, 70,000 workers were hired directly by farm operators. Agricultural service employees on farms and ranches made up the remaining,000 workers. Farm operators paid their hired workers an average wage of $0.7 per hour during the April 007 reference week, up 9 cents from a year earlier. Field workers received an average of $9.5 per hour, up 0 cents from last April, while livestock workers earned $9.55 per hour compared with $9. a year earlier. The field and livestock worker combined wage rate, at $9. per hour, was up 5 cents from last year. The number of hours worked averaged 0.6 hours for hired workers during the survey week, down fractionally from a year ago. The largest increases in the number of hired farm workers from last year occurred in California, Florida, and in the Northeast II (Delaware, Maryland, New Jersey, and Pennsylvania) and Mountain I (Idaho, Montana, and Wyoming) regions. In California, last year s reference week was plagued by rainfall and unseasonably cool temperatures, which delayed most fieldwork. This year, a return to more normal weather patterns allowed cotton and rice planting to progress well ahead of average, increasing the demand for field workers. Cold, wet conditions in the Northeast II region slowed most outdoor field activities. However, continued strong demand from nurseries, greenhouses, and dairies was more than enough to offset the reduced need for workers in most other agricultural sectors. In the Mountain I region, dry, seasonable weather in Idaho offset below normal temperatures and damp conditions in the rest of the region, resulting in a collectively higher demand for hired workers. Florida experienced abnormally dry conditions last April. This year, soil moisture levels have increased, allowing more fieldwork to be accomplished and causing more hired workers to be needed. The largest decreases in the number of hired farm workers from a year ago were in the Appalachian I (North Carolina and Virginia), Appalachian II (Kentucky, Tennessee, and West Virginia), Corn Belt II (Iowa and Missouri), Southern Plains (Oklahoma and Texas), and Northeast I (New England and New York) regions. In the Appalachian I and II regions, hard freezes early in the reference week, along with heavy rains later in the week, severely curtailed most field activities. Therefore, the demand for hired workers in both regions was considerably lower. Frigid temperatures, torrential rains, and snow from two strong winter storms caused major fieldwork delays in the Corn Belt II, Southern Plains, and Northeast I regions. Field worker demand was down in all three regions due to these undesirable conditions. Hired farm worker wage rates were generally above a year ago in most regions. The largest increases occurred in the Appalachian II, Mountain II (Colorado, Nevada, and Utah), (Arkansas, Louisiana, and Mississippi), and Northern Plains (Kansas, Nebraska, North Dakota, and South Dakota) regions, and Florida. In the Appalachian II and Mountain II regions, the higher wages were due to a larger proportion of salaried workers putting in fewer hours, which pushed the average hourly wage higher. The higher wages in the region were due to a greater percentage of nursery and greenhouse workers in the work force. In the Northern Plains region, the higher wages were due to a lower proportion of part time workers. The higher wages in Florida were due to a larger percentage of fresh market vegetable pickers in the work force. Tomatoes and other fresh market vegetables require extra care and skill during harvest to minimize crop damage. Therefore, these workers receive higher wages. Sp Sy 8 (5-07)

2 May 007 NASS, USDA
3 Farm Employment Hired Workers 50 Days or More 9 Days or Less : Employment and Wage Rates, United States, April 8-, 007, with Comparisons April 9-5, 006 January 7-, 007 April 8-, 007,000,000, Agricultural Services Workers Working on Farms Hired Farm & Service Workers Hours per Week Hours per Week Hours per Week Hours Worked Hired Wage Rate for All Hired Workers Dollars per Hour Dollars per Hour Dollars per Hour Type of Worker Field & Livestock Combined Field Livestock Excludes AK. The January 007 Survey was not conducted. Benefits, such as housing and meals, are provided some workers but the values are not included in the wage rates. Excludes Agricultural Service Workers May 007 NASS, USDA
4 Northeast I Northeast II U.S. and Region Hired Workers: Number and Hours Worked by Region and United States, April 8-, 007 Number of Workers Hired Expected to be Employed 50 Days or More 9 Days or Less Number of Hours Worked,000,000,000 Hours per Week Appalachian I Appalachian II Southeast FL Cornbelt I Cornbelt II Northern Plains Southern Plains Mountain I Mountain II Mountain III CA HI US Excludes Agricultural Service Workers. Region map on page. Excludes AK May 007 NASS, USDA
5 Northeast I Northeast II U.S. and Region Hired Workers: Wage Rates for Type of Worker and All Hired Workers by Region and United States, April 8-, 007 Field Type of Worker Livestock Field & Lvstk Combined Wage Rates for All Hired Workers Dollars per Hour Dollars per Hour Dollars per Hour Dollars per Hour Appalachian I Appalachian II Southeast FL Cornbelt I Cornbelt II Northern Plains Southern Plains Mountain I Mountain II Mountain III CA HI US Excludes Agricultural Service Workers. Region map on page. Excludes AK. Insufficient data for livestock May NASS, USDA
6 Northeast I Northeast II U.S. and Region Hired Workers: Number and Hours Worked by Region and United States, April 9-5, 006 Number of Workers Hired Expected to be Employed 50 Days or More 9 Days or Less Number of Hours Worked,000,000,000 Hours per Week Appalachian I Appalachian II Southeast FL Cornbelt I Cornbelt II Northern Plains Southern Plains Mountain I Mountain II Mountain III CA HI US Excludes Agricultural Service Workers. Region map on page. Excludes AK May NASS, USDA
7 Northeast I Northeast II U.S. and Region Hired Workers: Wage Rates for Type of Worker and All Hired Workers by Region and United States, April 9-5, 006 Field Type of Worker Livestock Field & Lvstk Combined Wage Rates for All Hired Workers Dollars per Hour Dollars per Hour Dollars per Hour Dollars per Hour Appalachian I Appalachian II Southeast FL Cornbelt I Cornbelt II Northern Plains Southern Plains Mountain I Mountain II Mountain III CA HI US Excludes Agricultural Service Workers. Region map on page. Excludes AK. Insufficient data for livestock May NASS, USDA
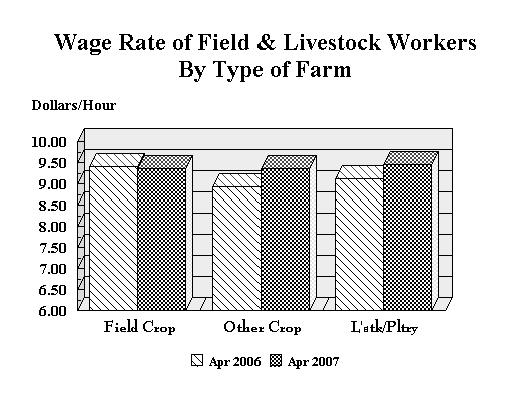
8 Field and Livestock Workers Combined: Wage Rates, by Type of Farm, by Region and 8 States Region Field Other Livestock & All April 9-5, 006 Crops Crops Poultry Farms Dollars per Hour Dollars per Hour Dollars per Hour Dollars per Hour Northeast Appalachian Southeast Cornbelt Northern Plains Southern Plains Mountain 8 States Field and Livestock Workers Combined: Wage Rates, by Type of Farm, by Region and 8 States Region Field Other Livestock & All April 8-, 007 Crops Crops Poultry Farms Dollars per Hour Dollars per Hour Dollars per Hour Dollars per Hour Northeast Appalachian Southeast Cornbelt Northern Plains Southern Plains Mountain 8 States Excludes Agricultural Service Workers. Regions consist of the following States: Northeast: CT, DE, MD, ME, MA, NH, NJ, NY, PA, RI, VT. Appalachian: KY, NC, TN, VA, WV. Southeast: AL, FL, GA, SC. : MI, MN, WI. Cornbelt: IA, IL, IN, MO, OH. : AR, LA, MS. Northern Plains: KS, NE, ND, SD. Southern Plains: OK, TX. Mountain: AZ, CO, ID, MT, NM, NV, UT, WY. : CA, OR, WA. 8 States: All States, excluding AK and HI. Insufficient data May NASS, USDA
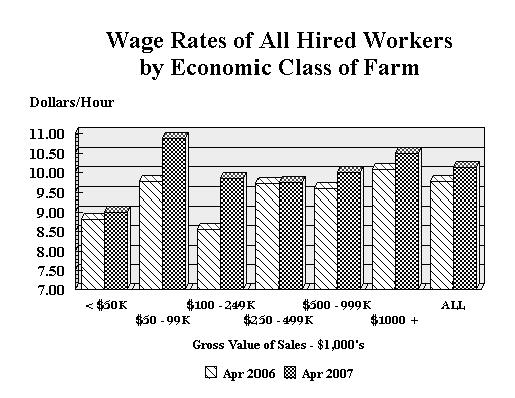
9 All Hired Workers: Wage Rates, by Economic Class of Farm by Region and 8 States April 9-5, 006 Region Gross Value Sales-$,000's N. East Appal. S. East Cornbelt N. Plains S. Plains Mountain 8 States < ,000+ All Farms Dollars per Hour Dollars per Hour Dollars per Hour Dollars per Hour Dollars per Hour Dollars per Hour Dollars per Hour All Hired Workers: Wage Rates, by Economic Class of Farm by Region and 8 States April 8-, 007 Region Gross Value Sales-$,000's N. East Appal. S. East Cornbelt N. Plains S. Plains Mountain 8 States < ,000+ All Farms Dollars per Hour Dollars per Hour Dollars per Hour Dollars per Hour Dollars per Hour Dollars per Hour Dollars per Hour Excludes Agricultural Service Workers. Regions consist of the following States: Northeast: CT, DE, MD, ME, MA, NH, NJ, NY, PA, RI, VT. Appalachian: KY, NC, TN, VA, WV. Southeast: AL, FL, GA, SC. : MI, MN, WI. Cornbelt: IA, IL, IN, MO, OH. : AR, LA, MS. Northern Plains: KS, NE, ND, SD. Southern Plains: OK, TX. Mountain: AZ, CO, ID, MT, NM, NV, UT, WY. : CA, OR, WA. 8 States: All States, excluding AK and HI. Insufficient data May NASS, USDA
10 Type of Farm Field Crops Other Crops Livestock, Dairy, & Poultry Field and Livestock Workers: Distribution by Type of Farm, 8 States April 9-5, 006 Percent of Field and Livestock Workers January 7-, April 8-, Percent of Field and Livestock Workers Percent of Field and Livestock Workers 5 5 Gross Value of Sales Less than $50,000 $50,000-$99,999 $00,000-$9,999 $50,000-$99,999 $500,000-$999,999 $,000,000 and over Hired Workers: Distribution by Economic Class of Farm, 8 States April 9-5, 006 January 7-, April 8-, Percent of Hired Workers Percent of Hired Workers Percent of Hired Workers Category Employed on Farms Hiring Worker Workers -6 Workers 7-0 Workers -0 Workers -50 Workers 5 or more Workers 8 States, excluding AK and HI. Field and Livestock Workers combined. Excludes Agricultural Service Workers. The January Survey was not conducted. Hired Workers: Distribution by Category, United States, April 9-5, 006 January 7-, 007 April 8-, 007 Percent of Hired Workers Percent of Hired Workers Percent of Hired Workers May NASS, USDA
11 Agricultural Services Agricultural service operations provided,000 workers for the Nation's farms and ranches during the week of April 8-, 007. Agricultural service workers in California numbered 98,000 this April, up percent from last year. Florida's number of agricultural service workers was 8,000, unchanged from last year. The average wages received by agricultural service workers in California and Florida were $9.50 and $0.5 per hour, respectively. Comparable wages in April 006 were $9.87 in California and $9.60 in Florida. CA FL State Apr 006 Agricultural Service Workers: Number, Hours Worked, and Wage Rates, for California, Florida, and United States Number of Workers Working on Farms Jan Apr Apr 006 Hours Worked Jan Apr ,000,000,000 Hours Hours Hours Apr 006 Dollars per Hour Wage Rates Jan Apr Dollars per Hour Dollars per Hour US.0.0 Data are for Agricultural Services performed on the farm by custom service units such as crew leaders or custom crews. These statistics are not included in the State-Regional tables. United States data not available. Benefits, such as housing and meals, are provided to some workers but the values are not included in the wage rates. The January Survey was not conducted. May 007 NASS, USDA
12 Regions Region Northeast I Northeast II Appalachian I Appalachian II Southeast Cornbelt I Cornbelt II Northern Plains Southern Plains Mountain I Mountain II Mountain III States CT, ME, MA, NH, NY, RI, VT. DE, MD, NJ, PA. NC, VA. KY, TN, WV. AL, GA, SC. MI, MN, WI. IL, IN, OH. IA, MO. AR, LA, MS. KS, NE, ND, SD. OK, TX. ID, MT, WY. CO, NV, UT. AZ, NM. OR, WA. May 007 NASS, USDA
13 Definitions The following definitions are provided to assist in interpreting statistics published in quarterly reports. To ensure consistency in data collection, the questionnaires and instruction manual used by the interviewers provide more in-depth explanations of these terms. Farm or Ranch: A place that sells, or would normally sell, at least $,000 worth of agricultural products during the year. Agricultural Work: Work done on a farm or ranch in connection with the production of agricultural products, including nursery and greenhouse products and animal specialties such as fur farms or apiaries. Also included is work done off the farm to handle farm related business, such as trips to buy feed or deliver products to local market. Hired Worker: Anyone, other than an agricultural service worker, who was paid for at least one hour of agricultural work on a farm or ranch. Worker type is determined by what the employee was primarily hired to do, not necessarily what work was done during the survey week. Type of workers include: Field Workers: Employees engaged in planting, tending and harvesting crops including operation of farm machinery on crop farms. Livestock Workers: Employees tending livestock, milking cows or caring for poultry, including operation of farm machinery on livestock or poultry operations. Supervisors: Hired managers, range foremen, crew leaders, etc. Other Workers: Employees engaged in agricultural work not included in the other three categories. Bookkeepers and pilots are examples. Methods of Pay: All wage rates are calculated based on total wages paid and total hours worked during the survey reference week. Wages paid other than hourly (bi-weekly, monthly, etc.) are converted to an hourly basis prior to summarization. Wages paid by piece rate (per quantity of produce picked, etc.) are also converted to an hourly basis. Perquisites: Benefits, such as cash bonuses, housing, or meals, provided to an employee in addition to pay are included in perquisites. Wage rates published in this release do not include the value of these benefits. Term of Employment: The length of time during the year the farm operator expects to employ those workers who were on the payroll during the survey week. May 007 NASS, USDA
14 Definitions - continued Agricultural Service: Any farm-related service performed on a farm or ranch on a contract or fee basis. This primarily includes activities performed by contract workers on fruit, vegetable, or berry operations. It also includes custom work (see below), veterinarian work, artificial insemination, sheep shearing, milk testing, or any other farm-related activity performed on a farm or ranch on a fee per service basis rather than hourly. Contract Labor: Contract workers are paid by a crew leader, contractor, buyer, processor, cooperative, or other person who has an oral or written agreement with a farmer/rancher. Pruning, thinning, weeding or harvesting of fruit, vegetable or berry crops are examples. A machine is not a part of the service activity provided by the contractor. Custom Work: Work performed by machines and labor hired as a unit. Hay baling, combining, corn or cotton picking, spraying, fertilizing, and laser leveling are examples of custom work when the equipment is included in the service activity. Type of Farm (or Ranch): An operation is classified in the farm type which accounts for the largest portion of the total gross value of sales for its agricultural production. The three types of farms broken out in this publication are: Field Crops: A farm producing wheat, rice, corn, soybeans, barley, dry beans, rye, sorghum, cotton, popcorn, tobacco, or other such crops. Other Crops: A farm producing vegetables, melons, berry crops, grapes, tree nuts, citrus fruits, deciduous tree fruits, avocados, dates, figs, olives, nursery, or greenhouse crops. This category also includes farms producing potatoes, sugar crops, hay, peanuts, hops, mint, and maple syrup. Livestock or Poultry: A farm producing cattle, hogs, sheep, goats, milk, chickens, eggs, turkeys, or animal specialties such as furs, fish, honey, etc. Gross Value of Sales: This includes all income during a year from the sale of crops, livestock, dairy, poultry, or other related agricultural products, including the landlord's share. When commodities are placed under CCC loan, they are considered as sold. May 007 NASS, USDA
15 Reliability of Estimates Survey Procedures: These data were collected by the National Agricultural Statistics Service (NASS) during the last two weeks of April using sampling procedures to ensure every employer of agricultural workers had a chance of being selected. Two samples of farm operators are selected. First, NASS maintains a list of farms that hire farm workers. Farms on this list are classified by size and type. Those expected to employ large numbers of workers are selected with greater frequency than those hiring few or no workers. A second sample consists of segments of land scientifically selected from an area sampling frame. Each June, highly trained interviewers locate each selected land segment and identify every farm operating land within the sample segment's boundaries. The names of farms found in these area segments are matched against the NASS list of farms; those not found on the list are included in the labor survey sample to represent all farms. This methodology is known as multiple frame sampling, with an area sample used to measure the incompleteness of the list. Additionally, a list of agricultural service firms was sampled in California and Florida. The survey reference week was April 8-, 007. Reliability: Two types of errors, sampling and non-sampling, are always present in an estimate based on a sample survey. Both types affect the "accuracy" of the estimates. Sampling error occurs because a complete census is not taken. The sampling error measures the variation in estimates from the average of all possible samples. An estimate of 00 with a sampling error of would mean that chances are 9 out of 0 that the estimates from all possible samples averaged together would be between 98 and 0; which is the survey estimate, plus or minus two times the sampling error. The sampling error expressed as a percent of the estimate is called the relative sampling error. The relative sampling error for number of hired workers at the U.S. level is normally less than 5 percent. The relative sampling error for the number of hired workers generally ranged between and 7 percent at the regional level. The U.S. all hired farm worker wage rate had a relative sampling error of 0.8 percent. The relative sampling error was 0.6 percent for the combined field and livestock worker wage rate. Relative sampling errors for the all hired farm worker wage rate generally ranged between and 5 percent at the regional levels. Relative sampling errors for wage rates published by type of farm and economic class of farm generally ranged between and 6 percent at the regional level. Non-sampling errors can occur in a complete census as well as in sample surveys. They are caused by the inability to obtain correct information from each operation sampled, differences in interpreting questions or definitions, and mistakes in editing, coding or processing the data. Special efforts are taken at each step of the survey to minimize non-sampling errors. Revision Policy: Farm labor information is subject to revision the next time the information is published or the year after the original publication date. The basis for revision must be supported by additional data that directly affect the level of the estimate. Worker numbers and wage rates for April 006 were subject to revision with this report. If any revisions were made to previous data, they are reprinted in this report for your information, and they are identified as such. May NASS, USDA
16 Index U.S. Hired Workers on Farms, Wage Rates and Hours Worked... Number of Workers and Average Hours Worked by Region and U.S. April April Wage Rates by Region and U.S. April April Agricultural Services: Workers, Average Hours Worked, and Wages April April Other Labor Estimates U.S. Distribution of Workers... 0 Wage Rates by Type of Farm, by Region, State, 8 States... 8 Wage Rates by Economic Class of Farm, by Region, State, 8 States... 9 Region Map... Definitions... Reliability of Estimates... 5 Revision Policy... 5 Page May NASS, USDA
17 The next report will be released at p.m. ET on August 7, 007. ACCESS TO REPORTS!! For your convenience, there are several ways to obtain NASS reports, data products, and services: INTERNET ACCESS All NASS reports are available free of charge on the worldwide Internet. For access, connect to the Internet and go to the NASS Home Page at: SUBSCRIPTION All NASS reports are available by subscription free of charge direct to your address. Starting with the NASS Home Page at under the right navigation, Receive reports by , click on National or State. Follow the instructions on the screen PRINTED REPORTS OR DATA PRODUCTS CALL OUR TOLL-FREE ORDER DESK: (U.S. and Canada) Other areas, please call FAX: (Visa, MasterCard, check, or money order acceptable for payment.) ASSISTANCE For assistance with general agricultural statistics or further information about NASS or its products or services, contact the Agricultural Statistics Hotline at , 7:0 a.m. to :00 p.m. ET, or nass@nass.usda.gov. The U.S. Department of Agriculture (USDA) prohibits discrimination in all its programs and activities on the basis of race, color, national origin, age, disability, and where applicable, sex, marital status, familial status, parental status, religion, sexual orientation, genetic information, political beliefs, reprisal, or because all or a part of an individual s income is derived from any public assistance program. (Not all prohibited bases apply to all programs.) Persons with disabilities who require alternative means for communication of program information (Braille, large print, audiotape, etc.) should contact USDA s TARGET Center at (0) (voice and TDD). To file a complaint of discrimination, write to USDA, Director, Office of Civil Rights, 00 Independence Avenue, S.W., Washington, D.C , or call (800) (voice) or (0) (TDD). USDA is an equal opportunity provider and employer.