Farm Labor. Hired Workers Up 3 Percent, Wage Rates Up 4 Percent From a Year Ago
|
|
|
- Job Welch
- 5 years ago
- Views:
Transcription

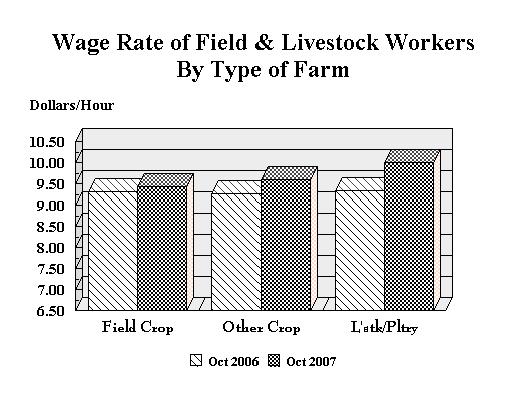
1 Washington, D.C. Farm Labor Released November 16,, by the National Agricultural Statistics Service (NASS),, U.S. Department of Agriculture. For information on call Mark Aitken at , office hours 7:30 a.m. to 4:00 p.m. ET. Hired Workers Up 3 Percent, Wage Rates Up 4 Percent From a Year Ago There were 1,122,000 hired workers on the Nation s farms and ranches during the week of October 7-13,, up 3 percent from a year ago. Of these hired workers, 806,000 workers were hired directly by farm operators. Agricultural service employees on farms and ranches made up the remaining 316,000 workers. Farm operators paid their hired workers an average wage of $10.33 per hour during the October reference week, up 37 cents from a year earlier. Field workers received an average of $9.62 per hour, up 36 cents from last October, while livestock workers earned $9.98 per hour compared with $9.42 a year earlier. The field and livestock worker combined wage rate, at $9.72 per hour, was up 42 cents from last year. The number of hours worked averaged 42.1 hours for hired workers during the survey week, up fractionally from a year ago. The largest increases in the number of hired farm workers from last year occurred in the Southern Plains (Oklahoma and Texas), Appalachian I (North Carolina and Virginia), (Michigan, Minnesota, and Wisconsin), and Appalachian II (Kentucky, Tennessee, and West Virginia) regions. In the Southern Plains and regions, considerably drier conditions compared with last year s reference week resulted in a stronger demand for hired workers. Warm, dry conditions in the Appalachian I region caused vegetables to mature rapidly, and cotton harvest in North Caroliana was well ahead of last year s pace. These factors led to an increased need for hired workers. In the Appalachian II region, worker demand was higher due to increased sorghum harvest in Kentucky and increased cotton harvest in Tennessee compared with last year s pace. The largest decreases in the number of hired farm workers from a year ago were in the (Oregon and Washington), California, Mountain II (Colorado, Nevada, and Utah), Northeast II (Delaware, Maryland, New Jersey, and Pennsylvania), and (Arkansas, Louisiana, and Mississippi) regions. In the region, wetter conditions compared with last year s reference week caused some fieldwork delays and reduced the demand for hired workers. In California, worker numbers were down slightly from last year due to continued shortages caused by unsettled political issues on immigration. Some California grape growers have resorted to mechanical harvest methods becauese of the worker shortages. Persistent dryness in the Mountain II region delayed completion of small grain seeding. The lack of precipitation also caused pastures to deteriorate and led some livestock producers to reduce inventories. Therefore, fewer hired workers were needed. In the Northeast II region, lingering effects from the season-long drought caused production of corn and soybeans to be considerably below last year, lowering worker demand. Dry conditions In the region slowed the progress of winter wheat seeding, decreasing the demand for hired workers. Hired farm worker wage rates were generally above a year ago in most regions. The largest increases occurred in the Northeast II,, Mountain II, Mountain III (Arizona and New Mexico), and Corn Belt II (Iowa and Missouri) regions. In the Northeast II, Mountain II, and Corn Belt II regions, the higher wages were due to a lower proportion of part time workers. Strong demand for skilled workers in the dairy industry pushed wages higher in the Mountain III region. In the Region, the higher wages were due to the heavy demand for skilled fruit pickers and dairy workers. The U.S. all hired worker annual average wage rate was $10.21, up 3 percent from the 2006 annual average wage rate of $9.87. The U.S. field worker annual average wage rate was $9.40, up 34 cents from last year s annual average. The field and livestock worker combined annual average wage rate at the U.S. level was $9.49, up 4 percent from last year s annual average wage rate of $9.15. Sp Sy 8 (11-07)

2 November 2 NASS, USDA
3 Farm Employment Hired Workers 150 Days or More 149 Days or Less : Employment and Wage Rates, United States, October 7-13,, with Comparisons 1 October 8-14, 2006 July 8-14, October 7-13, 1,000 1,000 1, *843 * Agricultural Services Workers Working on Farms 286 * Hired Farm & Service Workers 1,086 *1,206 1,122 Hours per Week Hours per Week Hours per Week Hours Worked Hired 41.9 * Wage Rate for All Hired Workers 2 3 Dollars per Hour Dollars per Hour Dollars per Hour 9.96 * Type of Worker Field & Livestock Combined Field Livestock *9.37 *9.24 *9.73 * Revised. 1 Excludes AK. 2 Benefits, such as housing and meals, are provided some workers but the values are not included in the wage rates. 3 Excludes Agricultural Service Workers November 3 NASS, USDA
4 U.S. and Region 2 Northeast I Northeast II Hired Workers: Number and Hours Worked by Region and United States, October 7-13, 1 Number of Workers Hired Expected to be Employed 150 Days or More 149 Days or Less Number of Hours Worked 1,000 1,000 1,000 Hours per Week Appalachian I Appalachian II Southeast FL Cornbelt I Cornbelt II Northern Plains Southern Plains Mountain I Mountain II Mountain III CA HI US 3 1 Excludes Agricultural Service Workers. 2 Region map on page Excludes AK. November 4 NASS, USDA
5 Northeast I Northeast II Hired Workers: Wage Rates for Type of Worker and All Hired Workers by Region and United States, October 7-13, 1 U.S. Type of Worker and Region 2 Field Livestock Field & Lvstk Combined Wage Rates for All Hired Workers Dollars per Hour Dollars per Hour Dollars per Hour Dollars per Hour Appalachian I Appalachian II Southeast FL Cornbelt I Cornbelt II Northern Plains Southern Plains Mountain I Mountain II Mountain III CA HI US 3 1 Excludes Agricultural Service Workers. 2 Region map on page Excludes AK. 4 Insufficient data for livestock. November 5 NASS, USDA
6 U.S. and Region 2 Northeast I Northeast II Hired Workers: Number and Hours Worked by Region and United States, July 8-14, 1 Number of Workers Hired Expected to be Employed 150 Days or More 149 Days or Less Number of Hours Worked 1,000 1,000 1,000 Hours per Week Appalachian I Appalachian II Southeast FL Cornbelt I Cornbelt II Northern Plains Southern Plains Mountain I Mountain II Mountain III CA 92 * * *46.9 HI US 3 * Revised. 1 Excludes Agricultural Service Workers. 2 Region map on page 16. *843 * * Excludes AK. November 6 NASS, USDA
7 Northeast I Northeast II Hired Workers: Wage Rates for Type of Worker and All Hired Workers by Region and United States, July 8-14, 1 U.S. Type of Worker and Region 2 Field Livestock Field & Lvstk Combined Wage Rates for All Hired Workers Dollars per Hour Dollars per Hour Dollars per Hour Dollars per Hour Appalachian I Appalachian II Southeast FL Cornbelt I Cornbelt II Northern Plains Southern Plains Mountain I Mountain II Mountain III CA 9.64 * * * *10.32 HI US 3 * Revised. 1 Excludes Agricultural Service Workers. 2 Region map on page 16. *9.24 *9.73 *9.37 * Excludes AK. 4 Insufficient data for livestock. November 7 NASS, USDA
8 U.S. and Region 2 Northeast I Northeast II Hired Workers: Number and Hours Worked by Region and United States, October 8-14, Number of Workers Hired Expected to be Employed 150 Days or More Days or Less 3 Number of Hours Worked 1,000 1,000 1,000 Hours per Week Appalachian I Appalachian II Southeast FL Cornbelt I Cornbelt II Northern Plains Southern Plains Mountain I Mountain II Mountain III CA 85 * * *45.7 HI US 3 * Revised. 1 Excludes Agricultural Service Workers. 2 Region map on page 16. *800 * * Excludes AK. November 8 NASS, USDA
9 Northeast I Northeast II Hired Workers: Wage Rates for Type of Worker and All Hired Workers by Region and United States, October 8-14, U.S. Type of Worker and Region 2 Field Livestock Field & Lvstk Combined Wage Rates for All Hired Workers Dollars per Hour Dollars per Hour Dollars per Hour Dollars per Hour Appalachian I Appalachian II Southeast FL Cornbelt I Cornbelt II Northern Plains Southern Plains Mountain I Mountain II Mountain III CA * * * *10.11 HI US 3 * Revised. 1 Excludes Agricultural Service Workers. 2 Region map on page 16. *9.26 *9.42 *9.30 * Excludes AK. 4 Insufficient data for livestock. November 9 NASS, USDA
10 Region 2 Northeast Appalachian Southeast Cornbelt Northern Plains Southern Plains Mountain 48 States Field and Livestock Workers Combined: Wage Rates, by Type of Farm, by Region and 48 States 1 Field Crops Other Crops October 8-14, 2006 Livestock & Poultry All Farms Dollars per Hour Dollars per Hour Dollars per Hour Dollars per Hour ( 3 ) Region 2 Northeast Appalachian Southeast Cornbelt Northern Plains Southern Plains Mountain 48 States Field and Livestock Workers Combined: Wage Rates, by Type of Farm, by Region and 48 States 1 Field Crops Other Crops October 7-13, Livestock & Poultry All Farms Dollars per Hour Dollars per Hour Dollars per Hour Dollars per Hour ( 3 ) ( 3 ) Excludes Agricultural Service Workers. 2 Regions consist of the following States: Northeast: CT, DE, MD, ME, MA, NH, NJ, NY, PA, RI, VT. Appalachian: KY, NC, TN, VA, WV. Southeast: AL, FL, GA, SC. : MI, MN, WI. Cornbelt: IA, IL, IN, MO, OH. : AR, LA, MS. Northern Plains: KS, NE, ND, SD. Southern Plains: OK, TX. Mountain: AZ, CO, ID, MT, NM, NV, UT, WY. : CA, OR, WA. 48 States: All States, excluding AK and HI. 3 Insufficient data November 10 NASS, USDA
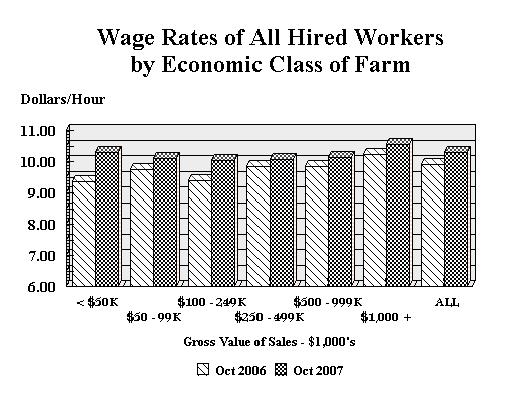
11 All Hired Workers: Wage Rates, by Economic Class of Farm by Region and 48 States 1 October 8-14, 2006 Region 2 Gross Value Sales-$1,000's < ,000+ All Farms N. East Appal. S. East Cornbelt N. Plains S. Plains Mountain 48 States Dollars per Hour Dollars per Hour Dollars per Hour Dollars per Hour Dollars per Hour Dollars per Hour Dollars per Hour ( 3 ) ( 3 ) ( 3 ) All Hired Workers: Wage Rates, by Economic Class of Farm by Region and 48 States 1 October 7-13, Region 2 Gross Value Sales-$1,000's < ,000+ All Farms N. East Appal. S. East Cornbelt N. Plains S. Plains Mountain 48 States Dollars per Hour Dollars per Hour Dollars per Hour Dollars per Hour Dollars per Hour Dollars per Hour Dollars per Hour ( 3 ) ( 3 ) ( 3 ) Excludes Agricultural Service Workers. 2 Regions consist of the following States: Northeast: CT, DE, MD, ME, MA, NH, NJ, NY, PA, RI, VT. Appalachian: KY, NC, TN, VA, WV. Southeast: AL, FL, GA, SC. : MI, MN, WI. Cornbelt: IA, IL, IN, MO, OH. : AR, LA, MS. Northern Plains: KS, NE, ND, SD. Southern Plains: OK, TX. Mountain: AZ, CO, ID, MT, NM, NV, UT, WY. : CA, OR, WA. 48 States: All States, excluding AK and HI. 3 Insufficient data November 11 NASS, USDA
12 Type of Farm Field Crops Other Crops Livestock, Dairy, & Poultry Field and Livestock Workers: Distribution by Type of Farm, 48 States October 8-14, 2006 Percent of Field and Livestock Workers July 8-14, Percent of Field and Livestock Workers October 7-13, Percent of Field and Livestock Workers Gross Value of Sales Less than $50,000 $50,000-$99,999 $100,000-$249,999 $250,000-$499,999 $500,000-$999,999 $1,000,000 and over Hired Workers: Distribution by Economic Class of Farm, 48 States 1 3 October 8-14, 2006 July 8-14, October 7-13, Percent of Hired Workers Percent of Hired Workers Percent of Hired Workers Category Employed on Farms Hiring 1 Worker 2 Workers 3-6 Workers 7-10 Workers Workers Workers 51 or more Workers 1 48 States, excluding AK and HI. 2 Field and Livestock Workers combined. 3 Excludes Agricultural Service Workers. Hired Workers: Distribution by Category, United States, 1 3 October 8-14, 2006 July 8-14, October 7-13, Percent of Hired Workers Percent of Hired Workers Percent of Hired Workers November 12 NASS, USDA
13 Agricultural Services Agricultural service operations provided 316,000 workers for the Nation's farms and ranches during the week of October 7-13,. Agricultural service workers in California numbered 122,000 this October, up 20 percent from last year. Florida's number of agricultural service workers was 4,000, down 20 percent from last year. The average wages received by agricultural service workers in California and Florida were $10.00 and $9.55 per hour, respectively. Comparable wages in October 2006 were $10.44 in California and $9.90 in Florida. CA FL State Oct 2006 Agricultural Service Workers: Number, Hours Worked, and Wage Rates, for California, Florida, and United States 1 Number of Workers Working on Farms Jul Oct Oct 2006 Hours Worked 2 Jul Oct 1,000 1,000 1,000 Hours Hours Hours * * * * Oct 2006 Dollars per Hour * Wage Rates 2 3 Jul Dollars per Hour Oct Dollars per Hour US *286.0 * * Revised. 1 Data are for Agricultural Services performed on the farm by custom service units such as crew leaders or custom crews. These statistics are not included in the State-Regional tables. 2 United States data not available. 3 Benefits, such as housing and meals, are provided to some workers but the values are not included in the wage rates. November 13 NASS, USDA
14 Northeast I State and Region Hired Workers: Annual Average Number and Hours Worked By Region and United States, Hired Workers Hours Worked ,000 1,000 Hours per Week Hours per Week Northeast II Appalachian I Appalachian II Southeast FL Cornbelt I Cornbelt II Northern Plains Southern Plains Mountain I Mountain II Mountain III CA HI US 3 1 Excludes Agricultural Service Workers. 2 Region map on page Excludes AK. November 14 NASS, USDA
15 Northeast I (CT, ME, MA, NH, NY, RI, VT) Hired Workers: Annual Average Wage Rates By Region and United States, U.S. All Hired Field Field & Livestock and Region Dollars per Hour Dollars per Hour Dollars per Hour 9.70 Dollars per Hour 9.92 Dollars per Hour Dollars per Hour Northeast II (DE, MD, NJ, PA) Appalachian I (NC, VA) Appalachian II (KY, TN, WV) Southeast (AL, GA, SC) FL (MI, MN, WI) Cornbelt I (IL, IN, OH) Cornbelt II (IA, MO) (AR, LA, MS) Northern Plains (KS, NE, ND, SD) Southern Plains (OK, TX) Mountain I (ID, MT, WY) Mountain II (CO, NV, UT) Mountain III (AZ, NM) (OR, WA) CA HI US Excludes Agricultural Service Workers. 2 Excludes AK. 3 Annual rates are averages of the published wage rates for each survey week weighted by the number of hours worked during the week. The annual average for all Regions and the U.S. is based on modeled data for January and survey data for April, July, and October November 15 NASS, USDA
16 Regions Region Northeast I Northeast II Appalachian I Appalachian II Southeast Cornbelt I Cornbelt II Northern Plains Southern Plains Mountain I Mountain II Mountain III States CT, ME, MA, NH, NY, RI, VT. DE, MD, NJ, PA. NC, VA. KY, TN, WV. AL, GA, SC. MI, MN, WI. IL, IN, OH. IA, MO. AR, LA, MS. KS, NE, ND, SD. OK, TX. ID, MT, WY. CO, NV, UT. AZ, NM. OR, WA. November 16 NASS, USDA
17 Definitions The following definitions are provided to assist in interpreting statistics published in quarterly reports. To ensure consistency in data collection, the questionnaires and instruction manual used by the interviewers provide more in-depth explanations of these terms. Farm or Ranch: A place that sells, or would normally sell, at least $1,000 worth of agricultural products during the year. Agricultural Work: Work done on a farm or ranch in connection with the production of agricultural products, including nursery and greenhouse products and animal specialties such as fur farms or apiaries. Also included is work done off the farm to handle farm related business, such as trips to buy feed or deliver products to local market. Hired Worker: Anyone, other than an agricultural service worker, who was paid for at least one hour of agricultural work on a farm or ranch. Worker type is determined by what the employee was primarily hired to do, not necessarily what work was done during the survey week. Type of workers include: Field Workers: Employees engaged in planting, tending and harvesting crops including operation of farm machinery on crop farms. Livestock Workers: Employees tending livestock, milking cows or caring for poultry, including operation of farm machinery on livestock or poultry operations. Supervisors: Hired managers, range foremen, crew leaders, etc. Other Workers: Employees engaged in agricultural work not included in the other three categories. Bookkeepers and pilots are examples. Methods of Pay: All wage rates are calculated based on total wages paid and total hours worked during the survey reference week. Wages paid other than hourly (bi-weekly, monthly, etc.) are converted to an hourly basis prior to summarization. Wages paid by piece rate (per quantity of produce picked, etc.) are also converted to an hourly basis. Perquisites: Benefits, such as cash bonuses, housing, or meals, provided to an employee in addition to pay are included in perquisites. Wage rates published in this release do not include the value of these benefits. Term of Employment: The length of time during the year the farm operator expects to employ those workers who were on the payroll during the survey week. November 17 NASS, USDA
18 Definitions - continued Agricultural Service: Any farm-related service performed on a farm or ranch on a contract or fee basis. This primarily includes activities performed by contract workers on fruit, vegetable, or berry operations. It also includes custom work (see below), veterinarian work, artificial insemination, sheep shearing, milk testing, or any other farm-related activity performed on a farm or ranch on a fee per service basis rather than hourly. Contract Labor: Contract workers are paid by a crew leader, contractor, buyer, processor, cooperative, or other person who has an oral or written agreement with a farmer/rancher. Pruning, thinning, weeding or harvesting of fruit, vegetable or berry crops are examples. A machine is not a part of the service activity provided by the contractor. Custom Work: Work performed by machines and labor hired as a unit. Hay baling, combining, corn or cotton picking, spraying, fertilizing, and laser leveling are examples of custom work when the equipment is included in the service activity. Type of Farm (or Ranch): An operation is classified in the farm type which accounts for the largest portion of the total gross value of sales for its agricultural production. The three types of farms broken out in this publication are: Field Crops: A farm producing wheat, rice, corn, soybeans, barley, dry beans, rye, sorghum, cotton, popcorn, tobacco, or other such crops. Other Crops: A farm producing vegetables, melons, berry crops, grapes, tree nuts, citrus fruits, deciduous tree fruits, avocados, dates, figs, olives, nursery, or greenhouse crops. This category also includes farms producing potatoes, sugar crops, hay, peanuts, hops, mint, and maple syrup. Livestock or Poultry: A farm producing cattle, hogs, sheep, goats, milk, chickens, eggs, turkeys, or animal specialties such as furs, fish, honey, etc. Gross Value of Sales: This includes all income during a year from the sale of crops, livestock, dairy, poultry, or other related agricultural products, including the landlord's share. When commodities are placed under CCC loan, they are considered as sold. November 18 NASS, USDA
19 Reliability of Estimates Survey Procedures: These data were collected by the National Agricultural Statistics Service (NASS) during the last two weeks of October using sampling procedures to ensure every employer of agricultural workers had a chance of being selected. Two samples of farm operators are selected. First, NASS maintains a list of farms that hire farm workers. Farms on this list are classified by size and type. Those expected to employ large numbers of workers are selected with greater frequency than those hiring few or no workers. A second sample consists of segments of land scientifically selected from an area sampling frame. Each June, highly trained interviewers locate each selected land segment and identify every farm operating land within the sample segment's boundaries. The names of farms found in these area segments are matched against the NASS list of farms; those not found on the list are included in the labor survey sample to represent all farms. This methodology is known as multiple frame sampling, with an area sample used to measure the incompleteness of the list. Additionally, a list of agricultural service firms was sampled in California and Florida. The survey reference week was October 7-13,. Reliability: Two types of errors, sampling and non-sampling, are always present in an estimate based on a sample survey. Both types affect the "accuracy" of the estimates. Sampling error occurs because a complete census is not taken. The sampling error measures the variation in estimates from the average of all possible samples. An estimate of 100 with a sampling error of 1 would mean that chances are 19 out of 20 that the estimates from all possible samples averaged together would be between 98 and 102; which is the survey estimate, plus or minus two times the sampling error. The sampling error expressed as a percent of the estimate is called the relative sampling error. The relative sampling error for number of hired workers at the U.S. level is normally less than 5 percent. The relative sampling error for the number of hired workers generally ranged between 9 and 17 percent at the regional level. The U.S. all hired farm worker wage rate had a relative sampling error of 0.8 percent. The relative sampling error was 0.8 percent for the combined field and livestock worker wage rate. Relative sampling errors for the all hired farm worker wage rate generally ranged between 2 and 5 percent at the regional levels. Relative sampling errors for wage rates published by type of farm and economic class of farm generally ranged between 2 and 18 percent at the regional level. Non-sampling errors can occur in a complete census as well as in sample surveys. They are caused by the inability to obtain correct information from each operation sampled, differences in interpreting questions or definitions, and mistakes in editing, coding or processing the data. Special efforts are taken at each step of the survey to minimize non-sampling errors. Revision Policy: Farm labor information is subject to revision the next time the information is published or the year after the original publication date. The basis for revision must be supported by additional data that directly affect the level of the estimate. Worker numbers and wage rates for July and October 2006 were subject to revision with this report. If any revisions were made to previous data, they are reprinted in this report for your information, and they are identified as such. November 19 NASS, USDA
20 Annual Average Estimate Methodology The January Survey was not conducted due to Agency budget constraints. Since the data in all Surveys is tied to a specific reference week, it was not possible to conduct this survey at a later time. In lieu of survey data, January estimates were generated through modeling of historical data and time series analysis. Eighteen years of U.S. and regional quarterly estimates from 1989 through 2006 were used to generate indications of January workers, hours worked, and wages. These indications were then used to set January estimates for the 15 regions, California, Florida, Hawaii, and the U.S. These January estimates were combined with the quarterly estimates from April, July, and October to calculate annual average estimates for. The U.S. and regional annual averages published in this report are for All Hired Wages, Field and Livestock (combined) Wages, and Field Wages. For further information on the methodology which was used to generate the January estimates, please go to the NASS web site at Under Browse NASS by Subject, click on Research and Science. At the bottom of the next screen, click on the link to Research Reports. On the next screen, click on the link to the report titled January Labor Estimates Methodology. November 20 NASS, USDA
21 Index U.S. Hired Workers on Farms, Wage Rates and Hours Worked...3 Number of Workers and Average Hours Worked by Region and U.S. October...4 July...6 October Wage Rates by Region and U.S. October...5 July...7 October Agricultural Services: Workers, Average Hours Worked, and Wages October...13 July...13 October Annual Averages Number of Workers and Average Hours Worked by Region and U.S Hired Worker Wage Rates by Region and U.S...15 Other Labor Estimates U.S. Distribution of Workers...12 Wage Rates by Type of Farm, by Region, State, 48 States...10 Wage Rates by Economic Class of Farm, by Region, State, 48 States...11 Region Map...16 Definitions...17 Reliability of Estimates...19 Revision Policy...19 Annual Average Estimate Methodology...20 Page November 21 NASS, USDA
22 ACCESS TO REPORTS!! For your convenience, there are several ways to obtain NASS reports, data products, and services: INTERNET ACCESS All NASS reports are available free of charge on the worldwide Internet. For access, connect to the Internet and go to the NASS Home Page at: SUBSCRIPTION All NASS reports are available by subscription free of charge direct to your address. Starting with the NASS Home Page at under the right navigation, Receive reports by , click on National or State. Follow the instructions on the screen PRINTED REPORTS OR DATA PRODUCTS CALL OUR TOLL-FREE ORDER DESK: (U.S. and Canada) Other areas, please call FAX: (Visa, MasterCard, check, or money order acceptable for payment.) ASSISTANCE For assistance with general agricultural statistics or further information about NASS or its products or services, contact the Agricultural Statistics Hotline at , 7:30 a.m. to 4:00 p.m. ET, or nass@nass.usda.gov. The U.S. Department of Agriculture (USDA) prohibits discrimination in all its programs and activities on the basis of race, color, national origin, age, disability, and where applicable, sex, marital status, familial status, parental status, religion, sexual orientation, genetic information, political beliefs, reprisal, or because all or a part of an individual s income is derived from any public assistance program. (Not all prohibited bases apply to all programs.) Persons with disabilities who require alternative means for communication of program information (Braille, large print, audiotape, etc.) should contact USDA s TARGET Center at (202) (voice and TDD). To file a complaint of discrimination, write to USDA, Director, Office of Civil Rights, 1400 Independence Avenue, S.W., Washington, D.C , or call (800) (voice) or (202) (TDD). USDA is an equal opportunity provider and employer.