Missouri Dairy Industry Revitalization Study Section 3: Needs Assessment
|
|
|
- Moses Cameron
- 5 years ago
- Views:
Transcription


1 January 2015 Missouri Dairy Industry Revitalization Study Section 3: Needs Assessment
2 Missouri Dairy Industry Revitalization Study Section 3: Needs Assessment The following authors contributed to this section: Joe Horner Alice Roach Hannah McClure Ryan Milhollin Agricultural Economist, Commercial Ag Program, MU Extension Agribusiness and Agrimarketing Consultant Agricultural Economist, Commercial Ag Program, MU Extension Agricultural Economist, Commercial Ag Program, MU Extension Other publications from this study include: Executive Summary A comprehensive overview of the overall Missouri Dairy Industry Revitalization study. Section 1: Historical Perspective Section 1 provides an in-depth discussion about Missouri's dairy industry historical trends concerning its dairy cow inventory, farms, production, prices, production economics and processing industry. Section 2: Economic Contribution Section 2 discusses what the economic contributions such as jobs, value-added and industry sales are from Missouri dairy farms and the Missouri dairy product manufacturing industry. Section 4: Value Chain, Marketing and Processing Section 4 provides a discussion about dairy product demand and current opportunities to enhance the farmer's position in the value chain. Further processing opportunities and dairy niche marketing are discussed in this section. Section 5: Comparative Analysis to Identify Gaps What is the competiveness of Missouri's dairy industry versus other U.S. states? Section 5 seeks to create a common understanding of the Missouri dairy industry's competitive position, benchmark Missouri's dairy industry and environment against other states and look at ways that other states have attempted to revitalize their dairy industries. Complete copies of all publications can be found at For further information about this report, please contact: Joe Horner - (573) (phone) or HornerJ@missouri.edu ( )
3 The Missouri Dairy Industry Revitalization Study Section 3: Needs Assessment Table of Contents 1. PRODUCER SURVEY: LOCATIONS, AGE, LAND USE & EXPANSION PLANS Survey Respondents Age & Land Use Producer Expansion Plans PRODUCER SURVEY: PRODUCER NEEDS Dairy Producers Identify Greatest Need Dairy Producers Identify Greatest On-Farm Challenges Dairy Producers Rate the State of Dairy Infrastructure in Missouri Dairy Producers Rank Training and Information Needs Dairy Producers Rank Preferred Information Sources DAIRY FARM CHARACTERISTICS Herd Size Rolling Herd Average Somatic Cell Count Milking System Use of Grazing Cow Housing Manure & Nutrient Management System INDUSTRY STAKEHOLDER SURVEY Respondent Stakeholder Characteristics Stakeholder View Infrastructure Quality Stakeholder View Information Use and Needs Stakeholder View Industry Needs and Greatest Challenges... 33


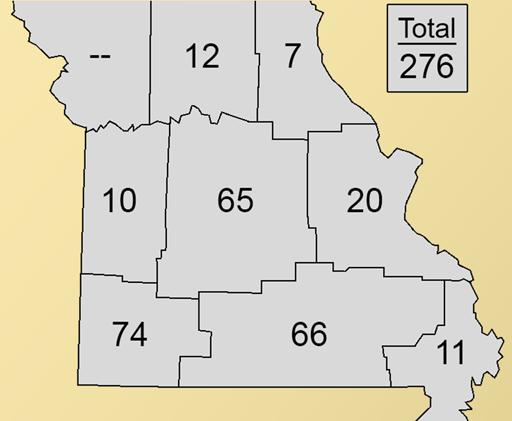
4 1. Producer Survey: Locations, Age, Land Use & Expansion Plans During fall 2014, the University of Missouri Commercial Agriculture Program conducted an 18- question survey of Missouri dairy producers to gather their perspectives about needs associated with strengthening the state s dairy industry. Surveys were mailed to all 875 Grade A dairy producers currently permitted by the Missouri State Milk Board. Producers had about one month to complete and return the survey. As an alternate method to reach producers, the Commercial Agriculture Program team encouraged producers attending 13 USDA Margin Protection Program meetings to complete the survey on site or online. This section summarizes all responses submitted. 1.1 Survey Respondents In total, 276 Missouri dairy producers responded to the survey developed for this study. Survey responses represent 32 percent of the survey population. Agricultural statistics districts with the most producers responding to the survey were the southwest district, 74 respondents; south central district, 66 respondents; and central district, 65 respondents. Exhibit shares the number of respondents from Missouri agricultural statistics districts, which the USDA National Agricultural Statistics Service defines. Note that no dairy producers in the northwest district participated. Response rates by district roughly represent the geographic distribution of Missouri dairy operations. Exhibit Number of Respondents by Missouri Agricultural Statistics District 1
5 1.2 Age & Land Use By age, more dairy producers responding to the survey were in their 50s than the other age categories provided. Respondent age averaged 51.5, and 107 respondents shared that they were 50- to 59-year-olds. Exhibit illustrates the distribution of dairy producers by age category. The survey question asked respondents to provide their current age when they completed the survey. Fifty respondents noted being in their 60s, 44 respondents shared that they were in their 40s, and 40 respondents indicated being in their 30s. Fewer participants were in their 20s, 70s and 80s. Exhibit Age Distribution of Survey Respondents (N = 265) Number of Responses Regarding respondents land use, the average respondent owned and operated acres. Of the total acreage, producer-respondents on average maintained acres in corn silage, acres in alfalfa, acres in other hay or haylage and acres for grazing both cows and heifers. 1.3 Producer Expansion Plans Age in Years Of the producer-respondents who shared five-year plans for their dairy operations, the greatest number indicated that they planned to continue to produce at the same level. About 44 percent of respondents shared that they plan to continue operating at the same level. However, several indicated that they would discontinue milking, downsize or expand their operations. Exhibit presents the survey respondents plans for their dairy operations in the next five years. Thirty-four respondents, or 13.2 percent of those responding, shared that they would discontinue milking, and nine respondents, or 3.5 percent of those responding, indicated that they plan to downsize. Based on the survey responses, some producers are considering growth. Of the respondents answering this question, 101 producers, or 39.3 percent, indicated that they re planning to expand. Of those suggesting that they may expand, most plan to grow 10 percent to 50 percent. However, 18 2
6 respondents shared that they re planning for more than 50 percent growth, and another 18 respondents indicated that they plan to expand by less than 10 percent. Exhibit Producers Dairy Farm Plans for the Next Five Years (N = 257) Number of Responses Discontinue milking Downsize Continue at same level Expand <10% Expand 10-50% Expand >50% Like other responses included in this survey summary, producers in different Missouri districts also have varying five-year plans for their operations. See Exhibit Within the next five years, the greatest share of central district respondents plan to continue operating at the same level. The north central, northeast, south central, southeast and southwest districts also had the greatest share of their respondents indicating that they plan to continue producing at the same level. In the west district, a majority of the survey respondents shared that they have plans to expand their operations by 10 percent to 50 percent in the next five years. In the east district, the share of producers indicating that they plan to continue producing at the same level was equivalent to the share of respondents that noted plans to expand their operations by 10 percent to 50 percent. In the central, east, south central, southwest and west districts, at least 10 percent of the respondents from each respective district noted that they plan to stop milking in the next five years. A relatively low share in all districts shared that they plan to downsize their dairies. Of the producers that indicated that they plan to expand, the greatest share of respondents in all districts but the southeast district indicated that they d most likely expand by 10 percent to 50 percent. In the southeast, 18.2 percent of the respondents said that they planned to expand by less than 10 percent, and the same share indicated that they planned to increase their operations by 10 percent to 50 percent. 3
7 Exhibit Producers Dairy Farm Plans for the Next Five Years by District* Central East North Central Northeast South Central Southeast Southwest West State Average Discontinue milking 13.8% 15.8% 0.0% 0.0% 17.5% 9.1% 11.6% 11.1% 13.2% Downsize 1.5% 5.3% 0.0% 0.0% 4.8% 0.0% 4.3% 0.0% 3.5% Continue at same level 43.1% 36.8% % 38.1% 45.5% % 44.0% Expand <10% % 0.0% 0.0% 7.9% 18.2% 5.8% 11.1% 7.0% Expand 10-50% 29.2% 36.8% 27.3% 33.3% 22.2% 18.2% 18.8% 55.6% 25.3% Expand >50% 4.6% 0.0% 0.0% % 9.1% % 7.0% * N = 65 for central district; N = 19 for east district; N = 11 for north central district; N = 6 for northeast district; N = 63 for south central district; N = 11 for southeast district; N = 69 for southwest district; and N = 9 for west district. 4
8 2. Producer Survey: Producer Needs The following sections share producer-respondents thoughts about the state of the Missouri dairy industry, and they highlight dairy industry needs identified by producers responding to the survey. 2.1 Dairy Producers Identify Greatest Need The survey presented two open-ended questions to identify needs and challenges that affect Missouri dairies. Coding the open-ended responses involved combining responses into similar categories and including one response from each producer. When producers shared multiple responses, the coding method averaged the responses. For example, if both Producer 1 and Producer 2 listed A and B as responses, then the coding process assigned A to Producer 1 and B to Producer 2. Exhibit shares the top 10 responses, not all responses, to the question that asked survey participants to share needs that would make them more successful. Of all responses collected to this question, the top need identified based on number of responses was higher milk prices and profit margins. By earning more revenue and profit, producers may have improved opportunities to be successful. Needs that ranked as the second to fourth most important based on number of responses were more dairy infrastructure, more competitive milk markets and options to manage heat stress and other production-related issues. The other six items included in the top 10 needs based on number of responses were quality forages, increased labor, more available capital, less regulation, favorable weather and better business management. Exhibit What do Dairy Producers Need to be More Successful?* Number of Responses Higher milk prices & profit margins More dairy infrastructure More competitive milk markets Manage heat stress & other production issues * Total N = 181 responses; chart presents just responses for the top 10 needs based on number of responses. Quality forages Increased labor More available capital Less regulation Favorable weather Better business management 5
9 2.2 Dairy Producers Identify Greatest On-Farm Challenges Like in the previous question, respondents also had an opportunity in an open-ended format to share the greatest challenge that they face on their dairy farms. Coding the responses uncovered several category themes. Exhibit shares the top 10 greatest challenges, not necessarily all greatest challenges shared by the respondents, based on the number of responses that shared each challenge. Based on number of responses, respondents significantly identified that labor was the greatest challenge that they must address. More than twice as many respondents identified labor as their greatest challenge relative to the number of respondents that named the challenge that ranked second, which was animal health. The other challenges shared in the top 10 list had a somewhat similar number of responses. The three remaining challenges ranked in the top five based on number of responses were forage issues, weather and input costs. Of the challenges listed in the top 10, the fifth to 10th greatest challenges based on number of responses were time management, profit margins, other production issues, access to land and capital and farm infrastructure needs. Exhibit What are Dairy Producers Greatest Challenges?* Number of Responses Labor Animal health Forage issues * Total N = 207 responses; chart presents just responses for the top 10 needs based on number of responses. Weather Input costs Time management Profit margins Other production issues Access to land & capital Farm infrastructure needs 2.3 Dairy Producers Rate the State of Dairy Infrastructure in Missouri Using a five-point scale, producers were asked to rate their perceptions of dairy infrastructure quality in their areas. To interpret the scoring, higher scores, such as 4 and 5 scores, indicate poorer 6
10 infrastructure quality, and lower scores, such as 1 and 2 scores, indicate better infrastructure quality. Exhibit summarizes producer-respondents thoughts about nine dairy infrastructure resources. On average, respondents assigned the highest rating to manure/lagoon spreading contractors. Based on the 3.06 average score, respondents on average think that this infrastructure component could be better. Of the nine infrastructure components evaluated in the survey, manure/lagoon spreading contractors also received the highest proportion of 5 scores, indicating that this infrastructure factor is a big problem now, and it received the smallest share of excellent ratings. The other infrastructure resources receiving the highest average scores thus, indicating possible problem areas were dairy quality forage contractors, which scored 2.88 on average, and dairy equipment sales and service, which scored 2.61 on average. Infrastructure components with the lowest average scores were milk hauling, which scored 1.85 on average, and general farm supplies and fertilizer, which scored 1.93 on average. Low scores indicate that the quality of the particular infrastructure resource is excellent or OK. Dairy infrastructure resources receiving the greatest share of excellent ratings were milk hauling, veterinary service with dairy expertise and general farm supplies and fertilizer. Those generating the greatest share of OK responses were general farm supplies and fertilizer, extension dairy advice and cooperative field service. In the could be better category, dairy quality forage contractors, manure/lagoon spreading contractors, dairy nutrition/ration consulting and dairy equipment sales and service infrastructure categories received the greatest share of 3 scores. As a group, the respondents shared that they worry most that dairy equipment sales and service and manure/lagoon spreading contractors may become problems in the future, based on the share of 4 scores awarded to them. The two infrastructure resources receiving the greatest share of big problem now ratings were the manure/lagoon spreading contractors and dairy quality forage contractors. Exhibit lists dairy infrastructure resources by the share of combined 4 and 5 scores assigned by respondents, so resources listed high in the chart had the greatest shares of 4 and 5 scores and, thus, were recognized as being more problematic. Manure/lagoon spreading contractors, dairy equipment sales and service and dairy quality forage contractors had the greatest share of combined 4 and 5 scores assigned. 7
11 Exhibit Dairy Infrastructure Quality Ratings in Respondents Areas* Manure/lagoon spreading contractors Dairy equipment sales and service Dairy quality forage contractors Veterinary service with dairy expertise Dairy nutrition/ration consulting 5% 6% 16% 19% 30% 3 31% 35% 42% 3 36% 43% 28% 1 29% 1 1 8% 1 12% 5% 6% 5% Average Extension dairy advice 21% 5 16% 6% 3% 2.18 Milk hauling 41% 42% 8% 1% 1.85 Cooperative field service 22% 49% 23% 3% 3% 2.16 General farm supplies and fertilizer 29% 56% 10% 1% % 20% 40% 60% 80% 100% 1- Excellent 2- Ok 3- Could be better 4- Worried about future 5- Big problem now * N = 270 for veterinary service with dairy expertise; N = 268 for dairy equipment sales and service; N = 266 for dairy nutrition/ration consulting; N = 236 for dairy quality forage contractors; N = 221 for manure/lagoon spreading contractors; N = 266 for milk hauling; N = 259 for cooperative field service; N = 270 for general farm supplies and fertilizer; and N = 262 for extension dairy advice. Based on an average rating of scores for all nine infrastructure components in each district, the northeast and central districts reported the lowest aggregate average ratings at 1.94 and 2.12, respectively, which indicates that respondents in these districts were most satisfied with the dairy infrastructure quality in their areas. Aggregate rating averages were highest in the southeast and west districts at 2.76 and 2.69, respectively, which indicate greater concern about the dairy infrastructure quality in these districts. See Exhibit By district, the survey data indicate some slight differences in perceived dairy infrastructure quality in various areas. This discussion shares the three infrastructure resources with the highest average scores in each district. Note that a higher score indicates the perception that the given resource has poorer quality. Central, northeast and west district respondents on average indicated that manure/lagoon spreading contractors, dairy quality forage contractors and dairy equipment sales and service were the most problematic infrastructure resources in that order. In the north central district, respondents ranked manure/lagoon spreading contractors as the most problematic infrastructure resource on average, and dairy equipment sales and service and dairy quality forage contractors tied for ranking second based on average scores assigned. For respondents in the east and south central districts, infrastructure resources receiving the highest ratings were dairy quality forage contractors followed by manure/lagoon spreading contractors and dairy equipment sales and service. 8
12 The other two districts had slightly more variability in their most concerning dairy infrastructure resources. In the southeast district, respondents assigned highest ratings on average to manure/lagoon spreading contractors, dairy equipment sales and service and veterinary service with dairy expertise. Southwest district respondents shared that manure/lagoon spreading contractors, dairy quality forage contractors and dairy nutrition/ration consulting were resources of most concern based on their average scores. Respondents tended to be least concerned about two main infrastructure resources. In the central, north central, south central, southeast and southwest districts, respondents awarded the lowest scores on average to milk hauling. Respondents from the east and west districts assigned the lowest average scores to general farm supplies and fertilizer. The northeast district was the exception. On average, respondents assigned the lowest score to veterinary service with dairy expertise. 9
13 Exhibit Dairy Infrastructure Quality Ratings in Respondents Areas by District Central East North Central Northeast South Central Southeast Southwest West State Average Veterinary service with dairy expertise Dairy equipment sales and service Dairy nutrition/ration consulting Dairy quality forage contractors Manure/lagoon spreading contractors Milk hauling Cooperative field service General farm supplies and fertilizer Extension dairy advice * 1 signifies excellent, 2 signifies OK, 3 signifies could be better, 4 signifies worried about future, and 5 signifies big problem now. 10
14 2.4 Dairy Producers Rank Training and Information Needs Regarding the training and information topics that Missouri producers describe needing, Exhibit lists various topics and respondent attitudes about information and training needs on those topics. The chart organizes topics based on the combined share of four and five scores awarded to them by respondents. On a one-to-five scale, assigning a five to a given topic indicated that it is a high priority. Assigning one point indicated that the given topic is not an information or training priority. Those listed at the top of the chart had a greater combined share of four or five scores awarded than those listed at the bottom of the chart. The topics receiving the greatest share of combined four and five scores were reproductive management, 61.9 percent of scores were a four or five; mastitis prevention and treatment, 60 percent of scores were a four or five; and forage quality improvement, 59.9 percent of scores were a four or five. Because these three topics received the greatest combined share of four and five scores, respondents view these topics as the most significant information and training priorities. These three topics also averaged the highest score when calculating the mean score provided by producers responding to each question component. Of the 23 topics from which respondents could choose, others ranked in the top 10 based on the share of combined four and five scores awarded were heat stress; calf feeding and young stock management; financial and business management; basic nutrition; milk and feed price risk management; vaccination, herd health and treatment; and feed mixing/ration formulation. The three topics with the smallest share of combined four and five scores were bedding, manure handling equipment and housing and ventilation. 11
15 Exhibit Dairy Producers Views of Training and Information Topic Needs* Reproductive management 5% 9% 2 36% 26% Average 3.69 Mastitis prevention and treatment 5% 28% 3 26% 3.69 Forage quality improvement 6% 28% 41% 19% 3.61 Heat stress 10% 31% 31% Calf feeding and young stock management 5% 9% 31% 36% 19% 3.54 Financial and business management 9% 9% 29% 31% 22% 3.47 Basic nutrition 10% 31% 35% 16% 3.44 Milk and feed price risk management 13% 9% 28% 33% 18% 3.34 Vaccination, herd health and treatent 13% 31% 30% 20% 3.43 Feed mixing/ration formulation 9% 11% 30% 32% Farm succession planning 13% 13% 26% 26% 22% 3.31 Feed and forage systems 5% 10% 38% 32% Labor management 16% 12% 30% 2 18% 3.17 Energy Savings 8% 15% 35% 26% 15% 3.26 Herd Record Keeping 10% 18% 31% 28% 13% 3.16 Water availability 13% 18% 30% 23% 15% 3.10 Feed and forage contracting 13% 1 35% 28% 11% 3.10 Nutrient management plans 12% 16% 36% 23% 13% 3.09 Parlor renovation 1 20% 33% 2 10% 2.97 Value-added product processing 1 18% 32% 18% 15% 2.96 Housing and ventilation 16% 20% 3 22% 8% 2.86 Manure handling equipment 13% 21% 38% 18% 10% 2.90 Bedding 16% 26% 39% 15% % 20% 40% 60% 80% 100% 1- Not a priority High priority * N = 249 for basic nutrition; N = 244 for feed mixing/ration formulation; N = 244 for feed and forage contracting; N = 247 for forage quality improvement; N = 243 for feed and forage systems; N = 247 for calf feeding and young stock management; N = 250 for mastitis prevention and treatment; N = 247 for reproductive management; N = 246 for vaccination, herd health and treatment; N = 248 for housing and ventilation; N = 247 for bedding; N = 246 for energy savings; N = 248 for water availability; N = 245 for heat stress; N = 246 for parlor renovation; N = 244 for herd record keeping; N = 245 for farm succession planning; N = 245 for financial and business management; N = 245 for labor management; N = 246 for milk and feed price risk management; N = 242 for value-added product processing; N = 252 for manure handling equipment; and N = 248 for nutrient management plans. 12
16 Based on an average priority score provided by respondents in a given district, the information or training topics identified as the highest priorities vary fairly widely by district. See Exhibit Three topics ranked as first or tied for the highest average in two districts: mastitis prevention and treatment in the central and east districts, reproductive management in the south central and southeast districts and energy savings in the northeast and southeast districts. Note that reproductive management and energy savings tied for first in the southeast district. Heat stress in the central district tied with mastitis prevention and treatment as the top information and training topic priority, and bedding tied for first with energy savings among northeast district respondents. Respondents in the north central district identified forage quality improvement as the top priority. Milk and feed price risk management averaged the highest score among the southwest district respondents, and financial and business management ranked as the top priority in the west district. Based on average scores, the following list shares other information and training topics identified as high priorities by district: forage quality improvement and reproductive management, central district; calf feeding and young stock management and reproductive management, east district; water availability and feed mixing/ration formulation, north central district; reproductive management and feed and forage systems, northeast district; calf feeding and young stock management and forage quality improvement, south central district; mastitis prevention and treatment and forage quality improvement, southeast district; reproductive management and mastitis prevention and treatment, southwest district; and farm succession planning, reproductive management and vaccination, herd health and treatment, west district. 13
17 Exhibit Dairy Producers Views of Training and Information Topic Needs by District Central East North Central Northeast South Central Southeast Southwest West State Average Basic nutrition Feed mixing/ration formulation Feed and forage contracting Forage quality improvement Feed and forage systems Calf feeding and young stock management Mastitis prevention and treatment Reproductive management Vaccination, herd health and treatment Housing and ventilation Bedding Energy savings Water availability Heat stress Parlor renovation Herd record keeping Farm succession planning Financial and business management Labor management Milk and feed price risk management Value-added product processing Manure handling equipment Nutrient management plans * 1 signifies not a priority, and 5 signifies a high priority. 14
18 2.5 Dairy Producers Rank Preferred Information Sources On a scale from one to five, the survey requested that respondents indicate their use of several information sources. By assigning five points, producers suggested that the information source has a lot of value, and by assigning one point, they indicated that the information source has no value. Exhibit presents the share of respondents assigning one, two, three, four or five points for each information source, and it averages the scores for each source to estimate an overall average point rating. The chart ranks information sources by their total percentage of combined four and five scores. Using this criterion, at least 50 percent of respondents rated four information sources with a four or five score: veterinarians, 75.4 percent of respondents provided a four or five score; other dairy producers, 60.2 percent of respondents provided a four or five score; University of Missouri Extension, 57.3 percent of respondents provided a four or five score; and nutrition consultants, 56 percent of respondents provided a four or five score. Based on the average ratings for information source use, the respondents regarded veterinarians, other dairy producers, nutrition consultants and University of Missouri Extension as information sources that have the most value. Information sources with the lowest average ratings were podcasts, social media such as Facebook and Twitter and webinars. 15
19 Exhibit Dairy Producers Preferred Information Sources* Veterinarians 2% 18% 38% 38% Average 4.05 Other dairy producers 3% 9% 28% 36% University of Missouri Extension 3% 13% 26% 38% 19% 3.56 Nutrition consultants 5% 10% 29% 29% Associations (breed, DHIA, MDA) 1 16% 21% 28% 21% 3.28 Magazines 9% 9% 33% 30% 19% 3.41 Dairy cooperative fieldmen 8% 13% 3 29% Internet websites or searches 22% 11% 2 28% 16% 3.04 Newsletters (print or electronic) 10% 9% 40% 26% Industry vendors 22% 36% 2 10% 3.07 Missouri Dairy Resource Website (MU) Social media (e.g., Facebook, Twitter) 18% 40% 1 31% 21% 23% 22% 13% 12% Webinars 35% 20% 32% 11% 2% 2.30 Podcasts 48% 2 20% 5% 3% % 20% 40% 60% 80% 100% 1- No value A lot of value * N = 234 for University of Missouri Extension; N = 256 for veterinarians; N = 243 for nutrition consultants; N = 229 for industry vendors; N = 253 for dairy cooperative fieldmen; N = 249 for other dairy producers; N = 183 for Missouri Dairy Resource Guide Website (MU); N = 234 for newsletters (print or electronic); N = 246 for magazines; N = 182 for social media; N = 214 for associations; N = 164 for webinars; N = 187 for Internet websites or searches; and N = 153 for podcasts. Based on average ratings, respondents in the central, east, south central, southeast, southwest and west districts all agreed that veterinarians provide the most value as an information source. See Exhibit Respondents in two districts the north central and northeast identified a source other than veterinarians as having the most value based on their average sources. On average, north central district respondents identified that other dairy producers had the most value as an information source, and northeast district respondents identified that industry vendors were the most valuable information source. Other top information sources valued by producer-respondents had some variability by district. Exhibit illustrates that variability. However, respondents in at least six of the eight districts contributed to an average score for the following sources that ranked the sources in the top four of those used in the respective district or tied for being in the top four: University of Missouri Extension, veterinarians, nutrition consultants and other dairy producers. 16
20 Exhibit Dairy Producers Use of Information Sources by District North Central East Northeast Central South Central Southeast Southwest West State Average University of Missouri Extension Veterinarians Nutrition consultants Industry vendors Dairy cooperative fieldmen Other dairy producers Missouri Dairy Resource website (MU) Newsletters (print or electronic) Magazines Social media (e.g., Facebook, Twitter) Associations (breed, DHIA, MDA) Webinars Internet websites or searches Podcasts * 1 signifies no value, and 5 signifies a lot of value. 17
21 3. Dairy Farm Characteristics The following sections detail producer-respondents dairy farm characteristics. This section summarizes herd size, rolling herd averages, somatic cell counts, milking systems, housing systems, using of grazing and nutrient management systems. 3.1 Herd Size Most commonly, producers responding to the survey indicated that they maintained a 50-cow to 99- cow herd size. Of the 265 survey respondents answering this question, 112 shared that their dairy cow inventory ranged from 50 cows to 99 cows. Exhibit shares the number of respondents by their milking cow herd size. The survey requested that respondents include milking cows and dry cows in the herd size data that they reported. Seventy-nine respondents shared that their milking cow herd ranged from 100 cows to 249 cows, and 56 respondents indicated that they had fewer than 50 milking cows. Few dairy producer-respondents, 18 total, maintained at least 250 milking cows. Exhibit Respondents Milking Cow Herd Size (N = 265) Number of Responses Less than , Rolling Herd Average The milk production rolling herd average data shared in Exhibit indicate that this measure varies widely among respondents. The pie chart indicates the share of respondents reporting various milk production rolling herd averages in pounds per cow per year. Seventeen percent of producers responding to this question indicated that their milk production rolling herd averages didn t exceed 13,000 pounds per cow per year, and 14 percent reported milk production rolling herd averages that were at least as high as 22,000 pounds per cow per year. Relatively similar shares of respondents reported milk production rolling herd averages that fit in the other categories: 13,000 to 16,000 pounds per cow per year, 22 percent of respondents; 16,000 to 19,000 pounds per cow per year, 24 percent of respondents; and 19,000 to 22,000 pounds per cow per year, 23 percent of respondents. 18
22 Exhibit Milk Production Rolling Herd Averages at Respondents Dairies, Pounds per Cow per Year (N = 247) 25,000 28,000 3% 28,000 or more 1% Less than 10,000 3% 22,000 25,000 10% 10,000 13, ,000 22,000 23% 13,000 16,000 22% 16,000 19, Somatic Cell Count Somatic cell count also varied widely among survey respondents, and it had geographic effects, too. Exhibit illustrates that somatic cell count reported by producers responding to the question averaged 251,864. However, notice the extent to which somatic cell count varied depending on the agricultural statistics district. Based on the survey data, somatic cell count tended to be highest in the southeast and west agricultural statistics districts. In both of these districts, somatic cell counts averaged more than 300,000, and their averages exceeded the state average. The somatic cell count average for the southwest district also exceeded the state average. Producer-respondents from the north central agricultural statistics district by far reported the lowest somatic cell counts, which averaged less than half of levels reported as averages in the southeast and west districts. Other agricultural statistics districts with somatic cell counts that averaged lower values than the state average were the northeast, central, east and south central districts. Although these data give indications of possible somatic cell count problem areas, note that some districts included relatively few data points in their averages. For example, the northeast, north central, west and southeast districts all had 10 or fewer responses included in their averages. 19
23 Exhibit Average Somatic Cell Count in Respondents Herds (N = 257)* Ag District SCC # of Responses Central 226, East 239, North Central 149,444 9 Northeast 218,571 7 South Central 241, Southeast 338, Southwest 284, West 302,222 9 State Average 251, * Not all respondents indicated their location, thus the sum of the eight ag district responses is less than the state average total of Milking System Among the producers who reported the milking system that they use, most shared that they use a herringbone parlor. Exhibit illustrates the percentage of respondents that use various milking systems. Sixty percent of respondents shared that they have a herringbone parlor design. Of the respondents indicating the milking systems that they use, 18 percent reported that they use a parallel parlor, and 11 percent indicated that they use a swing/parabone parlor. Just 1 percent of the respondents shared that they use a carousel or rotary milking system. Ten percent of respondents noted that they use another type of milking system. Some of the more popular other responses included bypass milking systems, walk-through milking systems and flat-style milking systems. Two respondents shared that they use robotic systems. Exhibit Milking Systems Used by Respondents (N = 241) Swing/parabone parlor 11% Carousel/rotary 1% Other 10% Parallel parlor 18% Herringbone parlor 60% 20
24 3.5 Use of Grazing Production practices varied among producers responding to this project s survey. Exhibit shares the number of respondents that reported using grazing for various purposes and at various levels. For the most part, Missouri dairy producers integrate at least some grazing into their production practices. Just 10 respondents noted that they use no grazing on their operations. Many producers, 101 respondents in total, shared that they ve adopted moderate grazing use on their dairy operations. A smaller group, 62 respondents, reported using intensive grazing practices. Forty-seven respondents shared that they use minimal grazing on their dairies, and 45 respondents reported that they only graze their operations heifers. Exhibit Grazing Use at Respondents Dairy Operations, Missouri (N = 265) No grazing in my operation Grazing heifers only Minimal grazing Moderate grazing Number of Responses Intensive grazing The extent of grazing use in dairy production has some differences among varying Missouri agricultural statistics districts. Exhibit lists the share of respondents from each district that use grazing practices for their dairies to various extents. Based on the survey responses, the southeast, east and northeast districts had the greatest share of producers reporting that they don't use grazing in their operations. The southeast and northeast districts had the greatest share of producers who exclusively graze their heifers. Intensive grazing had the highest penetration rates in the north central, west and southwest districts as 41.7 percent, 33.3 percent and 31.5 percent of respondents from each respective district reported using intensive grazing practices. In the south central, southwest, north central and west districts, at least two-thirds of producer-respondents indicated that they use moderate or intensive grazing. In the central district, 68.8 percent of respondents used minimal or moderate grazing for their dairy operations. 21
25 Exhibit Grazing Use at Respondents Dairy Operations by Missouri Agricultural Statistics District Central East North Central Northeast South Central Southeast Southwest West State Average No grazing in my operation 0.0% 15.0% 0.0% 14.3% 1.6% 18.2% 4.1% 0.0% 3.8% Grazing heifers only 20.3% 35.0% % 14.1% 45.5% 6.8% 11.1% 17.0% Minimal grazing 31.3% 25.0% % 7.8% 9.1% % 17. Moderate grazing 37.5% 15.0% 25.0% 0.0% % 43.8% 33.3% 38.1% Intensive grazing 10.9% 10.0% % 28.1% 0.0% 31.5% 33.3% 23. * N = 64 in central district; N = 20 in east district; N = 12 in north central district; N = 7 in northeast district; N = 64 in south central district; N = 11 in southeast district; N = 73 in southwest district; and N = 9 in west district. 22
26 3.6 Cow Housing With regard to the animal housing used on respondents dairy operations, the greatest share of respondents reported using no housing or open-air housing. See Exhibit Of the producers responding to this question, 47 percent shared that they use no housing or open-air housing. Free stall housing was also popular as 36 percent of respondents reported using this type of housing, and just 12 percent of respondents indicated that they use a compost or bedding system. A few producers, representing 5 percent of those answering the question, shared that they use other types of animal housing. Other responses included grazing, tie-stall configurations, straw bedding, pack bedding and other types of barn housing. Exhibit Type of Animal Housing Used by Survey Respondents (N = 262) Other 5% None or open air 4 Free stall 36% Compost/Bedding system 12% Exhibit lists the share of respondents from each district that use different housing systems for their dairies. Based on the survey responses, the east, northeast and north central districts used free stall barns the most. Respondents from the south central, west and southwest districts reported using free stalls the least. Compost bedding systems were most popular in the southeast, west and northeast districts. The south central district, which is the traditional heart of Missouri s dairy industry, reported using the least housing of any district. Likely, this is due to the area s gravelly welldrained soils and smaller herds. At least half of respondents from the southwest and west districts also reported using no housing or open-air housing. 23
27 Exhibit Housing Systems at Respondents Dairy Operations by Missouri Agricultural Statistics District Central East North Central Northeast South Central Southeast Southwest West State Average Free stall 49.2% % 57.1% 15.6% 45.5% 29.2% 20.0% 35.9% Compost/bedding system % 18.2% 28.6% % 30.0% 12.2% None or open air 36.5% 10.5% 9.1% 0.0% % 58.3% 50.0% 46.2% Other 1.6% 5.3% 18.2% 14.3% 1.6% 9.1% 6.9% 0.0% 5. * N = 63 in central district; N = 19 in east district; N = 11 in north central district; N = 7 in northeast district; N = 64 in south central district; N = 11 in southeast district; N = 72 in southwest district; and N = 10 in west district. 24
28 3.7 Manure & Nutrient Management System To manage manure at their farms, survey respondents use different practices. Exhibit presents the share of respondents that indicated using several manure handling practices. Based on these data, the greatest share of respondents store manure in lined structures such as concrete pits or slurry systems, or they pile manure on the ground or a slab. Twenty percent of respondents indicated that they store manure in an unlined storage basin, and 13 percent shared that they directly put manure in a spreader or that they daily spread manure. A few producers have adopted management practices other than these four options. For example, two respondents mentioned composting manure. The average time that producers store livestock manure varies significantly depending on the management practices used. Respondents that pile livestock manure on the ground or a slab tend to store the manure for about 77 days on average. Those who store livestock manure in an unlined storage basin on average store the manure for 264 days, and those who store it in lined structures tend to store the manure for 101 days on average. For producers who have adopted other manure management practices, they store livestock manure for 94 days on average. Exhibit Respondents Use of Livestock Manure Management Practices (N = 266) Store manure in lined structure (concrete pit, slurry system, etc.) 33% Other 3% Store in unlined manure storage basin 20% Pile manure on the ground or a slab 31% Put manure directly into the spreader and/or spread daily 13% For the most part, Missouri dairy producers responding to the survey shared that they don t assess the nutrient content of their farms livestock manure. Exhibit illustrates respondents actions toward assessing the nutrient content of manure. Of the respondents answering this question, 126 shared that they don t assess manure nutrient content or take nutrient credit. Seventy-six producers noted that they don t assess manure nutrient content, but they do use book values. Sixty-one respondents indicated that they do assess manure nutrient content, and of those, 54 percent assess the livestock manure nutrient content, but they conduct tests less frequently than each year. Fortysix percent of those assessing the nutrient content shared that they conduct annual tests. 25
29 Exhibit Respondents Attitudes toward Manure Nutrient Assessment (N = 263) Number of Responses Yes, by testing yearly Yes, by testing less frequently No, I use book values No, I don t take nutrient credit Based on the survey data, most Missouri dairy producers don t have a written nutrient plan for their farms. Exhibit presents the number of survey respondents who have created a written nutrient plan. Of the 262 producers responding to this question, 174 respondents, or 66.4 percent, shared that they don t have a written nutrient plan. Twenty-one percent of the respondents, or 55 individuals, noted that they did have a written nutrient plan, and 12.6 percent, or 33 individuals, shared that they were unsure whether they had a written plan. Exhibit Number of Respondents with Written Nutrient Plan for Farm (N = 262) Number of Responses Yes No Unsure 26
30 4. Industry Stakeholder Survey During fall 2014, the Commercial Agriculture Program at the University of Missouri also administered a seven-question dairy industry survey directed at stakeholders that support the state s dairy industry. The survey s purpose was to gather stakeholders perspectives about Missouri dairy industry needs and revitalizing the industry. To conduct the survey, the Commercial Agriculture Program included stakeholders such as veterinarians, dairy cooperative representatives, vendors and consultants. Such stakeholders could participate in the survey by attending dairy meetings and completing the survey on site or online. Alternatively, stakeholders receiving the Missouri Dairy Business Update monthly electronic newsletter also had the opportunity to participate in the survey. The newsletter is distributed to 435 dairy producers and stakeholders. Personalized survey invitations were ed to key stakeholders. 4.1 Respondent Stakeholder Characteristics Thirty-one dairy industry stakeholders responded to the survey. Exhibit shares the roles that the respondents assume to support the industry. Dairy cooperative fieldmen represented 23 percent of the respondents. Veterinarians and industry vendors each represented 19 percent of the respondents. Nutrition consultants represented just 7 percent of the respondents. The other category includes respondents that were industry inspectors, regulatory personnel and lenders. Exhibit Role of Dairy Stakeholder Survey Respondents (N = 31) Other 32% Dairy cooperative fieldmen 23% Veterinarian 19% Nutrition consultant Industry vendor 19% In the stakeholder survey, respondents also could share the geographic area that they represent within Missouri. Six respondents, or 19.4 percent of all 31 stakeholders participating in the stakeholder survey, noted that they serve all Missouri counties or regions or they serve the dairy industry statewide. Two respondents indicated that they serve most of the state. The remaining respondents had more variability in their coverage areas. 27
31 4.2 Stakeholder View Infrastructure Quality Of the dairy stakeholders that participated in the survey, they for the most part didn't overwhelmingly identify infrastructure resources that were big problems now. Just 6.9 percent of the stakeholders responding shared that they thought dairy equipment sales and service and dairy quality forage contractors were big problems now, and these two resources had the highest shares of big problem now responses. Extension dairy advice, cooperative field service and veterinary service with dairy expertise categories reported smaller shares of big problem now responses. To share thoughts about dairy infrastructure, the survey prompted stakeholders to assign a one-tofive score for each infrastructure variable shared in Exhibit Higher values, such as four and five ratings, indicate worse infrastructure quality. Infrastructure components receiving the greatest share of combined four and five scores were dairy equipment sales and service, 41.4 percent of respondents assigned a four or five; manure/lagoon spreading contractors, 25 percent of respondents assigned a four or five; and milk hauling, 24.1 percent of respondents assigned a four or five. The exhibit also shares average scores, which represent the mean score computed for a given infrastructure resource. Those with the highest average scores were dairy equipment sales and service, manure/lagoon spreading contractors and dairy quality forage contractors. Note that no stakeholders gave dairy quality forage contractors an excellent rating, denoted by a 1 score. Infrastructure resources with the lowest average scores and share of combined four and five ratings were general farm supplies and fertilizer and veterinary service with dairy expertise. Compared with the producer survey results, the greatest infrastructure needs identified by stakeholders have some differences. For the most part, producers didn t identify milk hauling as a problematic infrastructure resource, but it ranked third for share of combined four and five scores in the stakeholder survey results. For the remaining top infrastructure resources, the order of the infrastructure quality ratings was somewhat different between the producer and stakeholder surveys. For example, manure/lagoon spreading contractors ranked first in the producer survey results based on combined share of four or five scores but ranked second behind dairy equipment sales and service based on combined share of four or five scores in the stakeholder survey results. As another example, producers ranked veterinary service with dairy expertise as fourth based on share of combined four and five scores, but the stakeholders ranked veterinary service with dairy expertise as eighth based on combined share of four and five scores. 28