Demonstrated Water Conservation Technologies
|
|
|
- Dylan Fisher
- 5 years ago
- Views:
Transcription


1 Demonstrated Water Conservation Technologies Texas Alliance for Water Conservation Rick Kellison, Project Director Funded by:


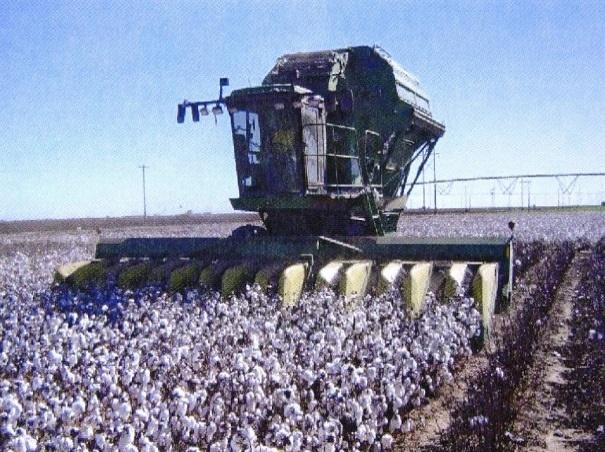
2 Ogallala Aquifer Aquifer covers 174,000 square miles across 8 states in the High Plains of the United States. Over 95% water pumped for irrigated agriculture. Texas South Plains on southern end of aquifer and is an intensive agricultural production area and focus of this program.

3 Lubbock County USGS, Scientific Investigations Report

4 Original TAWC Project Area (97,900 acres) Change in water storage in TAWC Project area Percent of 2003 water volume Year of measurement in January Data provided by High Plains Underground Water Conservation District No. 1. Lubbock, TX

5 220 Cropping Year Depth to water (feet) Static water level following Date Hale County Data provided by High Plains Underground Water Conservation District No. 1. Lubbock, TX
 and extended through April 2014,")


6 $6.2M for 8 years ( ) and extended through April 2014, administered through TWDB State renewed funding for additional $3.6M for 5 years ( ) and project expansion. Project is Producer Driven and Board Directed. Project Objectives Develop and Demonstrate new technologies, management tools and strategies that result in less water being used with enhanced profitability. Identify effective crop and irrigation systems. Impact producer decision-making.

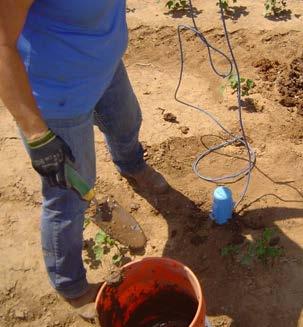
7 Rainfall Temperature Water applied Netirrigate Soil moisture AquaSpy Crop Sense Aqua Check Production inputs Plant & animal yields Economic analysis


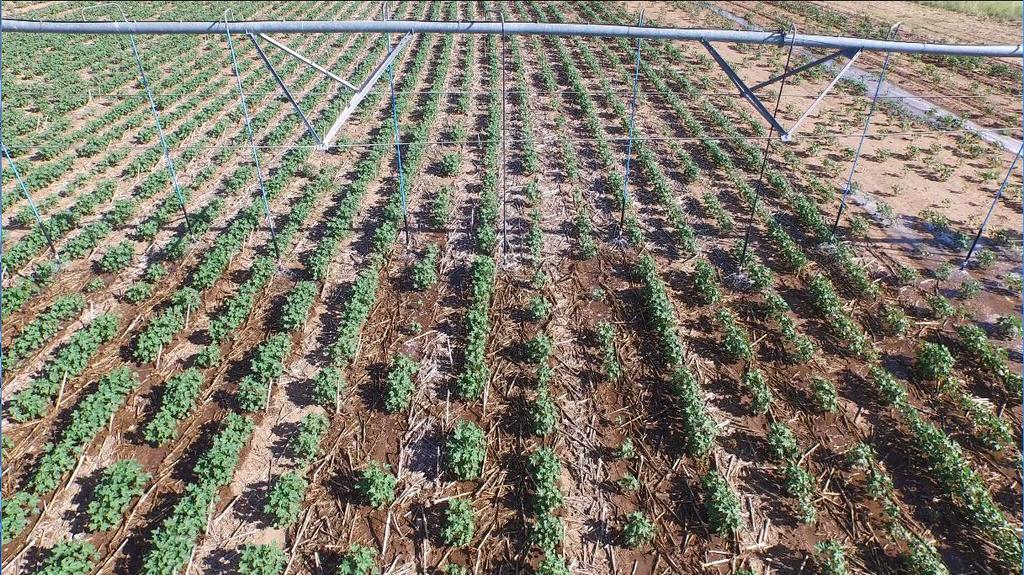
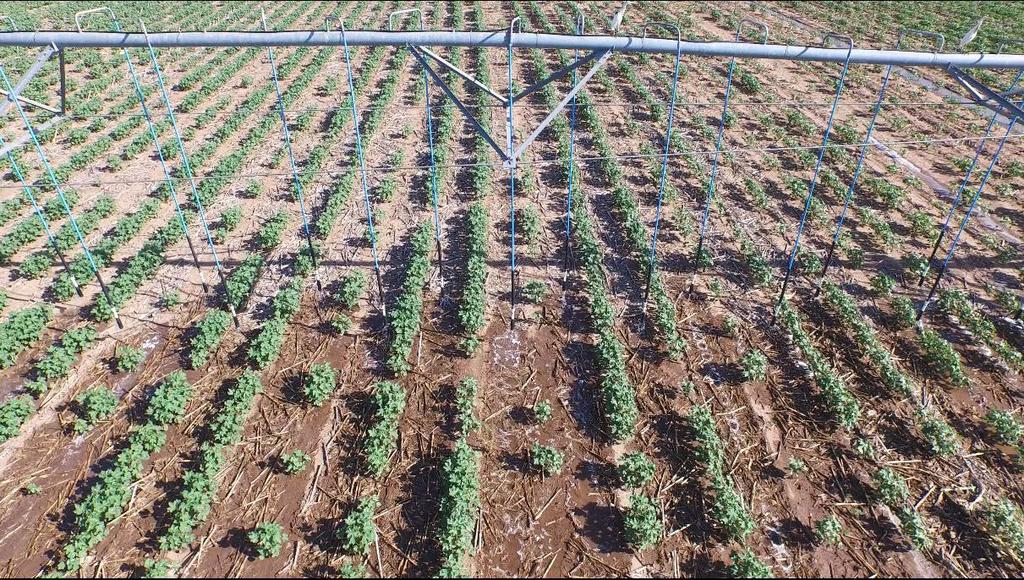
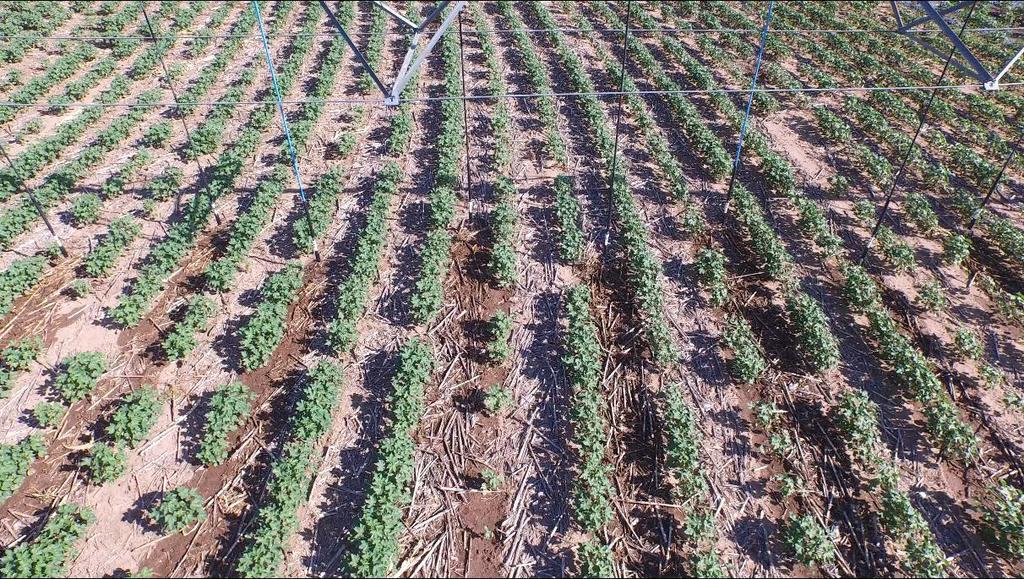
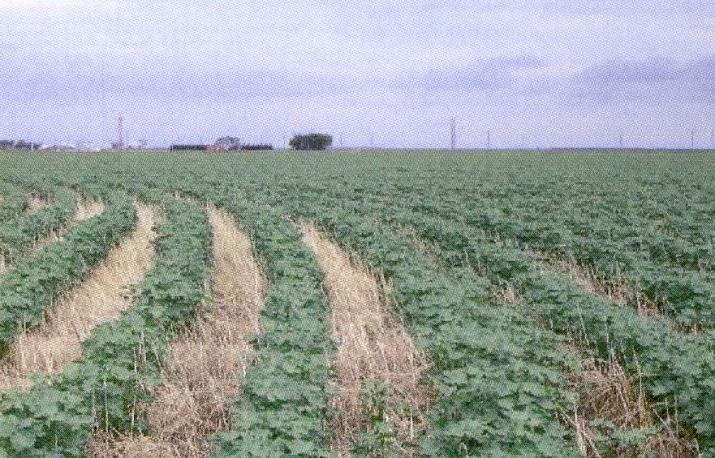
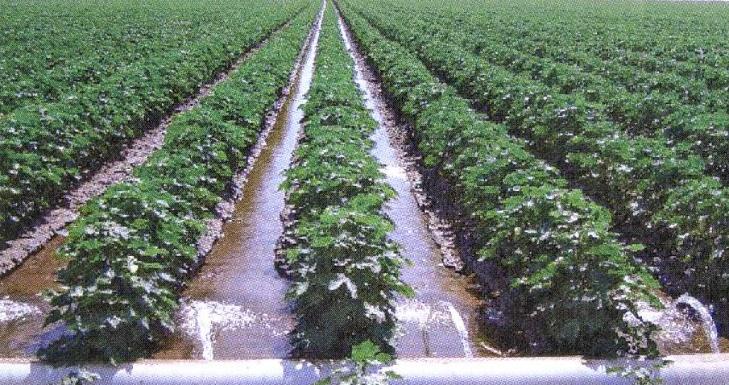
8 LESA Spray PMDI LEPA Span comparisons of different water application configurations
9 LESA LESA 2011 LEPA PER ACRE GROSS INCOME Quantity Total Quantity Total Cotton lint 879 $ $ Cotton seed 0.63 $ $ PER ACRE TOTAL GROSS INCOME $ 1, $ 1, PER ACRE TOTAL OF ALL COST $ $ PER ACRE NET PROJECTED RETURNS $ $ Percent increase 193% APPLIED - INCHES Lint lbs per acre-in of water applied Percent increase 13.9%
10 LESA LESA 2012 LEPA PER ACRE GROSS INCOME Quantity Total Quantity Total Cotton lint 896 $ $ Cotton seed 0.65 $ $ PER ACRE TOTAL GROSS INCOME $ $ 1, PER ACRE TOTAL OF ALL COST $ $ PER ACRE NET PROJECTED RETURNS $ $ Percent increase 395% APPLIED - INCHES Lint lbs per acre-in of water applied Percent increase 18.0%
11 LESA LESA 2013 LEPA PER ACRE GROSS INCOME Quantity Total Quantity Total Cotton lint 1028 $ $ Cotton seed 0.74 $ $ PER ACRE TOTAL GROSS INCOME $ $ 1, PER ACRE TOTAL OF ALL COST $ $ PER ACRE NET PROJECTED RETURNS $ $ Percent increase 155% APPLIED - INCHES Lint lbs per acre-in of water applied Percent increase 13.3%

12 LESA Mode LEPA Mode Spray mode is slow to wet up soil LEPA is quicker to wet up soil

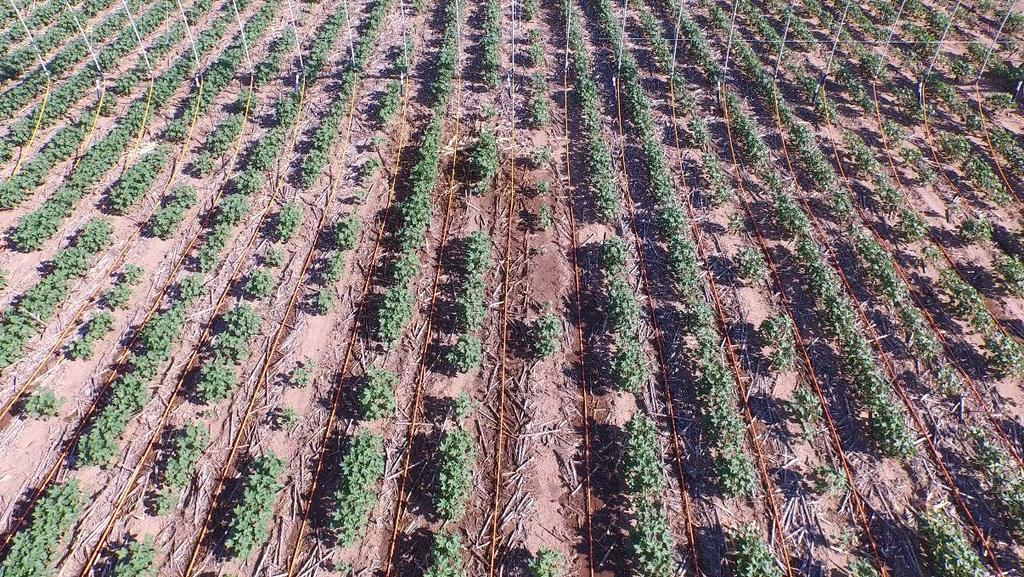
13 LDN Low drift nozzels LEPA PMDI Precision Mobile Drip Irrigation LESA Broadcast spray 80 *450 gallon per minute from 3 wells


14 R
15
16
17
18 Wetting Patterns - LEPA Low Energy Precision App (40 ) Low Energy Precision App (80 ) Wetting is deep and more uniform Water follows cracks root channels Water tends to marry up More expensive investment Wetting is deep but less uniform Water follows cracks root channels Wet spots and dry spots Cheaper alternative
19
20 Wetting Patterns PMDI & LDN Precision Mobile Drip Irrigation Low Drift Nozzle Similar pattern to LEPA Longer infiltration time More uniform wetting pattern More expensive investment Wetting is deep and more uniform Water follows cracks root channels Fewer wet spots and dry spots

21
22 Wetting Patterns - LESA Low Energy Spray App Wetting pattern is uniform but shallow Prone to evaporation from plants and soil Hard to get deep penetration


23 Irrigation System Yield/acre Moisture % LEPA 80 LDN LEPA LEPA PMDI LESA Broadcast


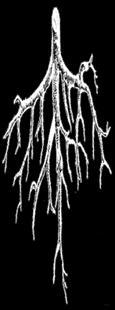
24 Irrigation System Yield, lbs/acre Turnout, % $/lb LEPA 80 LDN LEPA LEPA PMDI LESA Broadcast

25 High rainfall results in a lower impact of the various irrigation systems.
26 Plainview Rainfall Month Avg Rainfall (inches) Rainfall (inches) 2016 January February March April May June July August September October November December

27 Average Seasonal Heat Units


28 Web-based tool used to determine: When to apply water. How much water to apply. How to achieve specific management goals.
29

30 Maximizing Water Use Efficiency and Profitability The Goal Of Production Agriculture


31 Texas Alliance for Water Conservation Funded by:


32 Lateral Movement of Water PMDI Plant Line PMDI Side PMDI Furrow LESA Plant Line LESA Side LESA Furrow LDN Plant Line LDN Side LDN Furrow
33 Treatment Comparison Wetting Pattern Issues Reason PMDI 40 LEPA 40 LEPA 80 LESA 80 LDN 80 Tending to wet the row and not the furrow Uneven wetting pattern Tape probably dragging against the row Tending to wet the furrow and not the bed Small wetting pattern Outside of sprinkler, fast speed, low volume Tending to wet the furrow and not the bed Wet rows and dry rows Only wetting every other row Wetting the bed and the furrow Excellent infiltration and good uniformity Inside span has slowest speed and longest soak time Not wetting edge of bed as much as the furrow and the row Water tending to run off side of bed Water following path of least resistance