ASTARTA Results for the year 2015
|
|
|
- Percival Hawkins
- 5 years ago
- Views:
Transcription

1 ASTARTA Results for the year 2015 March 2016
2 Disclaimer 2 This presentation is being provided to you solely for your information and may not be reproduced or further distributed to any other person or published, in whole or in part, for any purpose. This presentation comprises the written materials/slides for a presentation concerning ASTARTA Holding N.V. ( Company ) and its business. This presentation does not constitute or form part of any offer or invitation to sell or issue, or any solicitation of any offer to purchase or subscribe for, any shares in the Company, nor shall it or any part of it form the basis of, or be relied on in connection with, any contract or investment decision. This presentation includes forward-looking statement, i.e. statements that are not historical facts, including statements about the Company s beliefs and expectations and the Company s targets for future performance are forward-looking statements. These statements are based on current plans, estimates and projections, and therefore investors should not place undue reliance on them. Forward-looking statements speak only as of the date they are made, and the Company undertakes no obligation to update or revise any forward-looking statements, whether as a result of new information, future events or otherwise. Forward-looking statements are not intended to be a guarantee of future results, but instead constitute the Company s current expectations based on reasonable assumptions. Actual results could differ materially from those projected in our forward-looking statements due to risks, uncertainties and other factors. In preparation of this document we used certain publicly available data. While the sources we used are generally regarded as reliable we did not verify their content. The Company does not accept any responsibility for using any such information. Although care has been taken to ensure that the facts stated in the presentation are accurate, and that the opinions expressed are fair and reasonable, the contents of this presentation have not been verified by the Company no representation or warranty, express or implied, is given by or on behalf of the Company any of its respective directors, or any other person as to the accuracy or completeness of the information or opinions contained in this presentation. Neither the Company nor any of its respective members, directors, officers or employees or any other person accepts any liability whatsoever for any loss howsoever arising from any use of this presentation or its contents or otherwise arising in connection therewith.
3 Agenda 3 Highlights of 2015 Overview of Financial Results Key Segments Results Corporate Social Responsibility
4 Highlights of 2015
5 Highlights of
6 Overview of Financial Results
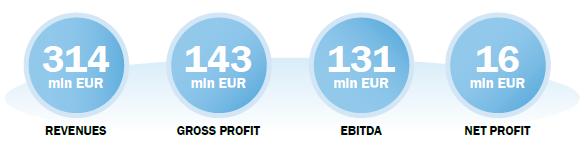
7 Overview of Financial Results 7 Overview Revenue breakdown Consolidated sales amounted to EUR 314 million EBITDA grew by 9% to EUR 131 million EBITDA margin improved from 34% to 42% To address challenges in domestic markets and naturally hedge local currency risks, ASTARTA materially increased export sales of all its products which were 36% of total Soybean processing 16% Dairy 8% Other 2% Sugar 48% Net financial debt was significantly reduced by EUR 44 million. The net debt to equity and net debt to EBITDA ratios improved significantly from about 0.98 to 0.72 and from 1.8x to 1.3x respectively Agriculture 26% Source: Company data Key financial results (in thousands of Euro) Revenues Gross profit Gross profit margin 45% 37% EBITDA EBITDA margin 42% 34% Net profit (loss) (68 076) Net debt Net debt/ebitda 1.3x 1.8x Source: Company data Exports share in consolidated revenues 36% 24% 24% 20% 13% Source: Company data
8 Key Segments Results
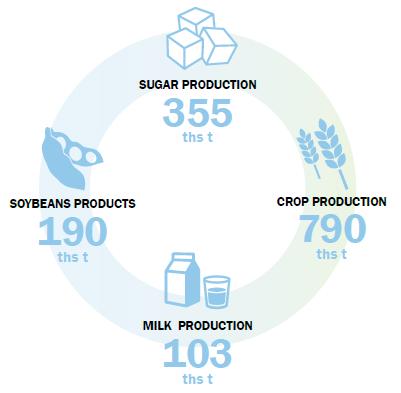
9 2008/ / / / / / / /16 Sugar Segment Highlights Key results ASTARTA s share in sugar production, 2015 Revenues 151 mln EUR #1 position on the local sugar market 34 thousand tonnes of sugar exported Record high sugar yield of 15.5% Other 36% ASTARTA 25% 9 Market Volumes of sugar sales increased 11% to 363 thousand tonnes, which means the decline in segment s revenue was mostly attributable to the arrearage in dynamics of sugar price to compensate for the depreciation of the local currency The average selling price in Hryvnia improved y-o-y by 36%, however corrected 12% in EUR to 395 EUR per tonne. At the same time, EBITDA margin improved to 38% from 24% a year ago due to decline in cost Sugar export volumes in 2015 were record high in the Group s history and amounted 34 thousand tonnes. At least third of this volume was delivered to the EU countries within the Free Trade Agreement (FTA) with Ukraine. Molasses and granulated pulp sales volume terms increased 35% and 4% to 82 thousand tonnes and 26 thousand tonnes respectively Despite correction in production y-o-y, ASTARTA has yet again ranked as a leading sugar producer on the local sugar market with a sound 25% share The cultivation area of sugar beet throughout Ukraine in 2015 reduced to 235 thousand hectares, down 41% y-o-y. The total harvest of sugar beet in Ukraine decreased 35% to 10.2 million tonnes, ranking Ukraine sixth-largest in global sugar beet production. The number of operating sugar plants declined from 48 to 36 a year ago Gals LTD 4% Source: Ukrsugar Svitanok 8% Global sugar balances and ending stocks (million tonnes) Global surplus/deficit (lhs) Source: Bloomberg, Rabobank Ukrprominvest 14% Radekhovtsukor 13% Ending stocks (rhs)
 uses pulp leftover from the processing of sugar beet and other biological residues from agri-operations, dairy farming, and")
10 Bioenergy generation 10 Bioenergy production has become an integral part of ASTARTA s innovative solutions. The Bioenergy complex built at the Globyno sugar plant (Poltava region) uses pulp leftover from the processing of sugar beet and other biological residues from agri-operations, dairy farming, and soybean processing In 2015, the Bioenergy complex generated over 10.5 million cubic meters of biogas, that is 50% higher y-o-y. Overall, the Company reduced its consumption of natural gas per tonne of sugar beet processed by 7% in 2015 owing to its modernisation and energy saving programmes, as well as the utilisation of alternative energy sources, including biogas In February 2015, ASTARTA put into operation a biogas pipeline, connecting the Bioenergy complex with its soybean processing plant. Subsequently, in 2015, biogas replaced 50% and 90% of total gas consumption at the Globyno sugar plant and the Soybean processing plant, respectively
11 Agricultural Segment Highlights Key results Revenues 82 mln EUR Record high average wheat yield of 5.4 t/ha Record high average sugar beet yield of 56 t/ha The top grains and oilseeds harvest of 790 thousand tonnes Market Sales volumes of grains and oilseeds increased by 6% to 534 thousand tonnes. Approximately 84% of total crops sold (in volume terms) were exported Acreage of land under cultivation in 2015 did not change much year-on-year. Key crops in planting structure included soybean, wheat, corn, sugar beet, and sunflower The total harvest of grains and oilseeds amounted in an absolute record in the Group s history of 790 thousand tonnes, exceeding the crop output of 2014 by 16%. This is a result of a combination of efficiency improvement policies as well as fair weather conditions for most cultivated plants (except soybean and corn in farms in Western Ukraine) Traditionally, yields of key crops in ASTARTA s fields were higher when compared to Ukrainian averages. Winter wheat yields were 5.4 tonnes (average Ukrainian 3.9), while corn and sunflower yields were 7.6 tonnes and 2.8 tonnes (5.7 and 2.2 for Ukraine), respectively According to the Agriculture Ministry of Ukraine, the total grain harvest came in at 60.7 million tonnes in gross weight terms, down 5.5% y-o-y. The harvest of key oilseeds for Ukrainian sunflower and soybean increased to 15 million tonnes (+8% y- o-y) ASTARTA grains export share in volume terms, % 31% Source: Company data Diversified crop portfolio, 2015 (%) Source: Company data 56% 55% 81% 84% Barley 1% Forage crops 9% Sunflower 10% Other 2% Sugar beet 14% Corn 18% Soybean 26% Wheat 20% 11
12 Jan-11 Mar-11 May-11 Jul-11 Sep-11 Nov-11 Jan-12 Mar-12 May-12 Jul-12 Sep-12 Nov-12 Jan-13 Mar-13 May-13 Jul-13 Sep-13 Nov-13 Jan-14 Mar-14 May-14 Jul-14 Sep-14 Nov-14 Jan-15 Mar-15 May-15 Jul-15 Sep-15 Nov-15 Soybean Processing Segment Highlights Key results Revenues 51 mln EUR #1 position in the local market for soybean processors Share of exports 57% Market Meal and oil sales in the reporting period amounted to 89 thousand and 25 thousand tonnes respectively. Approximately 99% of oil products and 47% of meal were exported. The quality of ASTARTA soybean crushing products complies with high international standards and is therefore exported to prime clients worldwide, including those in the EU countries On the operational side, in 2015, the Globyno plant produced 146 thousand tonnes (-3% y-o-y) of high-protein soybean meal, 34 thousand tonnes of soybean oil (-3% y-o-y) and 10 thousand tonnes of husk (+86% y-o-y) Soybean oil and meal prices, USD/t in Source: Bloomberg Soybean meal, USD/t (lhs) ASTARTA s share in soy crushing, 2015 Soybean oil, USD/t (rhs) In 2015, Ukrainian farmers increased plantations of soybean by almost 18% to 2.1 million hectares. However, unfavorable weather conditions negatively impacted soybean crops and the soy harvest in Ukraine increased only 1% to 3.9 million tonnes. Around 2.2 million tonnes of soybean were exported, ranking Ukraine the sixth-largest soybean exporter globally Synchronously, with the growing production of soybean in Ukraine, there is an ongoing buildup of soy processing capacity in the country. This creates competition for soy between processors and exporters. The vertical integration of ASTARTA s processing business with the growth of soy reinforces its market position. Thus, despite a tough competition, ASTARTA managed to hold onto its leading position among key soy processors in 2015 Source: Agrochart Others 39% Company Systema 6% ASTARTA 21% Protein Production 17% Oliyar 11% Kahovka Protein-Agro 6%
13 Jan-11 Apr-11 Jul-11 Oct-11 Jan-12 Apr-12 Jul-12 Oct-12 Jan-13 Apr-13 Jul-13 Oct-13 Jan-14 Apr-14 Jul-14 Oct-14 Jan-15 Apr-15 Jul-15 Oct-15 Jan-16 Jan-11 Apr-11 Jul-11 Oct-11 Jan-12 Apr-12 Jul-12 Oct-12 Jan-13 Apr-13 Jul-13 Oct-13 Jan-14 Apr-14 Jul-14 Oct-14 Jan-15 Apr-15 Jul-15 Oct-15 Jan-16 Dairy Segment Highlights Key results Revenues 24 mln EUR Record high milk yield 6.6 tonnes per cow Leading dairy producer in Ukraine High-quality milk Global dry milk price, USD/t, MATIF futures Market ASTARTA s milk production reached 103 thousand tonnes, which is slightly less compared to results of the year prior. The Group s total cattle stock corrected by 2% to 29.4 thousand heads, as the herd was reshuffled to remove less productive cows At the same time, the average annual yield of milking cows improved to a record 6.6 tonnes with the cost of feed (and consequently milk) well improved 2015 was one of the most challenging years for the Ukrainian dairy industry, with significantly reduced demand and critically low reference global milk prices as key challenges. Milk production in Ukraine declined 4% y-o-y to 10.7 million tonnes. Cattle headcount reduced by 14% to 3.9 million heads in 2015 Global milk prices in 2015 continued to fall in response to diminishing demand amid economic concerns around the world. Important factors were the Russian import ban on some foreign dairy products, lower import demand in China, and increased production in the EU attributed to the removal of milk quotas in April Source: Bloomberg EU and Ukraine milk price, USD/t The current pricing environment for milk products both in Ukraine and globally likely represents the low ebb of a cyclical pattern Raw milk price in EU, USD/t Raw milk price in EU median, USD/t Source: Bloomberg Raw milk price in Ukraine, USD/t Raw milk price in Ukraine median, USD/t
14 Corporate Social Responsibility
15 Corporate Social Responsibility (1) 15 ASTARTA is an anchor business for over ASTARTA is operating within and supporting over ASTARTA s workforce Participated in trainings Social programs and charity budget Salary fund Payments for land lease Taxes/duties paid 500 local suppliers and 300 consumers 190 rural communities employees 932 employees 30 mln UAH 721 mln UAH 452 mln UAH 526 mln UAH
")

16 Corporate Social Responsibility (2) 16 In 2015 ASTARTA provided support to: