Presented to Soil s Roles Conference March 6 9, 2014, Sacramento, California. D.D. Poudel
|
|
|
- Gordon Washington
- 5 years ago
- Views:
Transcription
1 A quick assessment of soil conditions through Focus Group Discussions, Participatory Rural Appraisals, and Soil Sampling in the mid-hills region of Nepal Presented to Soil s Roles Conference March 6 9, 2014, Sacramento, California D.D. Poudel Professor and Coordinator, Environmental Science Program Assistant Director, School of Geosciences University of Louisiana at Lafayette, Louisiana, USA
2 Introduction Objectives Materials and methods Results and discussion Conclusions Acknowledgements

3

4 Three physiographic regions of Nepal www://homenic.org/somerville/?


5
6 Country profile: Nepal Data/information 7.5 million people (1/4 th of country s population) living below poverty line. Nepal is the poorest country in South Asia and the 13 th poorest nation in the world; in 2009, 43 of 75 districts faced food deficit and 23 were chronically insecure. Approximately 55% Nepalese live below the international poverty line of $1.25/day. More than 80% of the population works in agriculture sector that accounts for 38% of GDP. Nearly half of children six months to five years of age are anemic; 49% of under-five children suffering from stunting; 13% suffering from wasting; and 39% underweight. Source Newsletter of the Adapting Livestock Systems to Collaborative Research Support Program, Spring 2011 Newsletter of the Adapting Livestock Systems to Collaborative Research Support Program, Spring 2011 World Bank, World Development Indicators, cited by US AID s Feed The Future Initiative: Nepal, FY 2010 Implementation Plan. Feed The Future Initiative: Nepal, FY 2010 Implementation Plan. UNICEF State of the World s Children and 2005 Ethiopia Demographic and Health Survey, cited by USAID s Feed the Future Initiative: Nepal, FY 2010 Implementation Plan.

7 Retreat of AX010 glacier in Sorong Himal Nepal: a. Map showing the changes in the glacier area b. Changes in the glacier and the rate of terminus retreat c. Photographs of glacier terminus between Source : WWF Nepal Program 2005.


8 Lirung Glacier (1985 and 2002) and Rika Samba Glacier in Hidden Valley, Kali Gandaki Basin (1974 and 1999) in Nepal Source: WWF Nepal Program 2005.


9 Source: http//
10 Objective: Quick assessment of soil conditions in an agricultural watershed in the mid-hill region of Nepal.


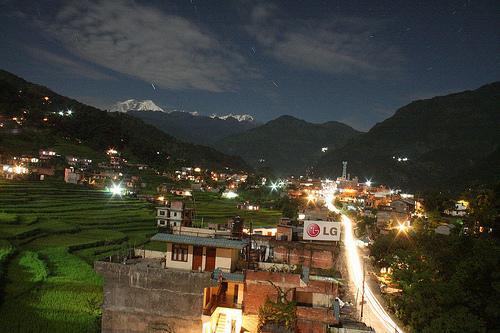
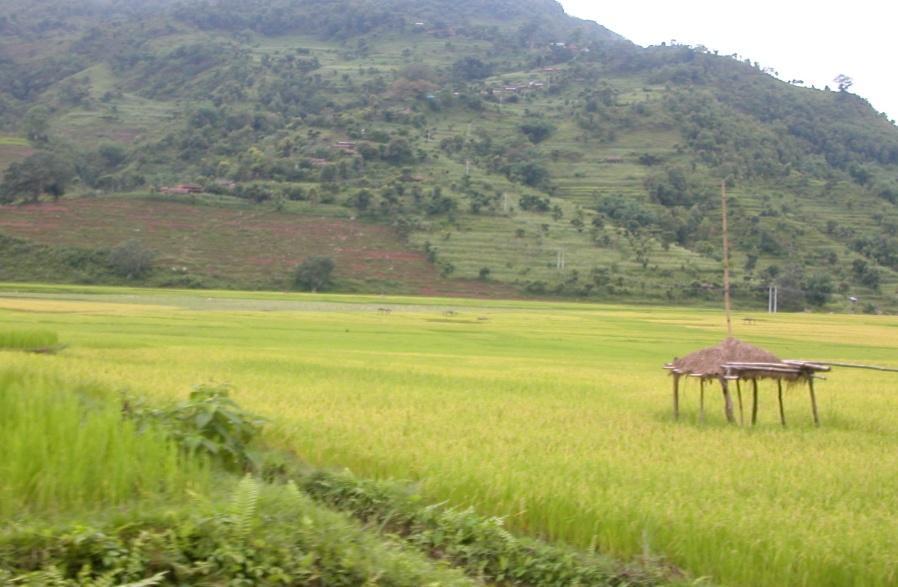
11 Study area Thulokhola Watershed, Nuwakot

12 Upper Middle Lower


13


14

")

15 Community Livestock Groups (CLG) Workshops


16 Thulokhola local community welcomes the research team


17 Focus group discussions across the three elevation levels in Thulokhola watershed

18

19


20 Participatory Rural Appraisals (PRAs) at three elevations, May 2012
21 Participatory Rural Appraisals Free style Participatory Rural Appraisals (PRAs) were done in each of the three elevations on May 21-22, 2012 in the Thulokhola watershed. The CLG members were not included in PRAs. Altogether 83 individuals attended the PRAs; with 28, 31, and 24 respectively in the upper, middle and the lower elevations. Of all the PRA participants in three elevations, 52% represented the year age-group, 23% represented year age-group, 22% year age-group, and the remaining 3% were 65 and over. While 92% of the participants were in farmers, the remaining 8% were teachers and students. In the meetings, the participants were allowed to express climate change exposures freely first, and then each of these exposures was listed on a flip chart. The climate change exposures listed were then ranked in terms of their severity by the group. Then, the impacts of climate change exposures to livestock production system were described by the group. Following this description, the group was asked for climate change adaptation measures that they have implemented in their farms and their constraints and limitations. At the end of the session, the climate change exposures, impacts, adaptations, and constraints and limitations were summarized to the group. Along with the flip chart, notes were taken, attendance sheet was developed, and group discussion was recorded. These recordings were translated and transcribed.
22 Soil sampling and analysis By involving farmers in collecting soil samples from their lands, ninety-six random soil samples were collected from irrigated and non-irrigated lands representing the three elevations and were analyzed for soil physical and chemical properties. Forty-one core samples were also collected for bulk density determination.
23 RESULTS and DISCUSSIONS
24 Droughts and declining annual rainfall Data source: Department of Hydrology and Meteorology; Ministry of Science, Technology and Environment, Government of Nepal. Nuwakot Weather Station.
25
26 In pakho land, the areas where we can hardly see pebbles here and there this year will have exposed pebbles and rocks in 3-4 years. Focus Group no. 1 in the upper elevation Our pakho soils have become chimtyailo (clayey), they are sticky and plants cannot grow on them. Focus Group no. 5 in the upper elevation Soil fertility in our lands has declined in recent years. Our soils were friable in the past, now they are clayey; we have very bad soils, we cannot make them friable anymore. Focus Group no. 3 in the middle elevation
27
28 Elevation n ph OM(%) N(%) P2O5 (kg/ha) Un-irrigated land Irrigated land Physical and Chemical properties of soils (0-15 cm) for the three elevations of the Thulokhola watershed, Nuwakot, Nepal Moderate % Moderate kg/ha K2O (kg/ha) Moderate kg/ha Textural class Upper Sandy loam Middle Loam Lower Loam Upper Sandy loam Middle Loam Lower Loam
29 Physical and chemical properties of soils (15-30 cm) for the three elevations of the Thulokhola watershed, Nuwakot, Nepal Elevation n ph OM(%) N(%) P2O5 (kg/ha) Unirrigated land Irrigated land Moderate % Moderate kg/ha K2O (kg/ha) Moderate kg/ha Textural class Upper Sandy loam Middle Loam Lower Loam Upper Sandy loam Middle Loam Lower Loam
30 Interpretation of N, P 2 O 5 and K 2 O results N(%) (Kjeldhal Method) P2O5 (kg/ha) (Bray and Kurtz No. 1) K2O (kg/ha) (Flame Photometer) Low Medium High < > 0.3 < >105 < >280
31 Average bulk density (g cm -3 ) for non-irrigated and irrigated lands in the Thulokhola watershed, Nuwakot, Nepal Upper Middle Lower Non-irrigated land n Range Average Irrigated land n Range Average
32 Conclusions Soils in the Thulokhola watershed have turned more clayey, have degraded soil structures, and non-irrigated lands have exposed pebbles and rocks on their soil surfaces. Soils in non-irrigated lands do not sufficiently support root growth and more soil borne diseases are noticed in recent years. Soil productivity in the watershed has declined in recent years. Increasing drought conditions, erratic rain events, and drying-up water sources have severely impacted agricultural production. As soil acidity, soil compaction, soil erosion, and declining soil productivity are major soil problems in this watershed, immediate implementation of appropriate soil management practices is critical for sustaining agricultural production with the backdrop of climate change impacts. A participatory soil assessment approach such as this offers a great potential for quick assessment of soil conditions and community capacitybuilding on soil resource management especially in the regions where information on soils are lacking and the climate change impacts are severe.


33 Acknowledgements This research was made possible by the United States Agency for International Development and the generous support of the American people through Grant No. EEM-A Sincere thanks to the focus group discussion team, the CLG members and the Thulokhola watershed communities for participating in this research project.,
34 Thank You