Challenges of Modeling Cropping System Responses and Adaptation to a Variable and Changing Climate
|
|
|
- Barnaby Ferguson
- 5 years ago
- Views:
Transcription

1 Challenges of Modeling Cropping System Responses and Adaptation to a Variable and Changing Climate James W. Jones Agricultural & Biological Engineering Department University of Florida
")
2 Southeast Climate Consortium (SECC) 8 universities in 5 SE states About 65 researchers from a wide range of physical, biological, & social sciences Agriculture, water resources, coastal ecosystems, and other terrestrial ecosystem applications Partnerships with extension & other boundary organizations (
3 SECC Program Overview Climate variability, risk management emphasis using forecasts, scenarios Sector-based modeling and decision analysis (agriculture and water, now broader) Understanding & working with decision makers Partnerships with boundary organizations (e.g., Extension, water utilities, Sea Grant, NGOs) Participatory development of decision support systems, operated by boundary organizations
) partitioning (f c(n)) canopy dry matter (W c ) assimilates (A p ) development stage (N) growth (dw/dt ) root dry matter (W r ) conversion efficiency (E) maintenance respiration (R m")
4 Outline Rationale Challenges photosynthesis parameters light (I 0 ) temperature (T) Concluding Remarks (potential) assimilation (P g ) intercepted light leaf area (L ) development rate (r m r(t)) partitioning (f c(n)) canopy dry matter (W c ) assimilates (A p ) development stage (N) growth (dw/dt ) root dry matter (W r ) conversion efficiency (E) maintenance respiration (R m W)
5 Rationale Vulnerability of agricultural systems to climate variability and climate change Disruptions in food supply and economic activity leading to hunger and disruptions in social systems, disproportionately affecting poorer segments of society Increasing pressure on agricultural food production as populations continue to increase and change their diet preferences Increasing production of biofuels
6 Rationale Agriculture must be better prepared to manage risks to climate variability and change; mitigation is not sufficient Prospective analyses of agricultural systems in future climates are needed to anticipate possible impacts and to adapt to meet societies needs for food, fiber, energy, other goods and services Crop models are tools that are increasingly used to do this. But, there are challenges that must be addressed to achieve societal benefits via use of these tools
7 Rationale New IPCC-5 assessments are ramping up with a more regional focus Most production decisions are made at the local level by farmers, agri-businesses, in response to local to global policies and markets Need to engage agriculture at this level to influence an adaptation pathway
8 Past Study International Climate Change Impact Assessment Led by C. Rosenzweig in the early 1990 s International study using the DSSAT crop models linked to global climate models, providing yield estimates under different climate change scenarios Predicted yields fed to a world food trade model to investigate economic consequences, shifts in trade and food security resulting from scenarios A common methodology used by scientists in over 20 countries, study funded by US-EPA
9 Model Sites for the International Climate Change Study (Rosenzweig et al., Adams et al., Parry et al. early 1990 s)
10 International Climate Change Study -- Results Summary Crop yields in mid- and high-latitude regions are less adversely affected than yields in low-latitude regions Simple farm-level adaptations in the temperate regions can generally offset the detrimental effects of climate change Appropriate adaptations for tropical regions need to be developed and tested further, with particular emphasis on genetic resources and information provision
11 Planting Date and Variety Adaptation 5000 Iowa, Non-Irrigated Current Cliamte 5000 Iowa, Non-Irrigated +2C, -30% Precip,+ CO MG MG 1 MG MG 3 0 MG DOY Planted DOY Planted Jagtap, Jones, et al., University of Florida
12 New Initiative by Rosenzweig et al. for a Similar Global Study - AgMIP Evaluate and compare crop and economic models Adapt climate scenarios for use in agricultural models Combine crop and economic models to assess food production and trade Contribute to IPCC-5 assessment
13 Challenges 1. Crop model capabilities 2. Climate scenarios 3. Other scenario components 4. Adaptation options
14 Challenge 1. Crop Model Capabilities Responses to climate, CO 2 changes Responses to pests (exogenously), or dynamic interactions with the biotic environment (endogenously) Responses to management Simple changes (i.e., planting date) Soil management techniques (i.e., drip irrigation, plastic mulch, tillage, residue management, nutrient mgt ) Pest management Genotypes being created for adaptation, i.e., Drought & heat tolerance Increased genetic potential Increased water and nutrient use efficiencies photosynthesis parameters assimilates (A p ) (potential) assimilation (P g ) maintenance respiration (R m W) growth (dw/dt ) light (I 0 ) partitioning (f c(n)) intercepted light conversion efficiency (E) leaf area (L ) canopy dry matter (W c ) root dry matter (W r ) temperature (T) development rate (r m r(t)) development stage (N)
15 Responses of Soybean Yield to Seasonal Average Maximum Temperature; Observed (Georgia yield trials) and Simulated Observed Yields Simulated Yields Yield (kg/ha) Max Temp Average (C) Yield (kg/ha) Max Temp Average (C) Mavromatis, Jones, et al., University of Florida
16 Biomass and pod yield vs. temperature for Georgia Green peanut grown at 350 ppm CO2. Default CROPGRO-Peanut model simulation Crop or Pod, kg / ha Sim - Pod Obs - Pod Sim - Crop Obs - Crop Mean Temperature, C Boote et al., University of Florida

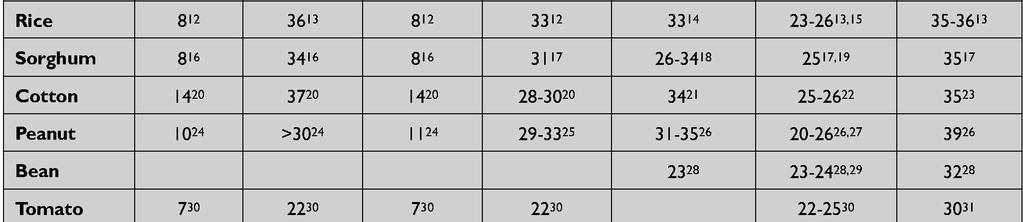
17 Meta Data on Critical Temperatures for Crops

18 Crop Responses to Water Availability Simulated versus observed maize grain yield, 2 years using field-measured spatially varying soil parameters from other year in Michigan. R. Braga (2000).
19 Relationship between seasonal rainfall and soybean yield; Observed (Georgia yield trials) and Simulated Observed Yield vs. Rainfall (mm/d) Simulated Yield vs. Rainfall (mm/d) Yield (kg/ha) Yield (kg/ha) Rainfall (mm/d) Rainfall (mm/d)
20 Evaluation of Crop Model Photosynthesis Responses to CO2 for Soybean K. J. Boote et al., University of Florida 30 Net Photosyn (umol/m2/s) Obs Cropgro Farquhar Internal CO2 (ppm)
21 Biomass or Yield, Mg/ha IR-30 Rice Response to Temperature Biomass-330 Biomass-660 Yield-330 Yield Mean Temperature, C Baker, Allen, Boote, University of Florida

22 Soil and Water Management Drip irrigation Techniques Raised beds with mulch covers Precision placement of nutrients Two-dimensional soil-root system Reduces water use, increases nutrient use efficiency, and reduces nutrient losses to the environment C L bed RTWIDI Initial root distribution Raised bed zone Under-bed zone Later root distribution Final root distribution Under-furrow zone C L furrow


23 maturity grain yield (kg ha -1 ) Soil Nutrient Management Water harvesting Micro-dosing fertilizer Residue management 0P 60P 90P 0P 60P 90P 0P 60P 90P 0N 60N 120N treatments (kg ha -1 ) measured simulated


24 Exogenous Input of Pest Damage Nyankpala: 1999 Fungicide Chinese No Fungicide Total dry weight (kg hā 1 ) F-mix Day of the year Naab, Boote, et al.


25 Designing New Cultivars for Adaptation; Linking Molecular Biology and Crop Modeling DNA Analysis Linford Nile Omaha Satt 496 Savoy Vinton 81 Williams 82 Yale 351 bp 330 bp Planting dates Row spacing Irrigation CROP MODEL Prediction of Performance Yield, Maturity Illinois, 7 Locations 5 years C. Messina et al.


26 DNA provides information to engineer crops for specific climates Climate, Site Characteristics Gene-Based, Biophysical Crop Model Optimize variety for climate: high yield, low risk of failure Soybean Gene Map C. Messina et al. Source: C. Messina. 2003
27 1 2 Production situation potential attainable Crop Model Complexity, Input Needs Yield increasing measures defining factors: CO2 radiation temperature crop characteristics -physiology, phenology -canopy architecture limiting factors: a: water b: nutrients -nitrogen -phosphorous 3 actual Yield protecting measures reducing factors: Weeds pests diseases pollutants , ,000 Production level (kg ha -1 ) Source: World Food Production: Biophysical Factors


28 Resolution of Inputs Needed for Crop Model Use & Associated Uncertainties C r Global land cover classification, U. of Maryland/NASA
29 Crop Model Capabilities Have increased during the last 20 years But, these increased capabilities vary among modeling groups, And model capabilities have not been evaluated for broad use. How robust are the new models? What model features are needed? Are data available for model input at appropriate resolutions?
30 Challenge 2. Climate Scenarios Spatial resolution Projection time scale Uncertainties

31 Historical Changes in Annual Temperature Averages Across the USA Over Last 100 Years Highly Variable Increased Decreased

 Florida and the SE warms less than much of the USA,")
32 Climate Scenarios for Downscaled Using Regional Climate Model From NARCCAP ( Florida and the SE warms less than much of the USA, between 1 and 2 0 C) March April - May December January - February
33 Questions Why do we need to downscale climate change scenarios or climate forecasts? There is a mismatch between what stakeholders need for assessing vulnerabilities and making decisions and the spatial and temporal scales at which the scenarios or forecasts are provided. There are wide ranges of spatial and temporal scales needed for different vulnerability studies and adaptation decisions.

34 Florida Temperature Trends

35 Florida Precipitation Trends Since 1896

36 Challenge 3. Other Scenario Components Population Demand for food and other agricultural goods and services Policies (local to global)

37 Policy Scenarios Carbon emission Subsidies for agriculture and forestry Environmental quality Trade Energy Land use


38 Land Use Change Agriculture in Florida - $8 billion per year Loss of 1.25 million acres of agricultural land in Florida during last ten years Increasing forest fragmentation These losses in agricultural and forest lands are due mostly to urban sprawl


39 Markets Farmers respond to market demand and also work to influence it Climate change may change access to markets by regions that are now providing products Policies also influence markets
40 Challenge 4. Adaptation Options and Scenarios Infinite combination of possibilities What are the characteristics of adaptation scenarios that would be meaningful to farmers? To policy makers? What are meaningful adaptation pathways, given current agricultural systems? When and how should farmers and agro industries be involved?

41 Concluding Remarks Crop models need to have capabilities to respond to climate, soil, and a range of management technologies to evaluate meaningful adaptation options Climate change scenarios produced by GCMs may not be the best starting point for creating local - regional climate forecasts and scenarios for stakeholder decisions over 5-10 year time horizon Other types of scenarios are needed Seasonal to 10 or 20 years into the future Based on goals of agricultural industries, trends, policies on land use, environment, etc.
42 Concluding Remarks Farm Scale Adaptation studies need to involve the agricultural community at local and higher levels Adapt to seasonal to decadal climate variability local to regional level Inform agricultural policy Engaging local agricultural stakeholders will help transition to more resilient systems and interest in longer term climate change scenarios Co-develop scenarios, adaptive management options
43 Concluding Remarks - Policy Adaptation studies also need to target policy makers Understand possible impacts Assess policy options to achieve economic, environmental, food security, societal goals These studies also need to be grounded in local and regional realities to influence an evolving process of agricultural adaptation to climate change
44
45 Dilemma: Tradeoffs Between Complexity and Functionality What crop models should be used? Some are simple; they respond to climate but have few equations, require minimal inputs, but do not deal with adaptation responses Others are complex in the sense that they require many inputs and parameters and they predict responses to a wide range of management practices What about statistical models?
46 Comments: Tradeoffs between complexity and simplicity in agricultural models Important to keep a range of modeling efforts going, ranging from very simple to detailed models Process needs to include agricultural industry at different levels, from farmer to regional production and food system organizations To ensure relevance and acceptance To advance on a more sustainable agricultural and food system Process will involve co-learning by scientists and practitioners
47