REMOTE SENSING AND GIS FOR INTEGRATED LAND MANAGEMENT: CASE OF INDIA
|
|
|
- Thomasina Garrison
- 5 years ago
- Views:
Transcription
1 REMOTE SENSING AND GIS FOR INTEGRATED LAND MANAGEMENT: CASE OF INDIA R.B.Singh and Dilip Kumar Department of Geography Delhi School of Economics University of Delhi Delhi , India
2 Land resources have reached a critical point due to greater pressure with the growing demand for food, fibre and fuel by the burgeoning population in India. High population pressure with pressing need to increase agricultural production, low soil fertility compounded by low levels of soil organic matter, inappropriate soil and water management practices are causing land degradation. About 97 per cent of all food that human beings consume comes from the land, while only 3 per cent comes from aquatic habitats. More than 90 per cent of rural and nearly 30 per cent urban population in India is dependent on ground water sources for meeting their drinking and domestic water requirements. It also forms the major source of irrigation accounting for more than 50 per cent of the total irrigation potential created. Frequent flood and drought is the regular phenomena. ISSUES Such multiple requirements called for the optimum utilization of land.

3 AIM & OBJECTIVE To generate sustainable development plan for the area, which is optimally suitable to the terrain and to the productive potential of the local resources so that the level of production is sustained without decline over time.
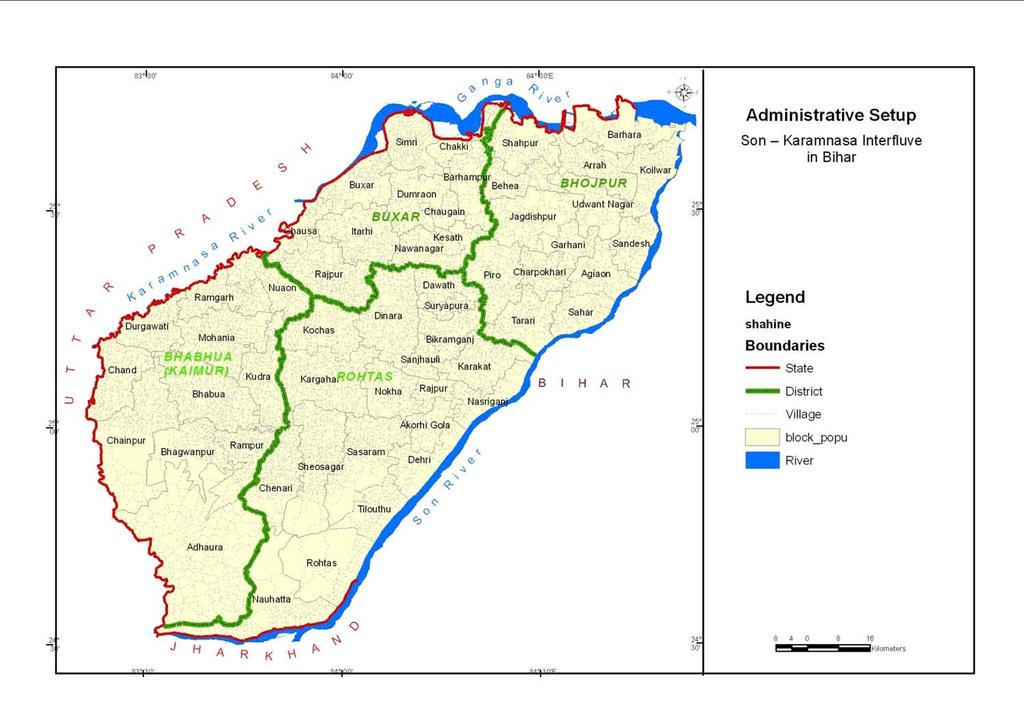
4 EXTENT : East to East Longitude and North to North Latitude GEOGRAPHICAL AREA : 10,98,393 hectares NO of DISTRICTS : 4 (Four), Bhojpur, Buxar, Rohtas and Bhabhua (Kaimur). NO of BLOCKS: 55. Bhojpur : 14 Blocks Buxar : 11 Blocks Rohtas : 19 Blocks Bhabhua : 11 Blocks TOTAL POPULATION: 73,70,214 persons per cent to total population of Bihar state. Population density : 696 persons per sq. km. Sex ratio Literacy rate :904 Female /1000 male : per cent.
5 RAINFALL (Average Annual ) : 1185 mm TEMPERATURE Summer :32 C in May (Mean Annual) Winter :16 C in January MAJOR RIVERS: Ganga, Son, Karamnasa, Durgawati, Dharmawati, Thora, Gurwat, Saur, etc. WATERSHED: 13. The study area is seismically fall in the zone III and IV.
6
7
8 WATERSHEDS Watershed Name : River / Nala Name River System Area (Ha.) WS1 : Dehra, Dharmavati Ganga WS2 : Gangi, Kumhari Ganga WS3 : LB-Son, Susana Son WS4 : Thora, Kochan, Kao Ganga WS5 : Dharmauti Karamnasa WS6 : Kudra Karamnasa WS7 : Durgauti Karamnasa WS8 : Saur Karamnasa WS9 : RB-Karamnasa Karamnasa WS10 : Gurwat Karamnasa WS11 : Karamnasa Karamnasa WS12 : Ninedah Karamnasa WS13 : LB-Along Son, Bhawatia Son Total 10,98,393.00


9 Objectives METHODOLOGY Natural / Physical Resources Contemporary Technology Socio-Economic & Demographic Data Soil, drainage, Geology, Watershed Geomorphology, Land use/cover, Rainfall & Climate Slope, aspect & altitude Transport Network Agriculture Water management Water harvesting Ground water exploration Fisheries infrastructures Social profile Demographic profile Cultural profile Economics profile Backward region identification Thematic map Information Integration of multi-thematic map Natural / Physical resources based development Possibility resource regions Socially backward regions Economics backward regions Area lacking basic amenities /infrastructures Watershed Prioritisation Resource Management Decisions Rule Suggestion / Recommendation Implementation
10 Data sources The secondary sources from various Government Departments: Survey of India, National Atlas & Thematic Mapping Organisation, GeologicalSurvey of India, Meteorological Department, Forest Survey of India, Bihar Remote Sensing ApplicationCentre, National Remote Sensing Agency, Indian Institute of Remote Sensing, All India Survey & Land Use Survey, District Administration office, District Statistics and District Agriculture Departments of Bhojpur, Rohtas, Bhabhua and Buxar districts in Bihar, National Bureau Soil Survey & Land Use Planning (NBSSLUP), Census of India, etc. The primary survey was done in the study area
 Feb - Mar, 2005 Soil Erosion Soil Problem Calcareousness Soil ph Soil Texture Parent Material Land Capability Classification Land Use 2004-05 Critical")
11 METHODOLOGY: LAND USE ANALYSIS Physiography Geomorphology Taxonomy Soil Depth Land Use (Kharif Season) Oct - Nov, 2004 Flooding Drought Seismic Hazard Salinity / Sodicity Climate Soil Particle Size Surface Drainage Slope Land Use (Rabi Season) Feb - Mar, 2005 Soil Erosion Soil Problem Calcareousness Soil ph Soil Texture Parent Material Land Capability Classification Land Use Critical Environmental Issues Ground Water Potential Integration for Composite Land Unit Contemporary Technology Decision Rule Optimum / Potential Land Use
12
13 Remote sensing based Land use/cover in Kharif Season 2004 Area (in Hectare) Area (in Percentage) Land Use Agriculture fallow land Dense forest Open forest Scrub forest Built up Sandbar Waterbody Waterlogging Other Total
14
15 : Remote sensing based Land use/cover in Rabi Season 2005 Area (in Hectares) Area (in Percentage) land use Agriculture land Fallow land Dense forest Open forest Scrub forest Built up Sandbar Waterbody other Total
16
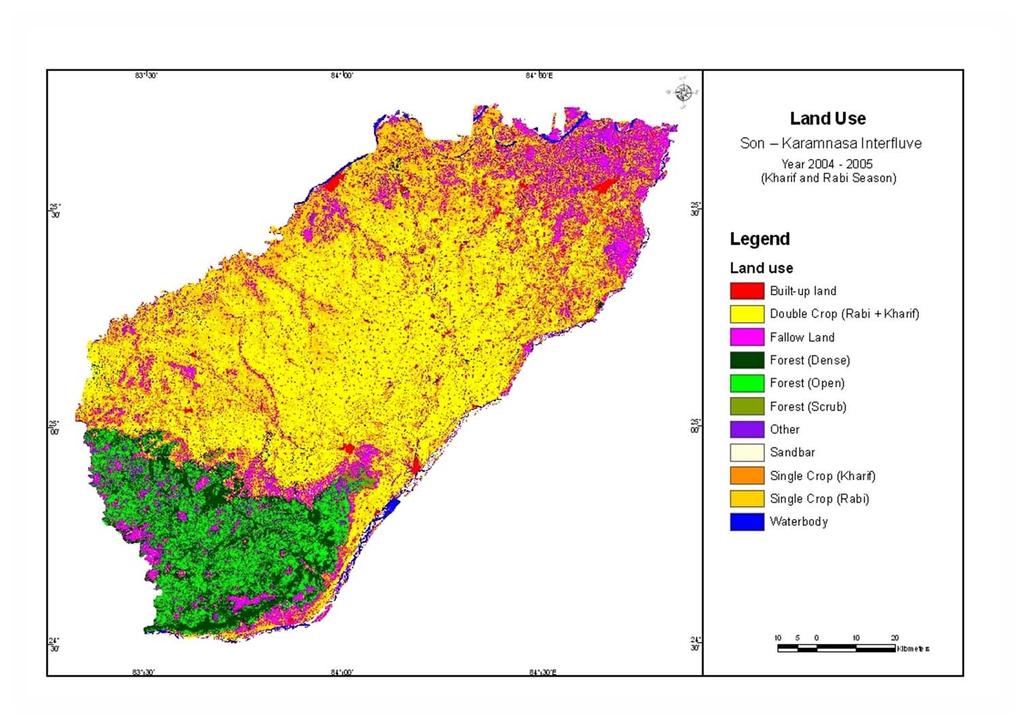
17 Remote sensing based Land use/cover in (Kharif + Rabi) Built-up land Double Crop (Rabi + Kharif) Single Crop (Kharif) Single Crop (Rabi) Fallow Land Forest (Dense) Forest (Open) Forest (Scrub) Waterbody Sandbar Other Total
18 MAJOR RESULTS OF LAND USE ANALYSIS The central part of the study area is also known as Rice bowl. The main reason is alluvial plain and the irrigation facility of the Son canal system. There are 26 per cent area under single crop land should be treated for the optimum use. There are approx. 14 per cent areas under the fallow land and these lands can be used for other uses. There is less area under the forest. The analysis reveals that there are approx. 16 per cent of land is under this category and more that 50 per cent are degraded in form of open and scrub forest. Flooding in Kharif season in Bhojpur and Buxar district, has reduced the cropland and the fallow land and water-logging areas increased. The analysis reveals that the double crop area can increase from per cent to per cent. Among these per cent i.e. 64 per cent more land can be used as double crop without any problems of soil and water.
19 Agro-horticulture The concept of agro-horticulture i.e. growing fruit trees in combination with agricultural crops has been suggested in these areas. Where production of annual crops is inefficient, the land is not capable for the double croponly rabi crop is cultivated and land is not capable for kharif. The land should be put under the Agro-horticulture. There are hectares of land can be used for agro-horticulture, that constitute 7.67 per cent of the total study area. Horticulture Where the land is fallow for long period and poor rabi crop area, horticulture can be suggested for optimum land use. This includes fruits, vegetables, spices, floriculture plantations. The analysis reveals that hectares of land can be optimum utilized by horticulture, constitute 3.01 per cent of the total area instead of ( hectare) 0.35 per cent existing horticulture use.
20 Afforestation / Gap filling The open forest land should be put under the gap filling. This activity can occurs in the forest area where the space between the forest or in the open forest area The 24,425 hectares of land can be put under afforestation that covers 2.22 per cent of the total study area, among these hectares of land need the special attention. The analysis reveals that very less area is under the forest in the alluvial plains. The analysis reveals that 0.93 per cent of the total area needs, special attention due to the moderated to very severe erosion problems, for the new forest plantation and erosion control measures. It prevent soil erosion and runoff by reducing the soil and water losses from such land. Trees and shrubs directly providing useful and basic products (wood, fodder and food etc). Silvi-pasture / fodder and fuel The silvi-pasture is one alternative land use system available for improving the fodder resources of the study area. The total area under fodder and fuel is hectares covering 0.14 per cent of the total study area.
21 METHODOLOGY: WATER HARVESTING Watershed Soil Erosion Slope Settlement Rainfall Flood Surface Waterbody Ground Water Potential Contemporary Technology Overlay Analysis Suggest Water Harvesting Structures Flooding method Ditch and Furrows method Runoff Conservation Structures Minor irrigation tanks Nala bunds and percolation tanks Bench Terracing Farm ponds Contour bunds Check dams
22
23 Ditch and Furrows method: This method involves construction of shallow, flatbottomed and closely spaced ditches or furrows to provide maximum water contact area for recharge from source stream or canal. The ditches should have adequate slope to maintain flow velocity and minimum deposition of sediments. A collecting channel to convey the excess water back to the source stream or canal should also be provided. Though this technique involve less soil preparation when compared to recharge basins and is less sensitive to silting.
24 WATER HARVESTING STRUCTURES Watershed Name Pond Total Non - Perennial Perennial Runoff Conservation Structures WS1 : Dehra, Dharmavati WS2 : Gangi, Kumhari WS3 : LB-Son, Susana WS4 : Thora, Kochan, Kao WS5 : Dharmauti WS6 : Kudra WS7 : Durgauti WS8 : Saur WS9 : RB-Karamnasa WS10 : Gurwat WS11 : Karamnasa WS12 : Ninedah WS 13: LB-Along Son Total

25 Potential zone for Flooding method / Ditch and Furrows method
26
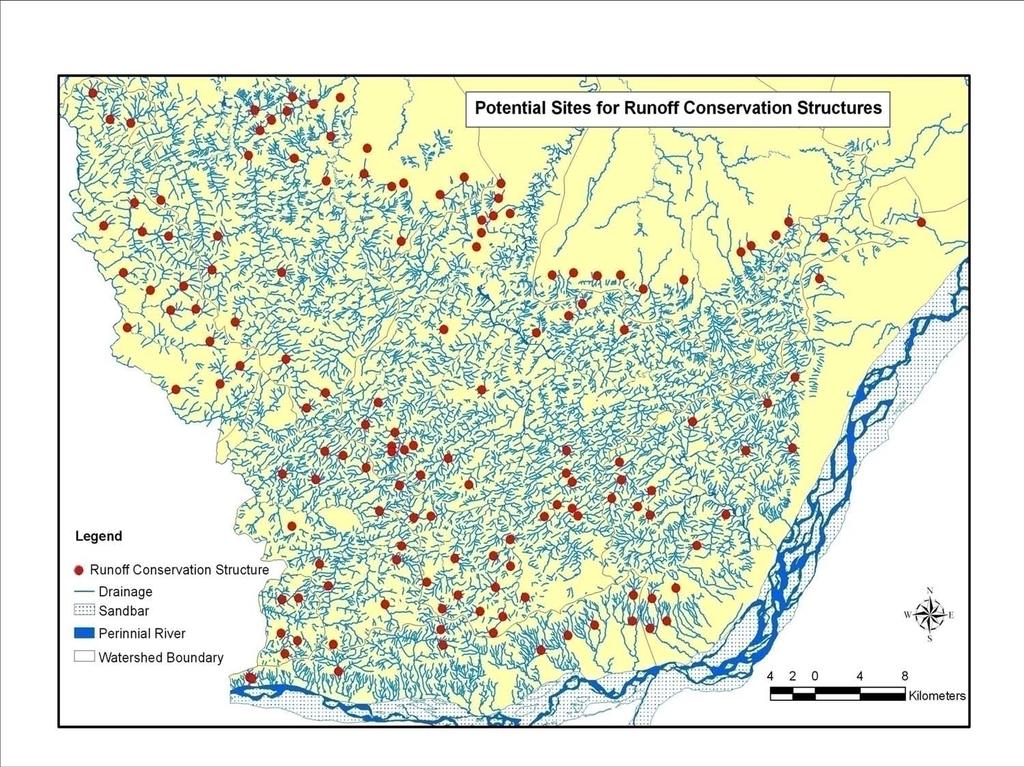
27 Major Findings of Water Harvesting Structures There are three methods Flooding method, Ditch and Furrow method and Runoff conservation structures have been suggested for water harvesting. The analysis reveals that the northern part of the study area along with the River Ganga are the potential zone for the farm pond, Flooding method and Ditch & Furrows method of water harvesting. There are 2588 ponds in the study area, among these 1090 ponds are non-perennial located mostly along the plateau region and these ponds can be restored for the rainwater harvesting. In the plateau region and adjoining area also need the rainwater harvesting to store and recharge the groundwater and dry pond. There are 151 potential site for runoff conservation structures like minor irrigation tanks, bench terracing, contour bunds, check dams, farm pond, nala bunds and percolation tank.
28
29
30 Current land use Potential land use Land use / cover Area (in Hectare) Area (in Per cent) Land use / cover Area (in Hectare) Area (in Per cent) Built-up land 26, Double Crop (Rabi + Kharif) Single Crop (Kharif) Single Crop (Rabi) 3,82, , ,22, Fallow Land 1,50, Forest (Dense) 83, Forest (Open) 83, Forest (Scrub) 8, Waterbody 13, Sandbar 15, Other 45, Total 10,98, Built-up 26, Waterbody 25, Forest 84, Double crop 6,25, Horticulture 33, Agro-horticulture 84, Afforestation 14, Sandbar 6, Double Crop with Sp. 1,04, Afforestation Sp. 10, Gap filling 83, Total 10,98,
 81,768.05 59.56 Horticulture 705.20 0.51 Agro-Horticulture 15,872.45 11.56 Sandbar 195.91 0.14 Fodder & Fuel 1,454.08 1.06 DC with Sp.")
31 Length of Rivers = Km Length of Canal = km No. of Ponds = 282 Runoff Conservation = 00 structure Potential Land use Area (ha) Area (Per cent) Built-up 4, Waterbody 1, Forest 1, Intensive Agriculture (Double crop) 81, Horticulture Agro-Horticulture 15, Sandbar Fodder & Fuel 1, DC with Sp. 28, ,37,
 81,768.05 59.56 Horticulture 705.20 0.51 Agro-Horticulture 15,872.45 11.56 Sandbar 195.91 0.14 Fodder & Fuel 1,454.08 1.06 DC with Sp.")
32 Length of Rivers = Km Length of Canal = km No. of Ponds =151 Runoff Conservation = 00 structure Potential Land use Area (ha) Area (Per cent) Built-up 4, Waterbody 1, Forest 1, Intensive Agriculture (Double crop) 81, Horticulture Agro-Horticulture 15, Sandbar Fodder & Fuel 1, DC with Sp. 28, ,37,
33 Length of Rivers = Km Length of Canal = km No. of Ponds = 38 Runoff Conservation = 19 structure Potential Land use Area (ha) Area (Per cent) Built-up 2, Waterbody 14, Forest 11, Double Crop 36, Horticulture 3, Agro-Horticulture 7, Afforestation Sandbar 5, DC with Sp. 11, Afforestation Sp. 1, Gap Filling 10, ,04,

34 Length of Rivers = Km Length of Canal = km No. of Ponds = 382 Runoff Conservation = 01 structure Potential Land use Area (ha) Area (Per cent) Built-up 4, Waterbody Forest 1, Double Crop 1,18, Horticulture 4, Agro-Horticulture 13, Afforestation 1, Sandbar DC with Sp. 6, Afforestation Sp Gap Filling 3, Total 1,54,

35 Length of Rivers = Km Length of Canal = km No. of Ponds = 555 Runoff Conservation = 00 structure Potential Land use Area (ha) Area (Per cent) Built-up 2, Waterbody Forest Double Crop 1,02, Horticulture Agro-Horticulture 4, Afforestation Sandbar Fodder & Fuel DC with Sp. 5, ,15,

36 Length of Rivers = Km Length of Canal = km No. of Ponds = 417 Runoff Conservation = 10 structure Potential Land use Area (ha) Area (Per cent) Built-up 1, Waterbody Forest 4, Double Crop 63, Horticulture 1, Agro-Horticulture 10, Afforestation Sandbar DC with Sp. 9, Afforestation Sp Gap Filling 2, ,

37 Length of Rivers = Km Length of Canal = km No. of Ponds = 184 Runoff Conservation = 44 structure Potential Land use Area (ha) Area (Per cent) Built-up Waterbody Forest 25, Double Crop 25, Horticulture 5, Agro-Horticulture 4, Afforestation 2, Sandbar DC with Sp. 4, Afforestation Sp. 1, Gap Filling 26, ,

38 Length of Rivers = Km Length of Canal = km No. of Ponds = 428 Runoff Conservation = 26 structure Potential Land use Area (ha) Area (Per cent) Built-up 1, Waterbody Forest 14, Double Crop 42, Horticulture 4, Agro-Horticulture 8, Afforestation 3, DC with Sp. 8, Afforestation Sp. 4, Gap Filling 15, ,04,
39 Length of Rivers = Km Length of Canal = km No. of Ponds = 51 Runoff Conservation = 00 structure Potential Land use Area (ha) Area (Per cent) Built-up Waterbody Forest 1, Double Crop 12, Horticulture 1, Agro-Horticulture 4, Afforestation DC with Sp. 1, Afforestation Sp. 1, Gap Filling ,

40 Length of Rivers = Km Length of Canal = km No. of Ponds = 00 Runoff Conservation = 17 structure Potential Land use Area (ha) Area (Per cent) Built-up Waterbody Forest 4, Double Crop Horticulture 5, Agro-Horticulture Afforestation 3, Afforestation Sp Gap Filling 8, ,

41 Length of Rivers = Km Length of Canal = km No. of Ponds = 00 Runoff Conservation = 14 structure Potential Land Use Area (ha) Area (Per cent) Built-up Waterbody Forest 6, Double Crop Horticulture 4, Agro-Horticulture Afforestation 1, Gap Filling 9, ,

42 Length of Rivers = Km Length of Canal = km No. of Ponds = 00 Runoff Conservation = 05 structure Potential Land use Area (ha) Area (Per cent) Built-up Waterbody Forest Double Crop Horticulture Agro-Horticulture Afforestation Gap Filling 1, ,
43
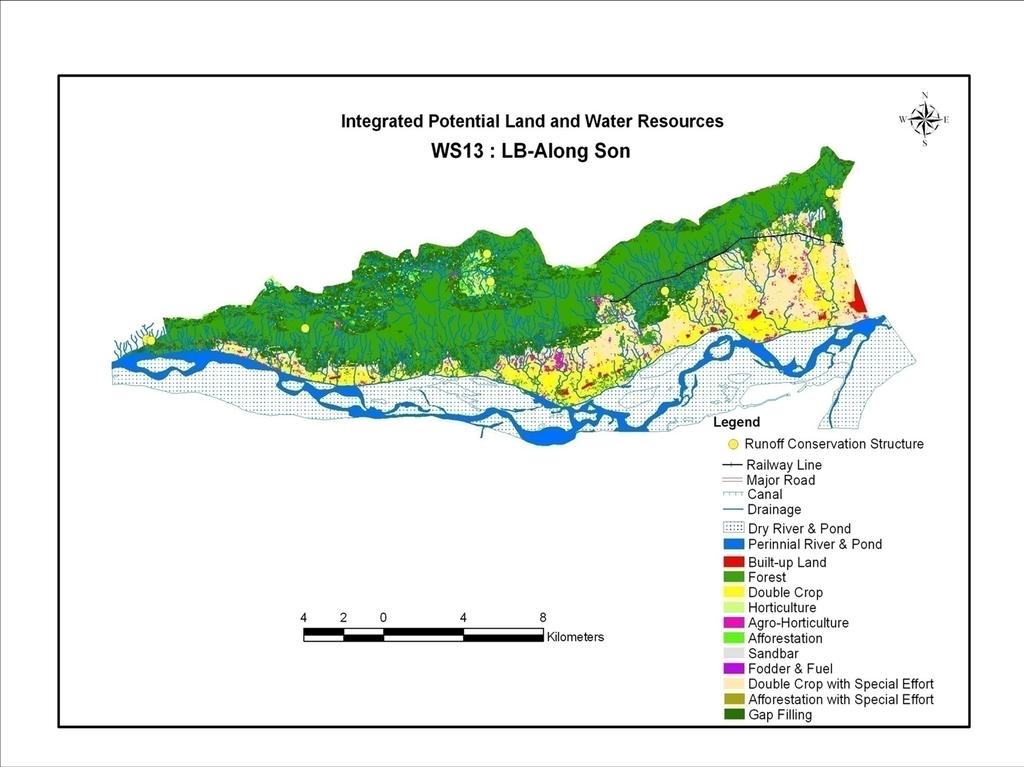
44 Length of Rivers = 580 Km Length of Canal = 0.00 km No. of Ponds = 03 Runoff Conservation = 15 structure Potential Land use Area (ha) Area (Per cent) Built-up Waterbody 3, Forest 8, Double Crop 2, Horticulture Agro-Horticulture Afforestation Sandbar DC with Sp. 3, Afforestation Sp Gap Filling 3, Total 23,
45 MAJOR RESULTS OF INTEGRATED MANAGEMENT Double crop: The data also reveals that per cent of the double crop area in watershed number 1. The analysis reveals that hectares of land that constitute 9.56 per cent of the total area has soil and water logging problem due to the flood. These areas need the special attention for double crop. The watershed wise analysis show that per cent of the total area in this category is found in watershed number 1 and 2 has and per cent of the double crop area with special effort respectively. Agro-Horticulture: Watershed number 1, 2, 4, 6 and 8 has more that 10 per cent area under this category. Watershed number 3, 5, 7 and 9 has 5 to 10 per cent and rest of the watershed has less than 1 per cent agro-horticulture area because this area is Kaimur and Rohtas plateau and maximum area is covered by the forest. Afforestation with special effort: watershed number 8 has per cent area need due to the moderate to severe soil erosion
46 The watershed wise analysis reveals that maximum afforestation area are found in watershed number 7, 8 and 10, where afforestation area is 19.12, and per cent respectively, of the total afforestation area. Department of fisheries, Government of Bihar is also working in this direction by opening fish seed farms and supplying fish seed of major crops at concession rates. Similarly, a large number of small check dams, farm ponds, impoundments etc, proposed in the watershed development programmes can also be exploited for fish culture by adopting seasonal cropping techniques. Leveling and cropping:these lands should be brought under cultivation after removing bricks pieces and leveling. The deep phoughing is suggested in these lands for mixing farmyard manure. Drainage system: In the study area horizontal drainage system should be adopted. The horizontal drainage system is one which receives excess water directly from field to field and conveys it to the main drain. The horizontal drainage system is suggested on those areas where the stagnation of rain water during monsoon.
47 Gully plugging: The gullies are formed as a result of localized surface runoff affecting the friable unconsolidated material in the formation of perceptible channels resulting in undulating terrain. Therefore, to control the further erosion, check dams / obstacles and growing of grass species are suggested. Fish culture (Pici-culture) Total 2558 in numbers of pond or lake, covering hectares (0.39 %) of total land. Among these 1498 ponds are perennial, 1090 ponds are non-perennial. These ponds can be identified and renovated for better impounding of rainwater and can be used for the fish culture. Help the landless or the unemployed persons find a new job opportunity in view of the fact that villages with small ponds is quite common and in village where none exists now, new ponds can be developed for this purpose.
48 MAJOR FINDINGS
49
50 SUGGESTION RS and GIS Appropriate for Integration Integration of livestock enterprise with alternate land use systems: Rainwater and soil management: Cropping systems and Rotation: Precision in seed and fertilizer placement: Nutrient management: Alternate land use system: Mixed land use system such as agro-forestry, agro horticulture etc.