Soil Quality: Soil Indicators. Dr. Paul Hargreaves SRUC Dairy Research and Innovation Centre
|
|
|
- Shona Gaines
- 5 years ago
- Views:
Transcription
1 Soil Quality: Soil Indicators Dr. Paul Hargreaves SRUC Dairy Research and Innovation Centre 1

2 Soil air, water, minerals

3 Soil functions Support hooves and wheels Reduce gas losses, N 2 O, N 2, NH 3 and CH 4 Recycle nutrients in wastes Store water and plant nutrients minimise runoff, sediment and fertiliser losses Prevent NO 3 and pesticide leaching losses Good soil function increases profitability and conserves the environment
4 Ecosystem services Supporting Provisioning Nutrient recycling, primary production and soil formation, make it possible for the ecosystems to provide other services Food, crops, raw materials (including timber, fodder, and fertilizer), genetic resources (including crop improvement genes), water Regulation Cultural Carbon sequestration and climate regulation, waste decomposition, purification of water, pest and disease control Spiritual, historical, recreational

5 Soil Profile O horizon Organic horizon, generally dead plant material. Can be missing - deeper in forest soils. A horizon Top-soil, usually contains most organic material and has the greater mass of roots most biological activity, with greater soil structure B horizon Sub-soil, can be several metres thick, usually of a greater density than the top soil, less organic material, greater mineral content. Lighter in colour. C horizon Parent material, generally undefined layer containing more minerals, can be from the underlying rock material or bedrock, but not always the case.
6 Sand, Silt and Clay Sand mostly quartz, feldspar and mica (fragments) traces of heavy metal, low surface area size between 0.06mm and 2.0mm Silt mineralogical composition is similar to sand, intermediate surface area size between 0.002mm and 0.06mm Clay reactive fraction of soil, colloidal, large surface area, high charge density size less than 0.002mm
7 The Soil Triangle

8 Soil Structure Structure is the how the particles bind together to form aggregates that allows: roots to anchor the plant water to drain through pores and cracks water retention air to roots for favourable gas exchange mineralisation of nutrients and release to crop roots biodiversity of microbes
9 Organic Matter Soil plays a major role in the global carbon cycle, with the global soil carbon pool estimated at 2500 gigatons, 3.3 times the size of the atmospheric pool and 4.5 times the biotic pool. Organic material in the soil comes from the breakdown of plant and animal material. Depending on their chemical structure, decomposition is rapid for sugars, starches and proteins (days), slow for cellulose, fats, waxes and resins (months) or very slow for lignin (years) % of the non-living part of organic matter is humus


10 Living Soils Huge quantity of organisms - Fauna: 1-5 t/ha - Fungi: 3.5 t/ha - Bacteria: 1.5 t/ha F. Ippolito Photo : L. Avoscan & A. Viollet Fantastic diversity - Until recently: only access to culturable microorganisms - Methodological progresses possibility to extract DNA from soils bacterial genotypes / g soil A lot to be explored on the relations between below & aboveground diversity Van der Heijden et al Nature 396:69-72

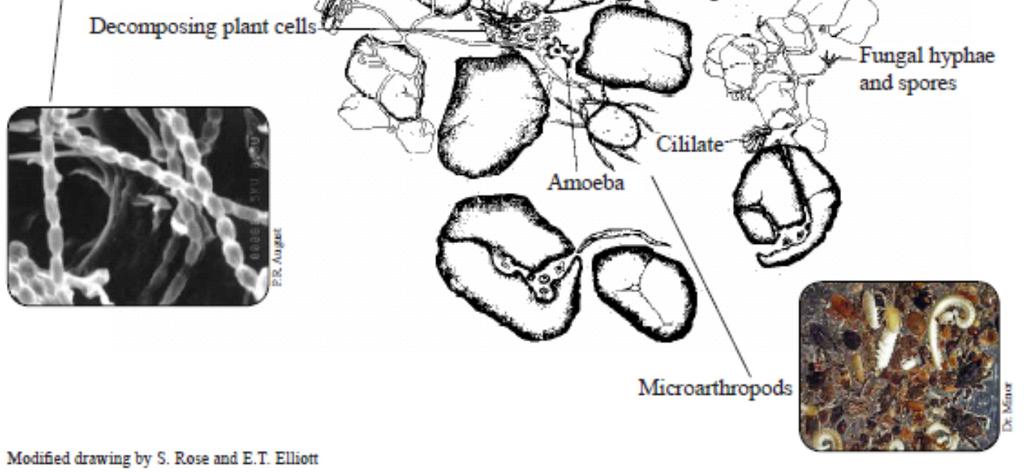
11 What lives in the soil?

12 Soil Biota
13 Carbon Cycle Complex organic carbon molecules are broken down to simpler molecules. Used as an energy source for the different fauna and flora within the soil.

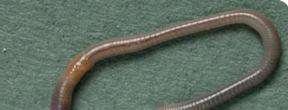
14 Earthworms Can be very good indicator of soil quality as: they do not move very far (10 metres) can live for up to 10 years exposed to soil changes ph, waterlogging, compaction, organic matter
 more vertical borrows and mix mineral soil with organic material from the")
15 Earthworms Three main types: Litter Feeders (Epigeic) found close to the soil surface or in the litter layer Shallow Burrowers (Endogeic) found in extensive borrows close to the soil surface and feed on organic material Deep Burrowers (Anecic) more vertical borrows and mix mineral soil with organic material from the surface

16 Soil Pores Dye labelling Computer-aided tomography


17 Aggregates Sizes


18 Soil After Compaction Treatments Trampled Tractor No Compaction 18
19 Earthworms and Compaction

20 Earthworms and Compaction
21 Earthworms and Compaction

22 Earthworms
23 Positive effects of earthworms on yield Van Groenigen et al 2014
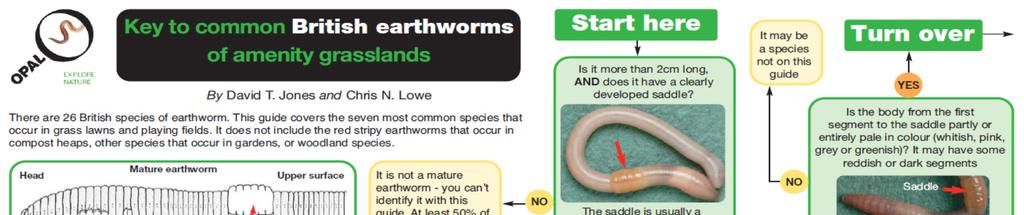
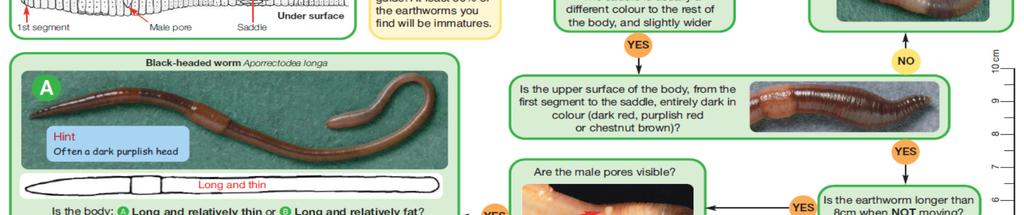
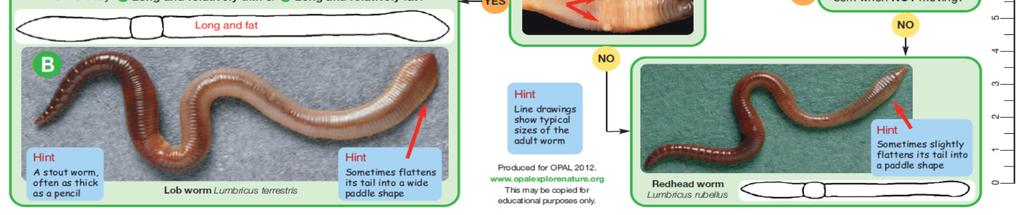
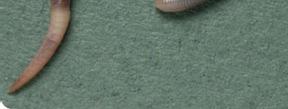
24 Earthworm Identification I
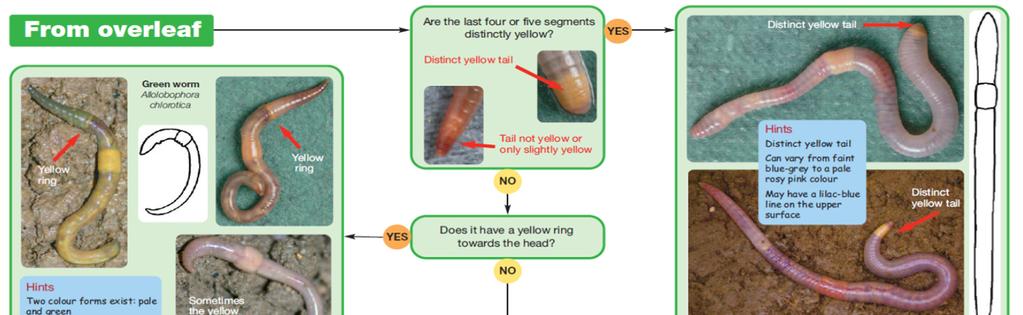

25 Earthworm Identification II

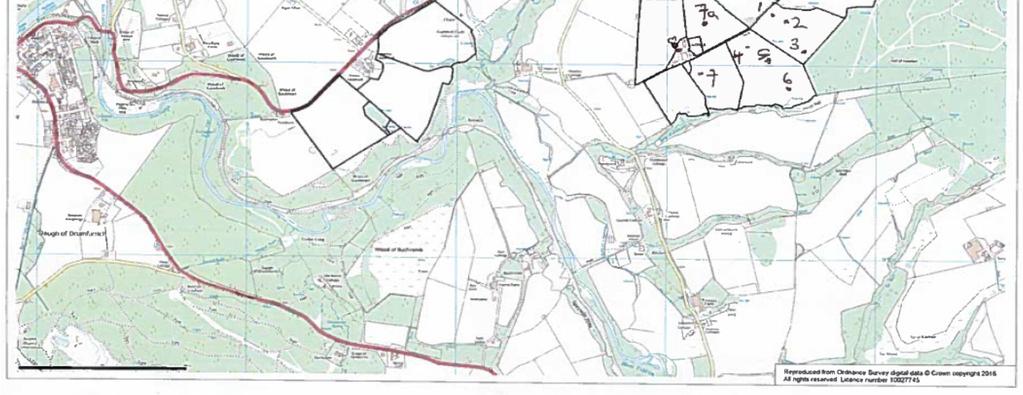
26 Local Worm Numbers


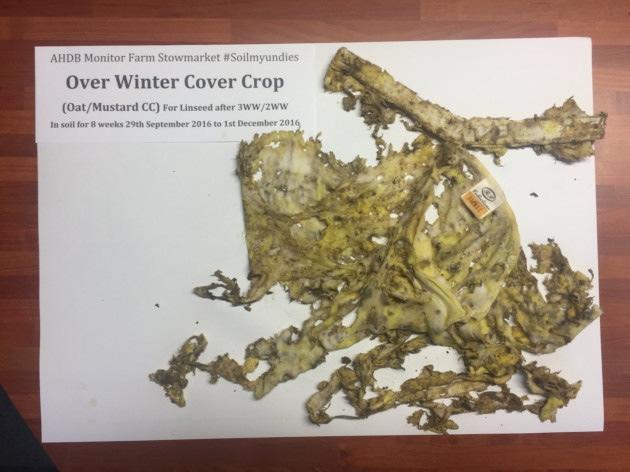
27 Other Methods

28 Compaction and Nitrogen Use


29 Surface Visual Clues Trampled Tractor No Compaction 29

30 Why measure soil quality? Think of it in terms of: An MOT for your soil Or A check up at the doctors Working towards rolling out soil quality testing


31 First Questions What is the state of my soil? Depends on Soil type What you want to do with it How do I tell? Need indicators as can t measure everything


32 Components of soil quality Physics Biology Chemistry Current soil reports ph Routine nutrients
33 Rolling out soil quality testing - Scorecard threshold values Based on proposals for soilquality.org.uk (based on the Australian model - ) to enable utilisation of a wider database for benchmarking and ultimately advice. The traffic light sytem represents: RED (High risk, need to investigate urgently) AMBER (Moderate risk, need to investigate further) GREEN (Low risk, continue to monitor)

34 Practical considerations Selected soil health measurements: Routine analysis (P, K, Mg, Ca, ph) LOI VESS Earthworms PMN Why? Combines physics, chemistry and biology Lab set-up Turn around time
35 Potential scorecard... NAME ASD CUSTOMER TEXT_ID Field Name West Mid East FID Potentially Mineralisable N mg/kg Organic Matter (LOI) % ph Extractable Phosphorus mg/l Extractable Potassium mg/l Extractable Magnesium mg/l Extractable Calcium mg/l Extractable Sodium mg/l mean VESS Mean worms Lime req (Grass) tonne/hectare Lime req (Arable) tonne/hectare Soil texture = sandy loam Soil health recommendation Soil structure (VESS) low in the West field Adding OM and upping ph should alieviate this Depending on OM source consider extra N to account for immobilisation Worm numbers would benefit from OM and reduced tillage
36 Potential for benchmarking As in the current SRUC AGREcalc where you can see your carbon footprint in relation to others You will be able to see how your soils perform against comparable soils and over time Benchmarking will improve the more data is entered
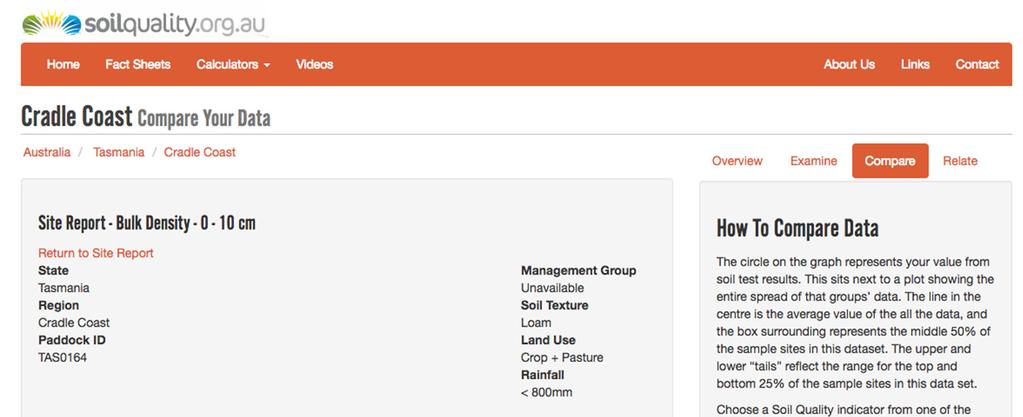

37 Benchmarking Results
38 Summary Living soil is important for crop yield and quality Can be an indicator of soil health Soil health monitoring is a combination of methods Benchmarking indicates the health of a soil compared to other fields in the area

39 Thank you Any Questions?
40

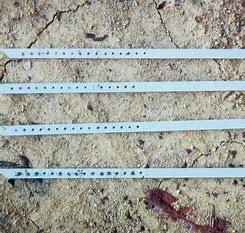
41 Worm and Bait Sticks