GLEAM - THE GLOBAL LIVESTOCK ENVIRONMENTAL ASSESSMENT MODEL. A global LCA model of livestock supply chains
|
|
|
- Stephen Franklin
- 5 years ago
- Views:
Transcription

1 GLEAM - THE GLOBAL LIVESTOCK ENVIRONMENTAL ASSESSMENT MODEL A global LCA model of livestock supply chains Carolyn Opio, Natural Resources Officer, FAO


 Produce disaggregated assessments")

2 EXPLORE ENVIRONMENTAL IMPLICATIONS OF MAJOR LIVESTOCK COMMODITIES PRODUCTION PRACTICES Pierre Gerber (team leader), Henning Steinfeld, Benjamin Henderson, Carolyn Opio, Anne Mottet, Tim Robinson, Alessandra Falcucci, Giuseppe Tempio, Michael MacLeod (SRUC), Theun Vellinga (WUR) Produce disaggregated assessments Carry out economic analyses Engage in multi-stakeholder initiatives on methods and practice change 2
3 GLEAM GLOBAL LIVESTOCK ENVIRONMENT ASSESSMENT MODEL Life Cycle Assessment modelling Cradle to retail, all major sources of emissions included Computes emissions at local level GIS-based Can generate averages and ranges at different scales Developed at FAO, in collaboration with other partners Allows for scenario analysis - A tool to improve the quantification of GH G emissions from livestock supply chains Will be expanded to other livestock -environment interactions (e.g. nutrients, water, etc) 3

4 GLEAM MODULES

5

6 GLEAM INPUT DATA

7 GLEAM INPUT DATA - Calculations done at 5 x 5 km at the equator: GIS captures heterogeneity and allows aggregation at various scales - Primary data: animal numbers and distributions, crop areas, crop yields, herd parameters, mineral fertilizer application rates, etc. - Intermediate data: animal growth rates, feed rations, animal energy requirements, etc.

8 GLEAM INPUT DATA - Gridded Livestock of the World - Sere & Steinfeld system classification:. Grazing and mixed ruminants systems. Backyard, intermediate & industrial pig systems. Backyard, layers & broilers chicken systems

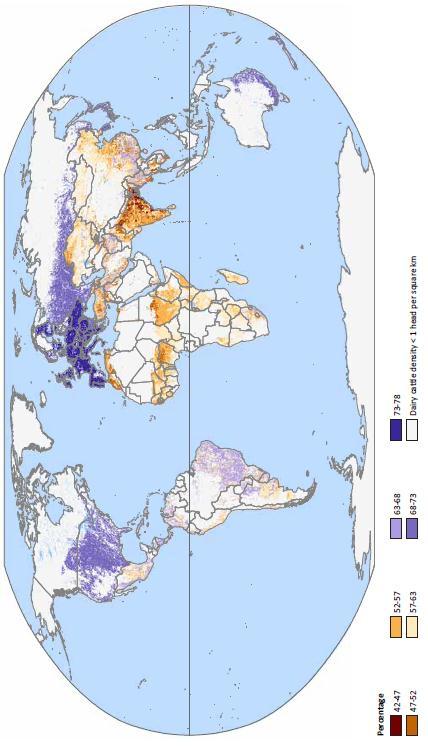
9 DISTRIBUTION OF DAIRY CATTLE POPULATION

10 GLEAM INPUT DATA - Fertility, growth rate, replacement rate... - Specific values for different production systems and AEZ - Extensive literature research, expert consultation and surveys
11 HERD PARAMETERS

12 LIVESTOCK POPULATIONS Disaggregation of herd structure Emissions and production varies markedly between different animals categories > need to know herd structure. Herd module determines the herd structure using data on key parameters e.g. fertility, AFC, growth and replacement rates
, literature search, surveys and expert knowledge e.g. Proportion of feed materials in ration - Dry-matter yield per hectare, net energy content and nitrogen content")
13 GLEAM INPUT DATA - Specific feed baskets are defined for cohorts, production systems and regions - 2 methods O ECD/non O ECD countries - Data sources: Result of intermediate calculations in GLEAM (animal number/cohort), literature search, surveys and expert knowledge e.g. Proportion of feed materials in ration - Dry-matter yield per hectare, net energy content and nitrogen content
14 AVERAGE FEED DIGESTIBILITY

15 GLEAM INPUT DATA - Types of MMS used in GLEAM are based on IPCC categories defined by IPCC (2006) guidelines - Proportion of manure managed in different systems: Data taken from N ational inventories reports of MMS, expert knowledge and literature reviews - Cross MMS and climatic conditions

16 MMS DAIRY CATTLE SYSTEMS

17 MANURE METHANE CONVERSION FACTORS - DAIRY
18 RESULTS: CONTRIBUTION BY SPECIES AT AGGREGATE LEVEL FAO, 2013

19 >45% OF EMISSIONS FROM FEED FAO, 2013

20 EMISSION INTENSITIES AND VARIABILITY IN EI EGGS EGG FAO, 2013
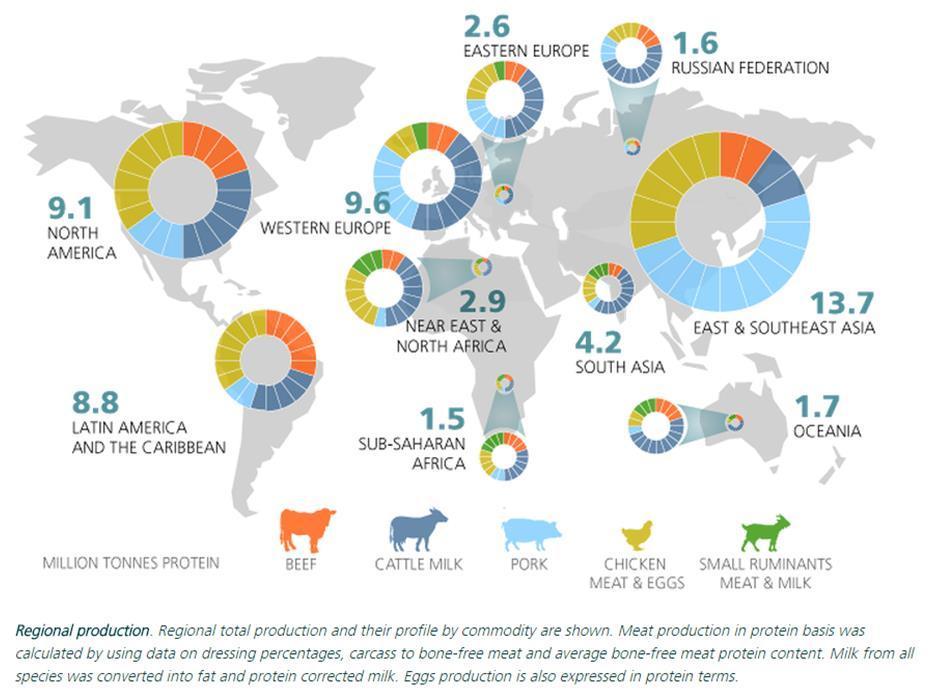
21 LIVESTOCK PRODUCTION

22 LIVESTOCK EMISSIONS FAO,


23 Comparison of systems PORK: EMISSION INTENSITY BY MAIN SYSTEM key drivers of emissions: feed production and manure management dominate in all 3 systems explain the differences Backyard highest on-farm emissions, but lowest overall EI - why? - Low FCR, low digestibility of the ration>high Volatile solids and N excretion - Feed CO2eq. low due to: no LUC associated with feed - Negligible emissions from post-farm, direct or embedded energy, and greater use of swill and waste crops Why is intermediate higher than industrial? - lower Feed conversion ratios - lower digestibility ration - Rice a large share of feed ration; high CH4 emissions from rice production 23


24 TIER 1 VS TIER 2 * Calculated from GLEAM Tier 1 Default EF for Western Europe Tier 2 specific EF calculated for pig cohort
25 MITIGATION POTENTIAL Statistical analysis: mitigation potential of ca. 30% Potential of bridging the emission intensity gap without system change if producers with higher EI adopted practices of best- performing producers Case studies: designed on anticipated positive effects on producers income, food security, and broader environmental performance. Mitigation packages were selected on feasibility of adoption by farmers. Mitigation potential of 10 to 45 % for constant output 25

26 CASE STUDIES: MITIGATION PACKAGES Mixed dairy OECD - Lipids - Anaerobic digestion - Energy efficiency Specialized beef - Pasture quality & C sequestration - Health and husbandry Small ruminants - Forage quality - Health & husbandry - Grazing management Commercial pigs - Manure management - Energy efficiency - Feed quality, health and husbandry Mixed dairy - Feed quality - Health & husbandry 26
27 APPLICATIONS The economics of resilience in the drylands of sub-saharan Africa. World Bank, FAO and other partners are collaborating to a flagship report on resilience in drylands in Africa. Livestock is the main user of land and a key support for livelihoods in those areas. GLEAM was used to analyse the potential of livestock in drylands to meet the projected demand growth. AnimalChange. International project with 25 partners from Europe, Africa and Latin America that aims to provide a sound basis for the future of livestock under climate change by improving the models, tools and policies used to address this topic. FAO leads the Component 4 of the project: the regional assessment and policy making support. GLEAM was used to assess global and regional emissions and mitigation packages. Productivity and carbon credits in Kenyan dairy farms. The FAO is involved in a project to improve the productivity of dairy farms in Kenya and to generate additional income for farmers based on carbon credits. GLEAM supports the assessment of emissions and several technical options for smallholder dairy herds. Climate Smart livestock investment proposals in Zambia. The AGAL branch contributed to the Economics & Policy Innovations for Climate-Smart Agriculture (EPIC) programme regarding mitigation potential in Zambian livestock supply chains. The approach is currently being up-scaled for Southern Africa. GLEAM was used to analyse emission profiles, mitigation options and productivity gains. Climate Smart Livestock in Ecuador. Funded by the Global Environmental Facility, it aims at capacity development, adoption of better practices, access to new markets and diversification of livestock sector in Ecuador. The project is based on natural resource use efficiency and carbon sequestration. GLEAM provides the analysis of emission profiles in livestock supply chains and the assessment of options to increase system resilience and productivity. Greenhouse gas mitigation potential of the world's grazing lands. In collaboration with Colorado State University and together with the Century and Daycent models, GLEAM was used to assess the global mitigation potential of different management practices of grasslands.
28 NEXT STEPS Further investigate economics of mitigation Improve, update GLEAM to reduce uncertainty and measure progress: FAO -GRA project East Asia, South Asia, Cono-sur countries Progressively include more environmental categories in GLEAM Drive action on the ground >>>Support practice change Test some of the options and related institutional frameworks on the ground Support development of livestock N AMAs

29 THANK YOU 29