Sustainable animal production systems in Africa
|
|
|
- Tiffany Atkinson
- 5 years ago
- Views:
Transcription


1 Sustainable animal production systems in Africa Timothy Robinson Catherine Pfeifer, Mario Herrero, Thomas van Boeckel & Marius Gilbert 61 st International Congress of Meat Science & Technology Clermont-Ferrand, France, August 2015

2 Overview What we mean by sustainability Livestock sector trends and drivers Mapping livestock distributions and production systems Livestock and livelihoods Livestock and the environment Livestock, health and nutrition Conclusions
3 What does sustainable mean? Equity and growth Climate and natural resource use Livestock production Health and nutrition

4 Policies and institutional change Drivers of change Changing diets Climate and natural resource use Equity and growth Livestock production Economic growth Health and nutrition Trade & marketing Energy prices
5 Surface temperature projections Source: IPCC's Fifth Assessment Report

6 Total population (billions) World population projection (UN 2012) 9.5 Billion 11 Billion 7 Billion Year Source: Gerland et al. 2014

7 Total population (billions) Continental population projection Year Source: Gerland et al. 2014

8 Human population in thousands Urbanisation in Kenya 90,000 80,000 70,000 60,000 Urban Rural 50,000 40,000 30,000 20,000 10,000 - Projections
9 Per capita GDP (US$ ppp 2009) GDP growth in sub-saharan Africa Year Source: IMF WEO, Standard Chartered Research 2011
10 GDP (US$ bn) GDP growth in sub-saharan Africa Selected African countries Source: Standard Chartered Research 2011
11 Per capita meat consumption (kg/year) Drivers of change USA Per capita meat consumpion (kg/year) China Japan 20 0 India Per capita GDP PPP) Per capita GDP (US$ ppp) Source: FAO 2009

12 The changing livestock sector Demographic and social drivers Population: + 32% or 9.6 billion people by 2050 Income growth: + 2% per year by 2050 Urbanization: 70% will live in cities by 2050 Growth in demand for animal source foods + 70% by million tonnes of meat Structural changes in the livestock sector Shift from ruminant to monogastric Intensification of production Impinges on global public goods Equity and growth Health and nutrition Climate and natural resource use
 Socio-economic challenges for adaptation Source: Herrero et al.")
13 Socio-economic challenges for mitigation African livestock futures GLOBIUM: partial equilibrium model to determine consumption, production, prices and trade for different livestock commodities Projections to 2050 were based on a spectrum of Shared Socioeconomic Pathways (SSPs) Socio-economic challenges for adaptation Source: Herrero et al. 2014

14 African livestock futures Some key results 3 fold increase in milk consumption to 2050 especially high growth in East Africa 6-7 fold increase in consumption of pork and poultry meat especially high growth in West Africa Overall, poultry consumption exhibits the highest rates of growth throughout SSA The consumption of meat from pigs and chickens will exceed red meat consumption by 2030 in most sub-regions of SSA Smallholder mixed crop-livestock systems are, and will remain, the main producers of ruminant products to 2050, under all scenarios Under SSP1 a low trade deficit (10%) can be maintained to 2050 Under SSP2 imports of milk and meat from monogastrics will double in relation to production Any negative deviation (SSP3) would make African livestock production largely uncompetitive negative outcomes for producers, consumers and continental food security Africa s food importation bill Total: US$ 44 billion Meat: US$ 5 billion Milk: US$ 4 billion Source: Herrero et al. 2014

15 Sustainable intensification Sustainable intensification will be key to elicit a production response in most regions of Africa Need to achieve rates of annual growth in productivity of around 6% per year Annual growth rates of livestock production: SSP1: Sustainability scenario > 5-6% SSP2: Business as usual 2-3% SSP3: Fragmentation scenario % Calls for an integrated, systems approach to sustainable livestock sector development Need reliable data and information to guide policy
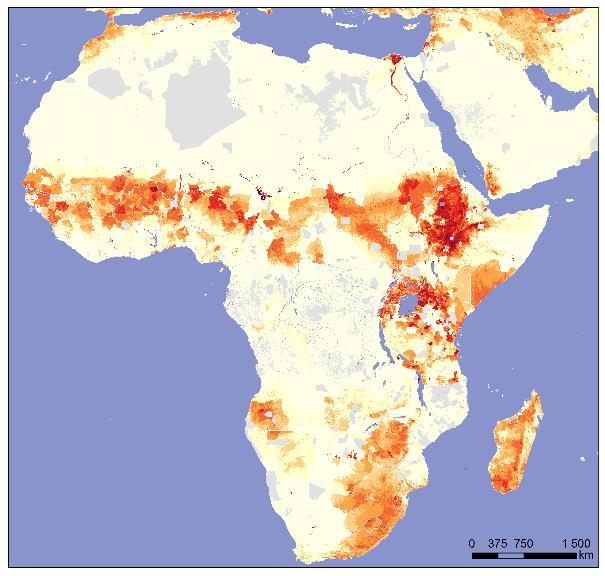


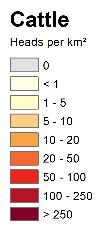
16 Distribution of cattle in Africa (2006) Gridded Livestock of the World Source: Robinson et al. 2014
 Source: Robinson et")
17 Ruminant production systems (v5) Livestock only arid & semi-arid Livestock only humid & sub-humid Livestock only tropical highlands Mixed rain-fed arid & semi-arid Mixed rain-fed humid & sub-humid Mixed rain-fed tropical highlands Mixed irrigated arid & semi-arid Mixed irrigated humid & sub-humid Mixed irrigated tropical highlands Urban areas Other (forest) Source: Robinson et al. 2011

 % intensive Intensive")
18 Monogastric production systems % backyard Extensive production Mapped based on rural population Livestock distribution Difference (total extensive) % intensive Intensive production
 From World Bank data Source: Gilbert")
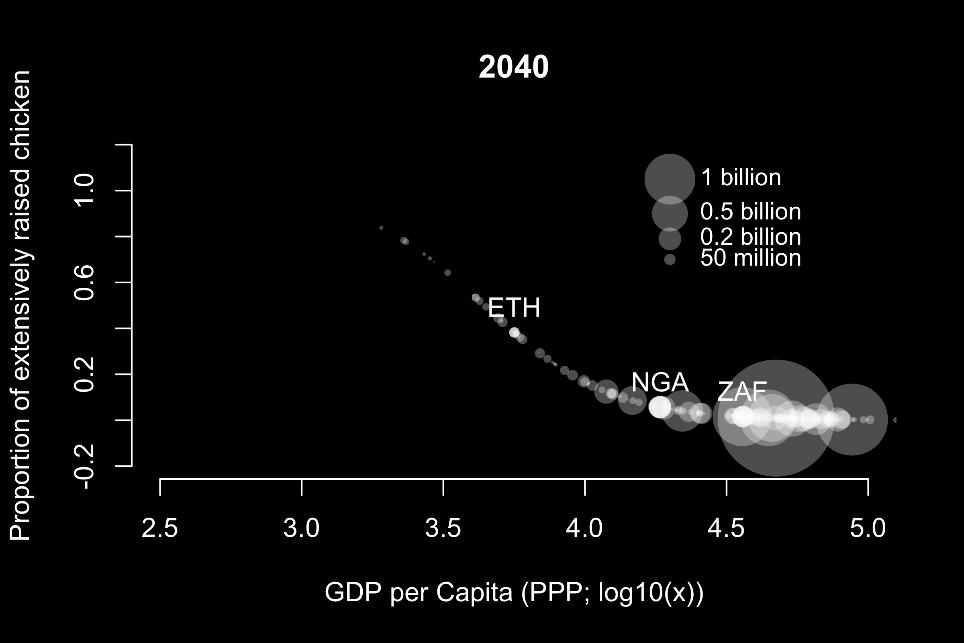
19 Proportion of extensively raised chickens Chicken systems Log per-capita GDP (US$/person/year) From World Bank data Source: Gilbert et al. 2015

20 Chicken systems Extensive chicken production Intensive chicken production Source: Gilbert et al. 2015

21 International Livestock Research Institute Food and Agriculture Organisation of the UN International Institute for Applied Systems Analysis Université Libre de Bruxelles Wageningen University University of Oxford

22 Mapping poor livestock keepers 165 million poor people in Africa depend on livestock for their livelihoods Livestock system Increases to 230 million PLK using the international $2.00 per day poverty rate Source: Robinson et al PLK Livestock only arid & semi-arid 22,582,000 Livestock only humid & sub-humid 7,456,000 Livestock only tropical highlands 653,000 Mixed rain-fed arid & semi-arid 51,394,000 Mixed rain-fed humid & sub-humid 41,647,000 Mixed rain-fed tropical highlands 28,343,000 Mixed irrigated arid & semi-arid 432,000 Mixed irrigated humid & sub-humid 139,000 Mixed irrigated tropical highlands 179,000 Other (forest) 11,701,000

23 Livestock emissions per unit of land Source: Gerber et al. 2013

24 Livestock emissions per unit of edible protein Source: Gerber et al. 2013

25 Nutrition: the double-edged sword We live in a world more than with 800 million hungry and 165 million stunted children Animal-Source Foods provide 17% of calories and 26% of protein Animal-Source Foods provide valuable micronutrients to the poor Over one third of all adults across the world 1.46 billion people are obese or overweight Between 1980 and 2008, the numbers of people affected in the developing world more than tripled, from 250 million to 904 million Livestock are key to both sides

26 Diseases related to livestock farming More than 2 billion are sickened each year from the food they eat Millions more die from zoonotic diseases that emerge from, or persist in, agricultural ecosystems Diseases recently emerged from animals make up 25% of the infectious disease burden in least developed countries and kill one in ten people who live there We have proven agricultural interventions which can tackle the diseases associated with agriculture $25 billion invested in zoonotic disease control would bring benefits worth $125 billion Source: Grace 2012

27 Emerging infectious diseases Zoonoses from wildlife Zoonoses from non-wildlife Drug-resistant pathogens Global distribution of relative risk of an EID event Vector-borne pathogens Source: Jones et al. 2008


28 Sources of antimicrobial resistance Antimicrobial (ab)use in medicine Intensive livestock and aquaculture growth promotion prophylaxis and metaphylaxis Therapeutic use Natural phenomenon in environment Aquaculture growth Source: P. Huey (Science)

29 Antimicrobial resistance The O Neill Report (2014) AMR infections currently claim at least 50,000 lives each year across Europe and the USA alone.. with many hundreds of thousands more dying in other areas of the world In 15 European countries more than 10% of bloodstream Staphylococcus aureus infections are caused by methicillin-resistant strains (MRSA).. closer to 50% in several of these Source: O Neill 2014
 to estimate current proportions extensively raised chickens (globally) GDP PPP values and projections until 2020 from the IMF Projections beyond 2020 are based on regional growth rates and")
30 Intensification trajectories Model described in Gilbert et al. (2015) to estimate current proportions extensively raised chickens (globally) GDP PPP values and projections until 2020 from the IMF Projections beyond 2020 are based on regional growth rates and convergence scenarios (Leimbach et al. 2015) Poultry intensification trajectories, highlighting the changes in Nigeria, South Africa and Ethiopia as examples ILRI, Mozambique, Stevie Mann
31 Intensification trajectories
32 Intensification trajectories
33 Intensification trajectories
34 Intensification trajectories
35 Intensification trajectories
 countries")
36 Antimicrobial use in livestock Total consumption in the livestock sector in 2010 estimated at 63,151 tons Global antimicrobial consumption will rise by 67% by 2030 It will nearly double in BRICS (Brazil, Russia, India, China, and South Africa) countries
 Source: Van Boeckel et al.")
37 Antimicrobial resistance Global antimicrobial consumption in livestock (mg per 10km pixel) Source: Van Boeckel et al. 2015


38 Antimicrobial resistance The European Union banned the use of antibiotics to boost animals' growth in 2006 There is a voluntary ban in the USA Chick-fil-A, McDonalds and Costco Very difficult to regulate in the developing and emerging economies Concerted action multi-stakeholder platforms Strengthen the evidence base linking agricultural use to AMR in the medical sector Appropriate approaches in different settings poor countries may not have the resilience or capacity of Europe in withstanding a blanket ban, for example This is a global issue and calls for a coordinated, global response
 The required annual growth in productivity is around 6% per year Sustainable intensification will be needed to achieve this: equity environment health This calls")
39 In conclusion Rapid demand growth for Animal Source Foods in Africa especially milk, pork and poultry African production can only meet this demand, avoiding a growing trade deficit, under a sustainable growth scenario (SSP1) The required annual growth in productivity is around 6% per year Sustainable intensification will be needed to achieve this: equity environment health This calls for integrated, systems-based solutions to guide sector development along a sustainable pathway The need for action is urgent if African livestock production is to meet its growing demand
40 Thank you!