Myanmar s Rural Transformation:
|
|
|
- Tyrone Rose
- 5 years ago
- Views:
Transcription
1 Myanmar s Rural Transformation: Evidence from Ayeyarwady & Yangon Ben Belton & Duncan Boughton (Michigan State University) US Embassy, Yangon 14 December, 2016
2 Outline What do we mean by rural transformation? Historical context A case study of rural transformation in Yangon and Ayeyarwady: Data Migration and wages Mechanization Credit Rural Non-Farm Economy Crop Profitability Conclusions
3 Why does rural transformation matter? Rural transformation refers to the process of growth and diversification of the rural economy, resulting in higher incomes from both farm and off-farm employment Agriculture can play a key role as a driver of rural economic growth and poverty reduction in all major SEA countries: A large share of increased smallholder farm incomes are typically spent in the local economy, spurring growth in the rural non-farm economy (RNFE) Increases in smallholder farm incomes come from productivity growth (yields) and a shift from low value food staples to high value enterprises, generating demand for off-farm goods and services (transportation, processing, cold storage) The stronger the synergies between growth in the farm and growth in the non-farm components over time the more sustainable the transformation Especially important in countries/regions with strong comparative advantage in agriculture Public policies and investments have the potential to foster or hinder this virtuous growth cycle -> hence need to know what is actually happening on the ground
4 (Recent) historical context 70% rural, 38% GDP agricultural World Bank Myanmar farm production economics survey (conducted 2013/14, published 2016): The level of agricultural mechanization in Myanmar is still low not a surprise given the low wages in rural areas, the excess agricultural labor, and the still-lacking infrastructure and regulatory environment for machinery service providers. Farmers in general do not have the access to longterm capital, preventing investments in agricultural machinery BUT, by mid-2016 we find evidence of very rapid change in Ayeyarwady and Yangon regions, close to Yangon
5 The Myanmar Aquaculture-Agriculture Survey Aims Baseline of information on fish and crop farming sectors Quantify and compare spillovers & trade-offs between these Explore mechanization, credit, rural non-farm economy Methodology Purposively selected 2 clusters of village tracts for comparison, based on concentration of fish ponds and prevailing crop farming systems Randomly selected communities and households to represent entire population of both clusters (including non-farm households) Total sample = 1102 HHs in 40 village tracts Community survey (73 villages) Survey of agricultural machinery supply businesses

6 Survey locations

7 68% of villages surveyed cannot be accessed by car during monsoon season

8 Average distance to nearest paved road = 3.1 miles 88% of villages have no access to public electricity

9
10 Rapidly accelerating rural-urban migration post Urban Rural % of HH have migrants 55:45 male/female split Average migrant age 21 8% international 70% employed in manufacturing Rural-rural migration from remoter areas for fulltime agricultural work 80% of HH with migrants receive remittances Cumulative share of current migrants by year migrated (%)

11 Contribution of remittances to off-farm income is relatively small Contributions to total off-farm income, by source of income
12 Real wage increases Real daily wages (MMK) % +32% Main impact of migration is on rural labour supply and wage rates Average real daily wage for male agricultural labour ( )
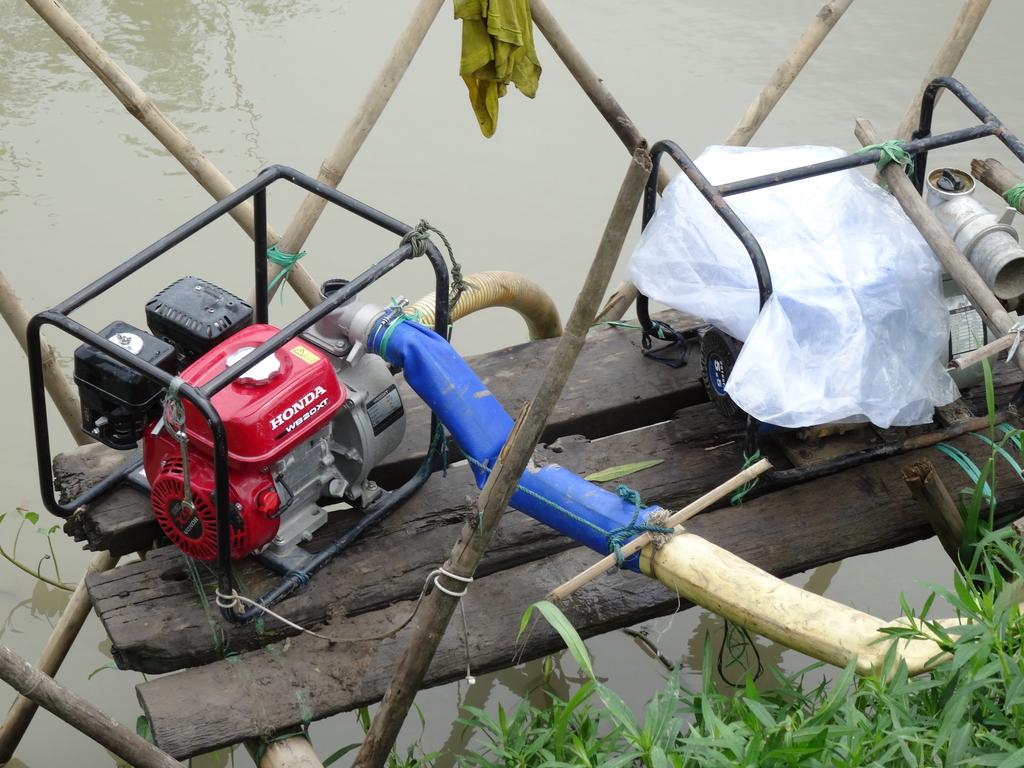
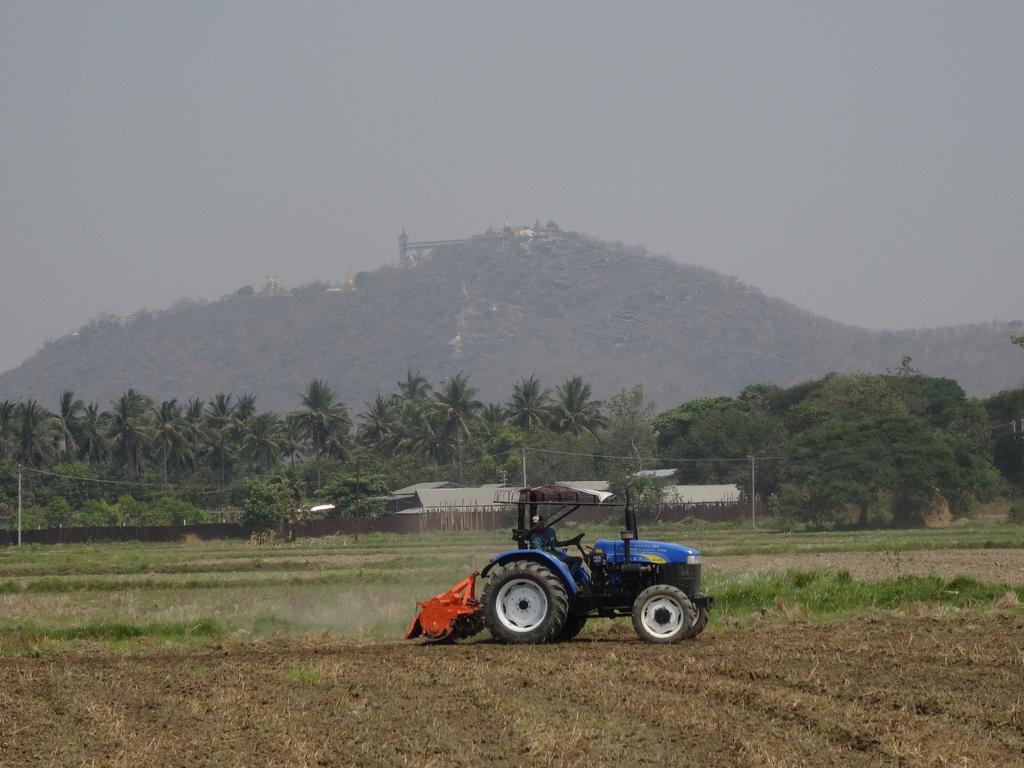
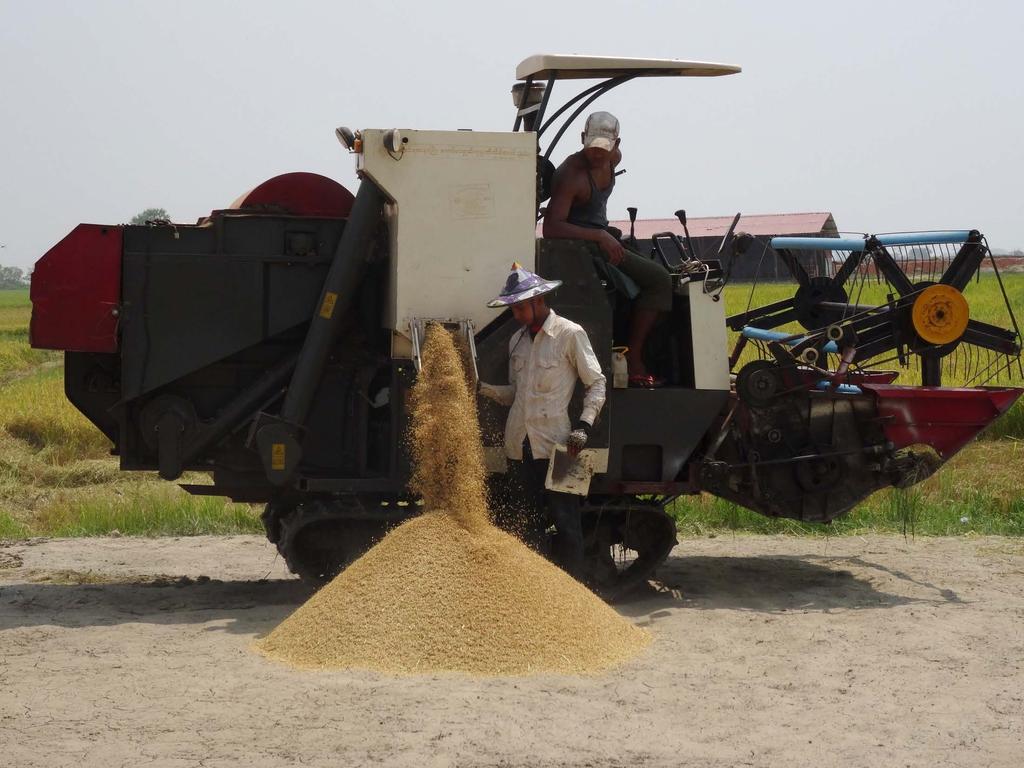
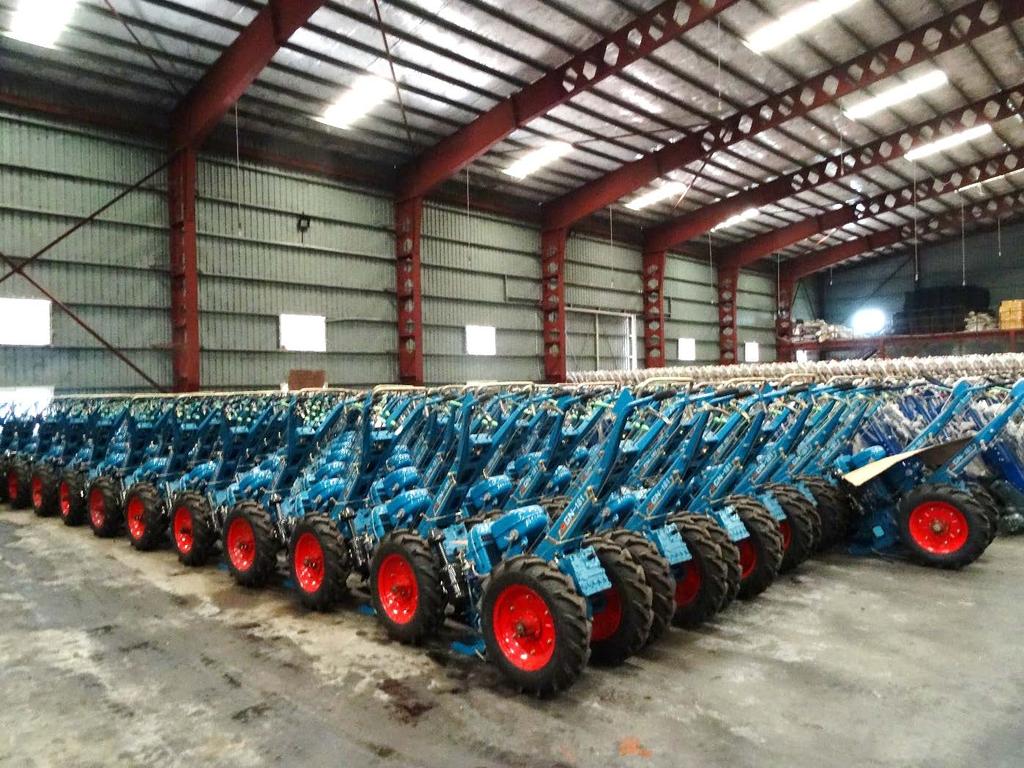
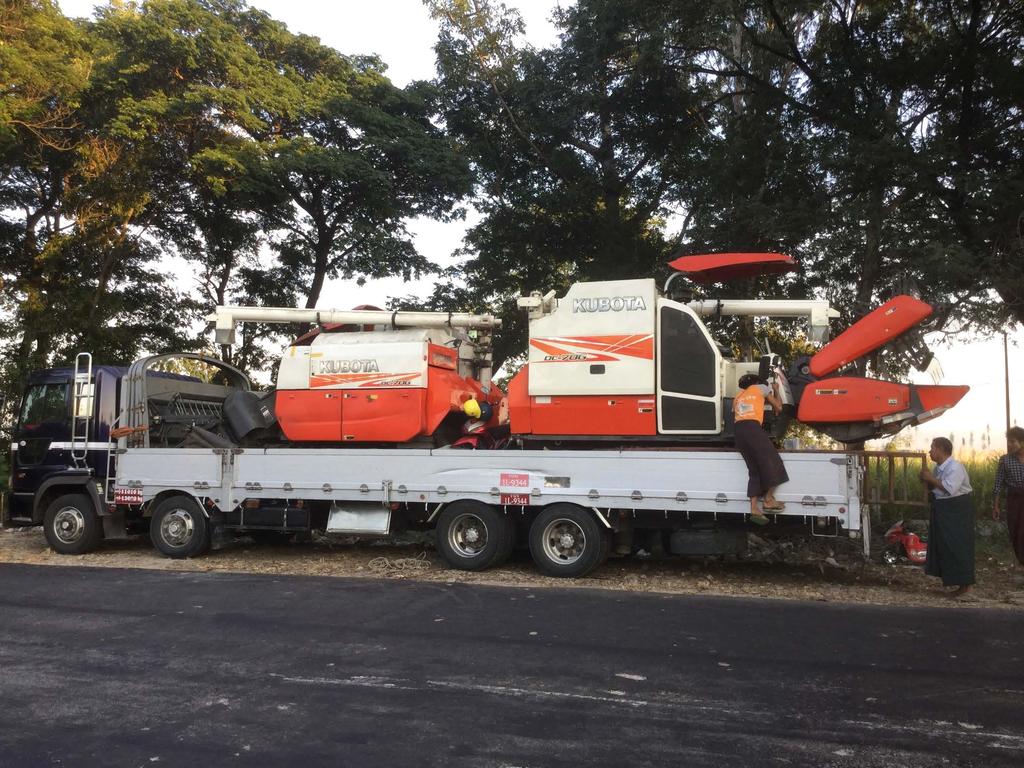
13 Labour shortages & rising wages driving mechanization Total purchase value (Million MMK) Combine Surface-water Pump Thresher 4WT 2WT Real annual value of agricultural machinery sales, by year and machine type ( )
14
15
16
17
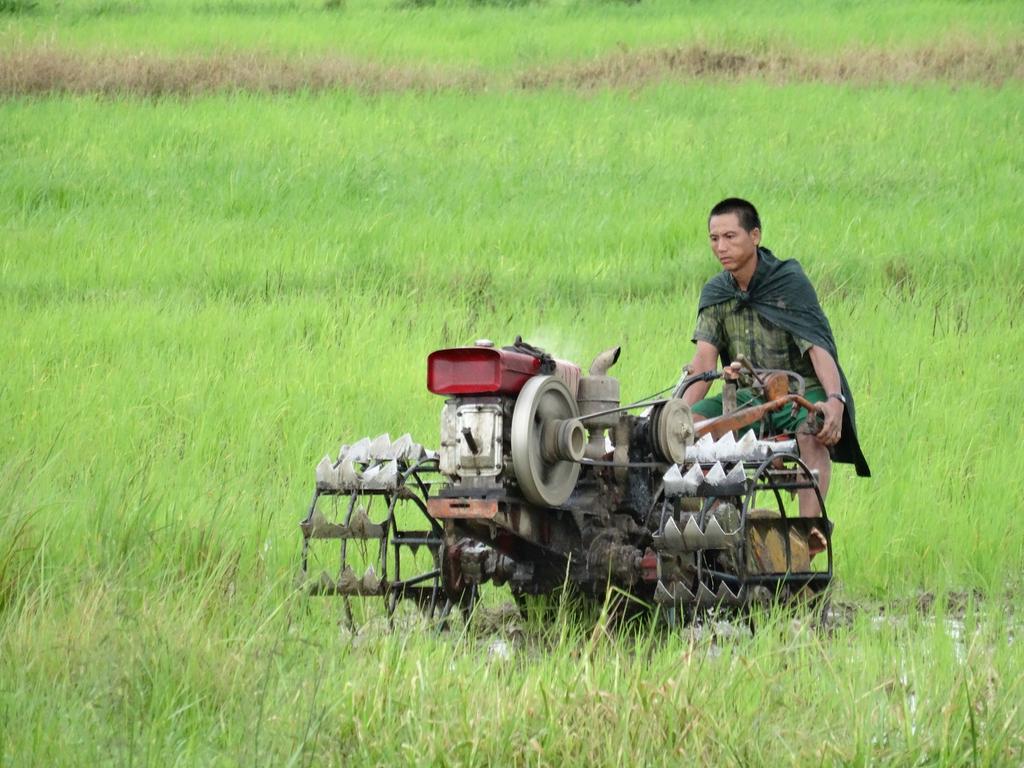
18 Scale-neutral technology % of farm households using <5 acres >5 & <10 acres >10 acres WT (Land Preparation) 4WT (Land Preparation) Combine (Harvesting)
19 Adoption supported by rental services Machine Use for Land Preparation Machine Use for Harvesting % of households using machinery Own Rented in Other Own Rented in Other
20 Mechanization supported by more affordable machines WT Surface Water Pump Real purchase price ('000 MMK) %/yr -5.8%/yr 0 Real purchase price of two-wheel tractors & water pumps,
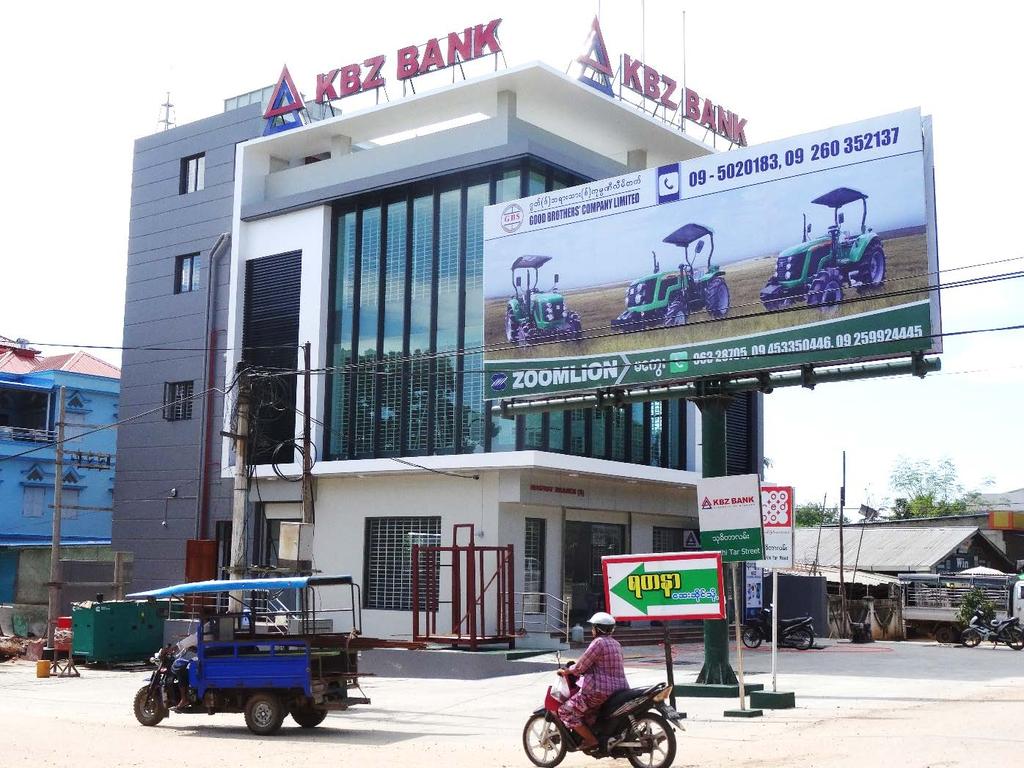
21 Improving access to formal financial services Share of sales (%) WT 4WT Combine Harvester Bank Dealer Customer Source of finance for machinery purchases (2016) Hire purchase agreements with commercial banks began in 2013 Reduced capital constraints for machine suppliers, cost of credit to buyers Role of LIFT loan guarantee scheme with Yoma Bank
22 Geographical spread of machine supply businesses Kachin Kachin Kachin Sagaing 1 Sagaing 3 Sagaing 5 Chin Mandalay 16 Shan Chin Mandalay 16 Shan Chin Mandalay 20 Shan Magway 2 Bago 7 Rakhine 1 Kayah Kayin Magway 5 Rakhine 1 Bago 9 Kayah Kayin Magway 10 Bago Rakhine 1 9 Kayah Kayin Ayeyarwady 5 Yangon 29 Mon Ayeyarwady 9 Yangon 36 Mon 1 Ayeyarwady 15 Yangon 38 Mon 2 Tanintharyi 2 Tanintharyi 2 Tanintharyi 3
23
24
25
26
27 Sources of credit diversifying % of villages with access Access to credit improving due to MFIs and cooperatives Average rates of interest paid on informal and semiformal loans fell from 72% in 2011 to 60% in 2016 Share of villages with credit access by source ( )
28 Rapid growth of non-farm enterprise Mean businesses/village % Motor transport +52% Shops % Personal services +36% Food services Crafts - 45% - 56% Agricultural trade Change in average number of businesses per village, From , motor vehicles replaced boats as main mode of transport: average journey times to fell 20-30%. Increasing mobility: 44% of workers in fulltime employment travel beyond local area but remain resident Village stores have attained almost total ubiquity (96% of villages)
29 Gendered employment characteristics Workforce participation, by occupation & gender Gender income ratio, by occupation % 43% 44% 47% 26 73% 57% 56% 53% Agricultural wage labor Men Salaried employment Women Non-farm enterprise (middle tercile) Non-farm enterprise (top tercile) Agricultural wage labor Men Salaried employment Women Non-farm enterprise (middle tercile) Non-farm enterprise (top tercile)

30 Household participation in farm and off-farm employment by expenditure quintile Off-farm employment plays a major role in livelihoods for households in all income and landholdings groups

31 Agriculture still the major source of primary employment Agriculture directly provides >70% of primary employment, plus indirect employment in value chains Share of individual primary employment, by type
32 Incipient agricultural intensification 100% 80% 60% 40% 20% 0% Main paddy crop (% of HH reporting) Monsoon Dry season % of paddy farms applying herbicide Monsoon Dry season % of HH planting improved rice variety Paddy yield (baskets/acre) Monsoon Dry season Monsoon Dry season
33 Agricultural productivity still low Gross margin/acre (USD) Gross Margin/acre (USD) Green Gram Monsoon Paddy Median = $200/acre Median = $100/acre Median agricultural land = 5.5 acres; Typical annual agricultural income = $1650/HH, or $330/capita
34 Conclusions Rapid rural transformation taking place close to Yangon, driven by migration Migration driven by urban growth & industrialization post 2012 Leading to: Labor shortages, rising wages Mechanization of agriculture, growth of RNFE Growth of RNFE, supported by: Greater mobility (transport services), deeper market integration (labour, inputs, outputs), improving access to and terms of credit Mechanization supported by: Expansion of formal finance, falling machine costs, thriving rental markets, scale neutrality Many households stepping out and hanging in Need support for stepping up productivity & diversification in agriculture