EU Petrochemicals Industry:
|
|
|
- Asher Craig
- 5 years ago
- Views:
Transcription

1 EU Petrochemicals Industry: Analysis of Competitiveness and exposure to International Competition High Level Group, Ad-hoc group Competitiveness and Trade with other regions, Brussels, June 26, 2008
2 Petrochemicals Industry Allows conversion of crude oil & gas into products Petrochemicals are main building blocks for manufacturing all base chemicals & most consumer goods Active contributor to Lisbon agenda through Its ability to create value Its capacity to develop innovative solutions Its integration and infrastructure 4580 industries with 357,000 direct employments Producing 50 Bn of direct added value (3 % NACE D) Highest labour productivity (+245%) Production slowing down since 2002 Trade balance still positive but weakening 2
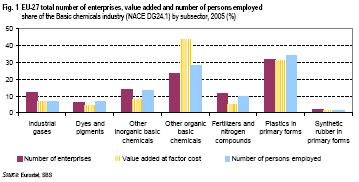
3 Petrochemicals Industry 3
4 4
5 Petrochemicals Industry Sectors Exposed to International Competition represents: 75% of extra-eu Trade (exp. + imp) 27% of production volume Nearly 80% of Exports More than 70% of our imports 5
6 Exposure to International Competition: monomers are not exposed 6
7 Olefins Exposure (ii) Including olefins contained in derivatives European Olefins Production Y (Production) D (demand) Imports: of Base Imports contained M (imports incl. Exports: of Base Exports contained X (exports incl. Chemical in Derivatives contained in derivs) Chemical in Derivatives contained in derivs) Production Ethylene Production Propylene Production Butadiene Production Benzene from pygas Total High Value Chemicals Note: have assigned all imports & exports of benzene a Exposure = 21.6% Includes estimates of olefins contained in LDPE, LLDPE, HDPE, EO, MEG, EB, styrene, PS, EDC, VCM, PVC, PP, ACN, cumene, phenol, PO, n- butanol, 2-EH, SBL, PBR 7
8 Aromatics Exposure (ii) Including aromatics contained in derivatives European Aromatics Production Y (Production) D (demand) Imports: of Base Imports contained M (imports incl. Exports: of Base Exports contained X (exports incl. Chemical in Derivatives contained in derivs) Chemical in Derivatives contained in derivs) Production Benzene (excl from olefins pygas) Production Cyclohexane Production Mixed Xylenes Production Ethyl Benzene Production Paraxylene Total High Value Chemicals Exposure = 34.9% Includes estimates of aromatics contained in EB/Styrene/PS, cumene, phenol, aniline, KA Oil, caprolactam, adipic acid, nylon polymer/fibre/yarn, PTA, DMT, polyester resin/fibre/yarn, PET resin. (Have avoided double counting of EB, cyclo and MX and their derivatives.) 8


9 Exposed to International Competition: Trade (Exp +Imp) ratio 9
, EU Comm.")
10 Base Organic Chemicals (Code NC 29): Exposed to International Competition (OECD Exposure Ratio > 55%), EU Comm. Ratios (Trade exposure > 60%, 6 Import exposure >26%) 10
/(Exports + Imports): 1996")
11 Trade Competitiveness Indicator, TCI= ( Exports-Imports)/(Exports + Imports): 1996 versus
 EU chemicals Industry is Loosing its comparative Advantage with key leading countries in Asia Period")
12 The EU has a trade surplus with seven out of the nine countries analysed. EU has a trade deficit in specialty chemicals with advanced chemicals producing areas (USA, Japan) EU chemicals Industry is Loosing its comparative Advantage with key leading countries in Asia Period 1: average ( ), Period 2: average ( ), Delta Analysis = TCI 2-TCI1 Trade = Exports + imports, Balance = Exports Imports, TCI: Trade Competitiveness Indicator = Balance/ Trade 12
13 Trade flows show a competitive position at risk for 50% of the countries (or sectors) analysed Organics 40% Specialities 23% Middle East 9% Japan 9% Brazil 3% India 3% USA 42% Consumer Chemicals 12% Basic Inorganics 11% Polymers 14% Rest of Asia 15% EU has a trade deficit and its competitive position weakened China 8% South Korea Russia 8% 3% EU has a trade surplus but its positive competitive position weakened EU has a trade deficit but its weak competitive position improved EU has a trade surplus and its healthy competitive position improved 13
14 Trends & perspectives EU trends Limited investment in capacity expansions Growing demand in EU and Extra EU Favourable position on Propylene derivatives Increased supply through debottlenecking only Margins collapsing in 2007 due to higher naphtha prices EU perspectives Reduced demand in EU or at exports due to economic slow down Zero to negative margins due to highest naphtha prices Loss of competitiveness vis-à-vis middle east Increased imports due to massive capacity expansion extra EU Absence of investment capacity in EU 14
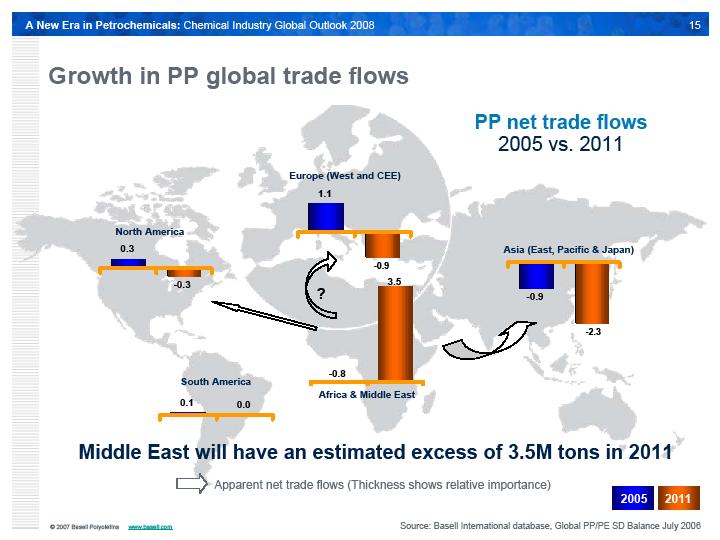
15 15
16 16
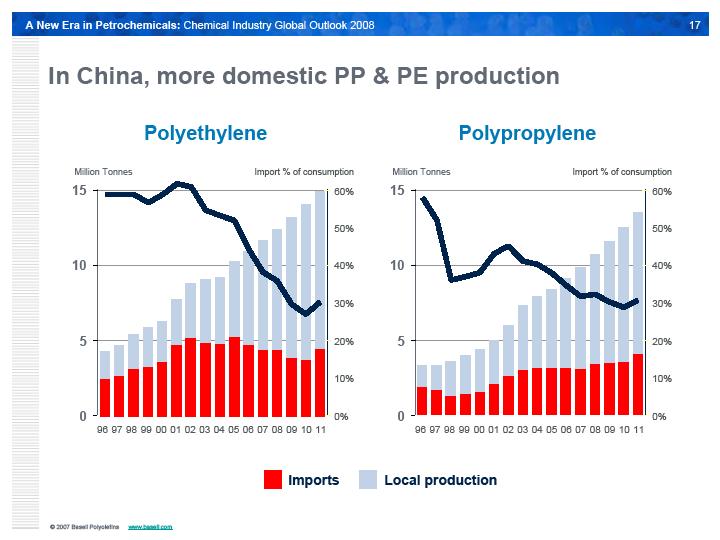
17 17

18 Global Ethylene Capacity Trend Capacity (millions of tonnes) By 2015, Middle East will account for 20% of the global C2= capacity % + 230% Middle East China Rest of Asia Japan Europe North America Others Source: Parpinelli TECNON 18

19 Middle East / Asia Interdependence - Increasing exports from ME to other regions 80 Demand & Supply of Selected Ethylene Derivatives (PE + MEG) Middle East Production Asia Pacific Production Middle East + Asia Pacific Demand Will be placed in other regions Millions of tonnes Source: Parpinelli TECNON 19

20 Changing Trade Flow Pattern of Ethylene Derivatives Net Trade (mlns of tonnes Ethylene Equivalent) (10) (20) (30) Exporter NA is the primary exporter Importer NA & ME are the primary exporters ME is the primary exporter North America transitions from net export to net importer ME is the only net exporter North America Western Europe Asia-Pacific Middle East Source: CMAI 20
21 ME exports target AP first, then WE/NA Net trade*, mln tonnes Net imports Overflow Net exports Primary AM EU ME AP * Ethylene in derivatives and monomer Source: CMAI 21
 2007)")
22 Global Petrochemicals Analysis: Steam Cracker, Average Cash Margins (US$/tonC2, Q2-2007) 2007) 22


23 The impact of additional CO2 cost will remove the capacity to invest 23
24 Ethylene Pricing 1,800 Ethylene Contract Price $/t 1,600 1,400 1,200 1, West Europe U.S. Northeast Asia Source: CMAI Most of the world s ethylene is sold by reference to published regional contract prices. There is clearly a strong correlation between prices, though there are short-term deviations. 24
25 Benzene Pricing 1,400 Benzene Contract Price 1,200 1, Source: CMAI $/t West Europe U.S. Northeast Asia Most of the world s benzene is sold by reference to published regional contract prices. There is clearly a strong correlation between prices, though there are short-term deviations. 25
26 PX Pricing 1,600 PX Contract Price 1,400 1,200 1,000 Source: CMAI $/t West Europe U.S. Northeast Asia Most of the world s PX is sold by reference to published regional contract prices. There is clearly a strong correlation between prices, though there are short-term deviations. 26
27 Global perspectives for the sector EU Petrochemicals will face increasing pressure due to Additional imports related to new capacity extra EU Highest feedstock and energy prices ever seen (150$) EU Petrochemicals can not pass costs through due to high level of exposure to international trade (>20%) Global market supply & demand based pricing Very small operational margins (0% to 5%) This will put the sector at significant risk of closure if the down cycle is long and if additional costs jeopardize the capacity to invest (ex: IPPC, ETS etc) 27
28 Recommendations Encourage measures which Enhance integration (clusters & infrastructure) Make Europe attractive for investment Infrastructure, transport, storage, services Tax regime R&D Education, availability of qualified workers Security of supply Harmonized legislation Political stability Enhance international agreements Trade Energy supply HSE legislations 28
29 Recommendations Discourage measures which Distort the market such as Double pricing (ethane, natural gas etc) Price dumping Barriers to trade Lower standards in workers safety Lower environmental standards Create uncertainty such as Continuous revisions of regulations Uncertain targets or thresholds Lead to disproportionate impact on investment capacity 29
30 Conclusions The Petrochemical sector is an essential contributor to EU economy & to employment Innovation in technologies and materials Climate change through solutions provided by products The pillars fo the Lisbon agenda Due to its high integration base petrochemicals can not be removed from the chain without risk of loosing the whole chain There is a risk of becoming dependant from imports of building block essential to development of technologies 30