Mapping major crops using Sentinel Images for Nepal
|
|
|
- Melinda Murphy
- 5 years ago
- Views:
Transcription


1 Mapping major crops using Sentinel Images for Nepal (Strengthening Agriculture Advisory by Establishing Agriculture Information Dashboard) SARI workshop, Delhi, May 2-4, 2017 Nabin Kumar Yadav, Faisal Qamer, Mir Matin International Center for Integrated Mountain Development (ICIMOD)
2 Outline Introduction Method overview Pilot study results


3 Agriculture monitoring to support food security analysis and agriculture policies decision in HKH region Improving knowledge of agriculture system using remote sensing and GIS technologies to support food security related decisions Developing operational service to provide support on ground functional decision making related to agriculture practices Assess vulnerability in changing climate by integrating information on biophysical, climatic and social aspects


4 Agriculture area dynamics in Nepal Agricultural Area ,600,000 1,400,000 Crop area (ha) 1,200,000 1,000, , , , ,000 0 Rice, paddy Maize Wheat Mustard seed Barley


5 Operationalizing Agriculture monitoring system in Nepal SERVIR Phase I Legend NDVI The preliminary assessment of paddy crop sown area based on MODIS NDVI data of 177 and 193 Julian days of 2015 shows that there is 3% increase in area as compared to that of 2014 and 12% decrease as compared to An additional image of August 12 can give more clear result since the transplantation process is still going on.

6 Strengthening Agriculture Advisory by Establishing Agriculture Information Dashboard
7 Mapping major crop type Piloting Study area


8 Methods Understanding system Interpretation of NDVI curves for Agriculture area mask based on Landsat 8(2014 to 2016)

 Atmospheric correction Cloud,")
 Decision rule")
9 Methods Agriculture area mask The Agriculture mask is a binary map separating annual cropland areas and other areas. Unsupervised Classification Validation using Google Earth DEM 5m Landsat 8 (2014 to 2016) Atmospheric correction Cloud, shadow and water masking Seasonal crop map of 2014,2015 and 2016 Annual Binary map( crop and non crop) Decision rule Agriculture area mask


10 Crop type mapping Agriculture mask Time Series Sentinel-2 data Crop type map, Chitwan Time Series Sentinel-1 VV Pol. data Rice Sowed Field Decision rule Methods Crop Calendar Maize Wheat Rice Mustard 1. Main season 2. Winter Season 3.Spring Season 1.Spring rice 2.Main season 1. Brassica compestris Jan Feb Ma No r Apr May Jun July Aug Sep Oct v Dec Minimum Mapping Unit ~ 1 ha
11 Pilot I Chitwan district

 and Terai region (0.8%).")
12 Study area: Pilot - I Field work Pilot Study area Total area : 2,218 sq.km Major crop type : Rice, Mustard, Maize and Wheat. Lies on Siwalik region (86.5%),Mid-mountain region (12.7%) and Terai region (0.8%). Elevation of the district ranges from 244m to 1945m.


13 Summary of field data collection Field survey was carried out during Dec 2016.Around 263 points were collected. Field work Out of 263 points pure pixel(4 4 pixel) for major crops were used for interpreting NDVI profile. These profiles were used for identifying phenological changes of crop and threshold value for crop type mapping. Questionnaire and focus group discussion were carried out to update crop cycle calendar and identify crop pocket area


 Oct/Nov Mar/Feb 90")

 Nov Mar/April 120 days crop")
 Mustard 1.")
14 Crop calendar based on agronomy expert and focus group discussion Crop type Type Sowing Harvesting Remarks Maize 1. Main season May/Jun Sep/Oct 90 days crop cycle 2. Winter Season Oct/Nov Mar/April 3.Spring Season Feb/Mar May/Jun Wheat Nov/Dec Apr/May 120 days crop cycle Rice 1.Boro rice Feb May 2.Spring rice Mar June/July 3.Main season July/Aug Nov Mustard 1. Brassica compestris (Tori) Oct/Nov Mar/Feb 90 days Field work Maize Wheat Rice 1. Main season 2. Winter Season 3.Spring Season 1.Boro rice 2.Spring rice 3.Main season 2. Bassica juncea (Rayo) Nov Mar/April 120 days crop cycle 3. Bassica compestris (Rar Yellow Sarson) Mustard 1. Brassica compestris (Tori) 2. Bassica juncea(rayo) 3. Bassica compestris(rar Yellow Sarson) Oct March Jan Feb Mar Apr May Jun July Aug Sep Oct Nov Dec
 (b) Smoothening To improve")


 NDVI 0.8 0.6 0.4 0.")
15 Pre processing of Sentinel-2 Atmospheric correction (a) (b) Smoothening To improve profile interpretability, a smoothing algorithm was applied to the extracted data to remove changes in NDVI that are not related to the growth of the crop. Fourier filter were used for smoothening NDVI with 7 7 window size 1.0 Smoothed Unsmoothed 2 per. Mov. Avg. (Unsmoothed) NDVI Figure (a) Level 1c (b) Level 2A 0.0 Level 1C Level 2A Original Processed


 1.")


16 Temporal cropping patterns and defining decision rule (a) 1.0 Mustard Spring Rice Main Rice Decision rules Crop Type Sowing NDVI Growing NDVI Harvesting NDVI NDVI Rice June Sep Nov/Dec Oct Dec Jan Mar Apr May Jun MONTH Aug Oct Nov Mustard Nov Jan Mar < 0.25 (b) 1.0 Wheat Main Rice Wheat Nov/Dec < 0.45 Jan Apr <0.4 NDVI (c) NDVI Nov Nov Dec Dec Feb Jan Feb Mar Mar Apr Mar Apr May MONTH May Jun MONTH Jul Sep Jul Aug Sep Oct Main Rice Oct Nov (d) NDVI Oct Dec Mixed Jan Mar Apr May Jun MONTH Aug Oct Nov


17 Mapping Rice Radar can see through all weather conditions essential in cloud-prone and is highly sensitive to changes in waterlogged ground such as rice paddies. During the sowing period of rice field is flooded with standing water in the month of July August. This results in very low backscatter. Methods June,2016 June,2016 Identifying rice sowed field Rice Sowed field Figure : Monthly processed Backscattering sentinel 1 images


18 Methods Mapping Rice sowed field Sentinel-2 MSI False- Color Infrared March June July NDVI Spring Rice Main Rice Oct Dec Jan Mar Apr May Jun Aug Oct Nov RED B4 Green B3 Blue B2 MONTH
 Mustard 10 80 2 3 95 84.21% 15.79% Banana 0 3 21 1 25 84.00% 16.00% Wheat 3 6 2 50 61 81.97% 18.03% Column Total 104 94 26 60 284 87.50% 85.11% 80.77% 83.")
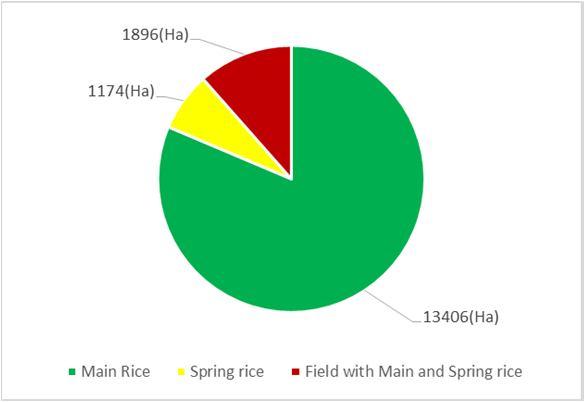
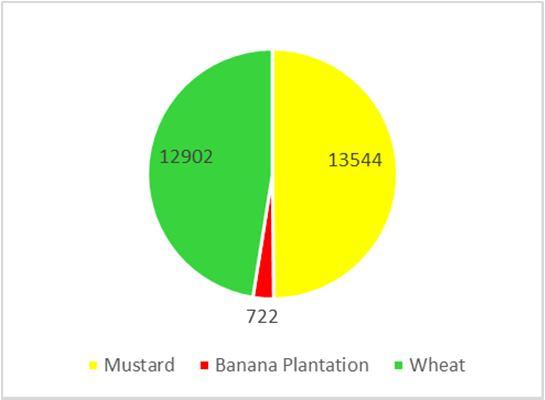
19 Accuracy Assessment and area estimation Class Name (Classifies/Reference) Reference Others Mustard Banana Wheat Row User's Commissio Tota Accurac n error l y % 11.65% Others(Forest, Settlement, Water) Mustard % 15.79% Banana % 16.00% Wheat % 18.03% Column Total % 85.11% 80.77% 83.33% Omission error 12.50% 14.89% 19.23% 16.67% Overall Accuracy 85.21% Crop area estimation VDC wise
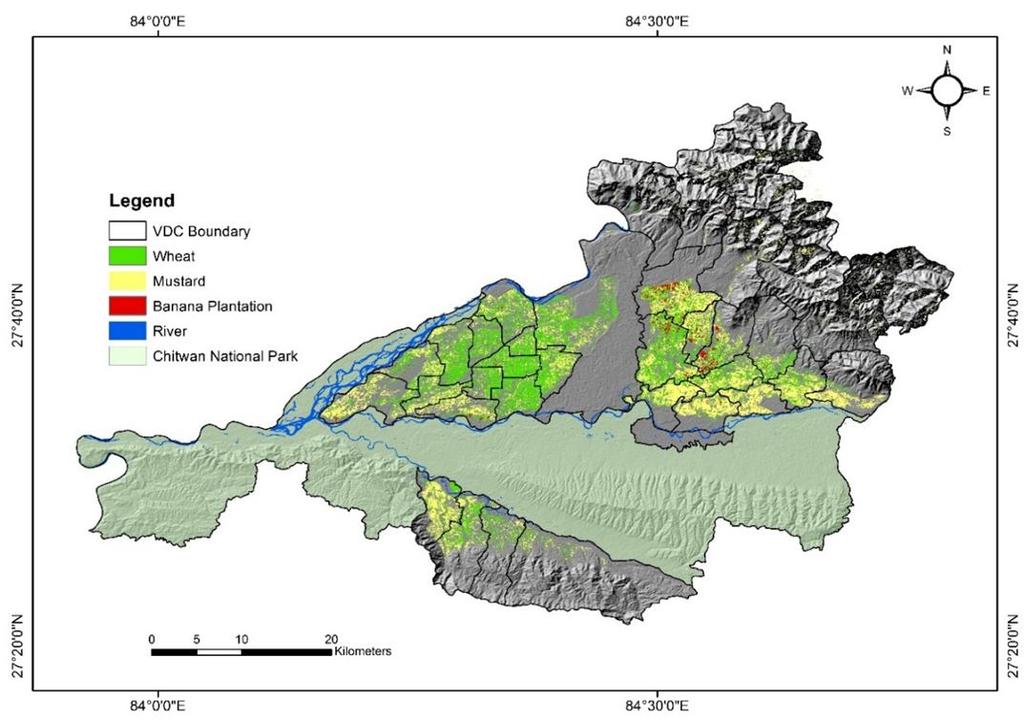
20 Results
21 Future plan Six to eight districts based studies will provide basis to automate crop type mapping and in-season crop sown area assessment for entire Nepal using machine learning algorithms and cloud computing platforms Institutional engagement with MoAD to re-establish baseline crop area statistics so that EO technologies can be adopted for regular institutional assessments Inclusion of operational high resolution biophysical parameter like Leaf Area Index(LAI) for crop yield assessments

22 Thank you
23 Methods Time series Landsat 8(2014 to 2016 ) Value addition for monsoon crop Sentinel 1 VV Pol Time Series Images Sentinel 2 Level 1c Agriculture area mask Atmospheric correction Cloud, water and shadow masking Unsupervised Classification Annual binary cropland map Cropland mask Calibrate ( Sigma 0_VV ) Filtering Geometric and terrain correction Binarization ( water and non water ) Mask Rice sowed field Sentinel 2 Level 2A NDVI stack (based on crop season ) Smoothening NDVI stack Phenological curve based on pure pixel from field data Identifying sowing, growing and harvesting period Phenology based Crop type map Geospatial integration Decision rule based on NDVI value Accuracy assessment Field Data Area estimation Crop type map


24 SIREVIR HKH - Framework for Agriculture and Food Security Services Food Security Information System in Nepal In season-wheat crop sown area in Afghanistan Strengthening Agriculture Advisory by Establishing Agriculture Information Dashboard Establishing/enhancing drought monitoring system in Afghanistan, Bangladesh and Pakistan