2/19/2014. Bunge North America. Highlights of the Past 12 Months. US Weather
|
|
|
- Bernice Crawford
- 5 years ago
- Views:
Transcription

1 Bunge North America Flat Price Risk Virginia State Feed Association Conference And Nutritional Management Cow College February 2014 Foreign Currency Commercials/Funds (Boards of Trade) Freight Weather / Crops World Market Supply/Demand Price Extreme Events Political Events Local Supply/Demand Cost / Margin Structure 1 1 JANUARY Highlights of the Past 12 Months US Weather Correction of 2012 US Drought Exceptionally late US Spring Planting Extremely tight corn and soybean September 1 ending stocks Record US corn crop Record South American soybean crop 2014 Near record US soybean crop 2014 PEDv outbreak Chinese bird flu Record US stock prices Re-election of Cristina in Argentina 3 4 1


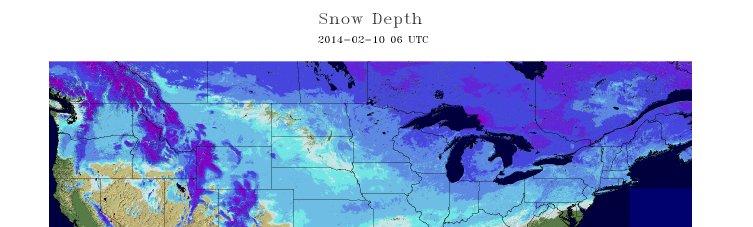
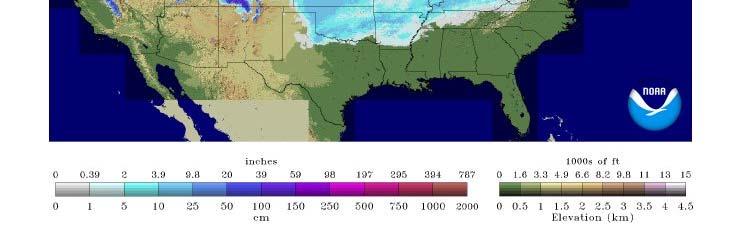
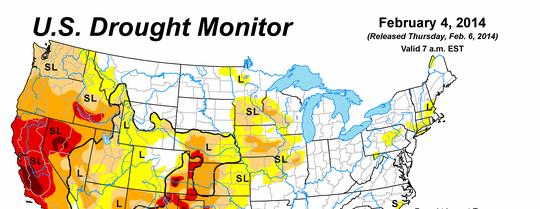

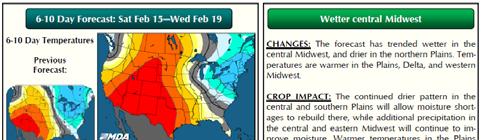
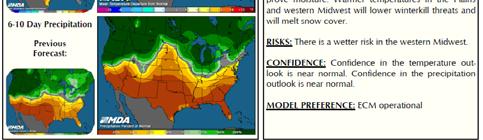
2 2014 Virginia State Feed Association & Nutritional Management "Cow" College Snow Depth 5 6 US Drought Monitor 7 US 6 10 Day Outlook 8 2


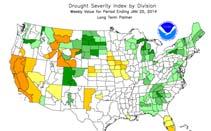
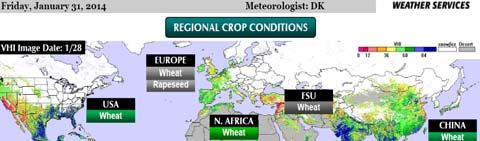
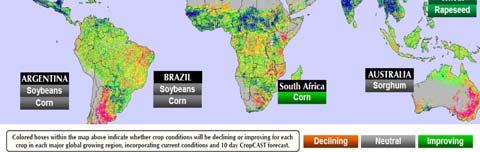
3 US Day Outlook US - January 9 10 US Soil Moisture World Crop Story
4 US Commodities- Henry Graves US Expected Margins, Net Variable Costs USDA Planting Intentions Report March /acre $/ Corn Soybeans HRS Cotton Sorghum SRW+dcsb US TOTAL PLANTED ACREAGE SUMMARY (1,000 Acres) 2014 Trade 2014 Trade Range High Range Low Hay Harvested 59,872 55,633 55,653 56,260 Winter Wheat Planted 37,335 40,646 41,324 43,090 Durum 2,560 1,369 2,123 1,470 Other Sprg Wht 13,698 12,394 12,289 11,596 All Spring wheat 16,258 13,763 14,412 13,066 Corn 88,192 91,921 97,155 95,365 90,000 94,000 Sorghum 5,404 5,481 6,244 8,061 Barley 2,872 2,559 3,637 3,480 Oats Planted 3,138 2,496 2,760 3,010 Rye 1,211 1,266 1,300 1,446 Soybean 77,404 74,976 77,198 76,533 78,000 83,000 Cotton 10,974 14,735 12,315 10,407 Rice 3,636 2,689 2,699 2,489 Sunflowers Planted 1,952 1,544 1,919 1,576 Canola (Rapeseed) 1,449 1,072 1,765 1,348 Flaxseed Beans, Dry Edible All 1,911 1,205 1,743 1,355 Peas, Dry Edible All World Corn, Soybean, and Wheat Harvested Acreage (Mln HA) Total Spring Planted 215, , , ,176 Low Corn High Corn Total Wheat (Wntr+Sprng+Drm) 53,603 54,409 55,736 56,156 High Beans Low Beans Corn + Soybeans Planted 165, , , , , ,000 % Beans (of Corn + Sbeans) 46.8% 44.9% 44.3% 44.5% 48.0% 45.3% Dble Crop Soybeans 2,471 4,774 4,777 6,782 CRP Total 33,721 31,298 29,526 26,838 Prevent Plant 5,316 9,750 1,327 9,419 Spring +WW+Hay+CRP+Prevent-DC SB 351, , , ,783 Spring +WW+Hay+Prevent-DC SB 318, , , ,945 Corn + Soybeans + Wheat 219, , , , / / / / / /2014 Corn Soybean Wheat
 CORN - US BALANCE mln bushels SEP/AUG Planted Acres (Mln Acres) 86.0 86.")
5 US Corn, Soybean, and Wheat Harvested Acreage (Mln Acres) March Corn /19 $ / / / / / /2014 Corn Soybean Wheat US Corn S&D US Corn Production (MMT) CORN - US BALANCE mln bushels SEP/AUG Planted Acres (Mln Acres) Harvested Acres Percent Harvested 91% 92% 92% 91% 90% 92% Yield Bu/Acre Beg. Stocks 1,624 1,673 1,708 1, Production 12,092 13,092 12,447 12,360 10,780 13,989 Imports Total Supply 13,729 14,774 14,182 13,517 11,931 14,843 FSI 5,025 5,961 6,426 6,439 6,044 6,400 FSI for Fuel 3,709 4,591 5,019 5,011 4,648 4,950 FSI not for fuel 1,316 1,370 1,407 1,428 1,396 1,450 Feed and Residual 5,182 5,125 4,795 4,545 4,333 5,200 Exports 1,849 1,980 1,834 1, ,450 Total Use 12,056 13,066 13,055 12,527 11,108 13, Ending Stocks 1,673 1,708 1, ,792 Stocks to use% 13.9% 13.1% 8.6% 7.9% 7.4% 13.7% Stocks in Days of use


6 US Corn Use for Ethanol (BBU) March Soybeans /19 $ /05 05/06 06/07 07/ US Soybeans S&D March Soymeal SOYBEANS - US BALANCE Mln bushels SEP/AUG Planted Acres (Mln Acres) Harvested Acres Percent Harvested 98.7% 98.5% 99.0% 98.4% 98.7% 99.2% Yield Bu/Acre /19 $ Beg. Stocks Production 2,967 3,359 3,329 3,094 3,034 3,289 Imports Total Supply 3,185 3,512 3,495 3,325 3,239 3,460 Crush 1,662 1,752 1,648 1,703 1,689 1,700 Feed, Seed & Residual Domestic Use 1,768 1,862 1,778 1,794 1,779 1,799 Exports 1,279 1,499 1,501 1,362 1,320 1,510 Total Use 3,047 3,361 3,280 3,155 3,099 3,309 Ending Stocks Stocks to use% 4.5% 4.5% 6.6% 5.4% 4.5% 4.5% Stocks in Days of use


7 US Soymeal S&D March Soyoil SOYBEAN MEAL - US BALANCE T Short tons OCT/SEP Beg. Stocks Production 39,102 41,707 39,251 41,025 39,875 40,360 Yield Imports Total Supply 39,484 42,101 39,731 41,591 40, ,800 Exports 8,497 11,160 9,081 9,741 11,114 10,900 Domestic 30,752 30,640 30,301 31,550 29,031 29,600 Total Use 39,249 41,800 39,381 41,291 40,145 40,500 End. Stocks Stocks to Use % 0.6% 0.7% 0.9% 0.7% 0.7% 0.7% Stocks in Days of use /19 $ US Soyoil S&D US Wheat S&D (MBU) SOYBEAN OIL - US BALANCE Mln lbs OCT/SEP Beg. Stocks 2,485 2,861 3,406 2,425 2,540 1,705 Production 18,745 19,615 18,888 19,740 19,820 19,840 Yield Imports Total Supply 21,319 22,578 22,453 22,314 22,556 21,745 Exports 2,193 3,359 3,233 1,464 2,164 1,450 Non Biodiesel Domestic Use 14,244 14,134 14,245 13,440 14,069 13,350 Biodiesel Use 2,021 1,680 2,550 4,870 4,617 5,200 Domestic Disappearance Total Use 18,459 19,173 20,028 19,774 20,851 20,000 End. Stocks 2,861 3,406 2,425 2,540 1,705 1,745 Stocks to Use % 15.5% 17.8% 12.1% 12.8% 8.2% 8.7% Stocks in Days of use WHEAT - US BALANCE Mln bushels JUN/MAY Planted Acres (Mln Acres) Harvested Acres Percent Harvested 88% 84% 89% 84% 88% 80% Yield Bu/Acre Beg. Stocks Production 2,499 2,218 2,207 1,999 2,266 2,130 Imports Total Supply 2,932 2,993 3,279 2,974 3,132 3,008 FSI 1, ,018 1,018 1,024 Feed and Residual Exports 1, ,289 1,051 1,007 1,125 Total Use 2,275 2,018 2,417 2,231 2,413 2,399 Ending Stocks Stocks to use% 28.9% 48.4% 35.7% 33.3% 29.8% 25.3% Stocks in Days of use


8 March Hard Red Winter Wheat World and South America Commodity Outlook - Bobby Ewalt South American Logistics China Soybean Imports Oct/Sep (MMT) orts (MMT) Imp Brazil 32 mmt US 26 mmt ARG 7 mmt Rest - 4 mmt


 Brazil Weather 200 180 160 140 120 100 186")

9 Soybeans Major Origins Production (MMT) US Vessel Shipment / Lineup To China /10 10/11 11/12 12/13 13/14 Argentina Brazil United States World Soymeal Consumption Oct/Sep (MMT) Brazil Weather % 6% 5% 4% 3% 2% 1% 0% -1% -2% -3% -4% World Soymeal Consumption % Growth


10 Brazil Forecasted Harvest Pace Brazil Soybeans S&D SOYBEAN - BRAZIL BALANCE 1000's MT Oct/Sep HARVESTED Area 1000 Hectares 21,700 23,500 24,200 25,000 27,700 29,500 YIELD mt/hectares Beginning Stocks 20,246 13,434 17,480 23,636 12,916 15,927 Production 57,800 69,000 75,300 66,500 82,000 90,000 Imports TOTAL SUPPLY 78,090 82,608 92,817 90,264 95, ,077 FSR 2,800 2,850 2,900 2,950 3,000 3,102 Exports 29,987 28,578 29,951 36,315 41,904 45,000 Crush 31,869 33,700 36,330 38,083 34,480 37,275 TOTAL DISAPPEARANCE 64,656 65,128 69,181 77,348 79,384 85,377 CARRY OUT 13,434 17,480 23,636 12,916 15,927 20,700 Stocks to Use 21% 27% 34% 17% 20% 24% Stocks Express in Days of Use Bean vessel loading ahead of normal pace with reduced line up congestion Brazil Soybean Exports by Destination (TMT), Oct/Sep 1 6, / / ,464 1,113 Argentina Weather , ,193 1,691 1,802 2,352 31,377 2,636 Total Exports = 30.0 MMT Total Exports = 41.9 MMT China Spain Netherlands Taiwan Thailand Japan Vietnam United States Other
11 Argentina Soybeans S&D SOYBEAN - ARGENTINA BALANCE 1000's MT Oct/Sep HARVESTED Area 1000 Hectares 16,000 18,600 18,300 17,577 19,400 20,000 YIELD mt/hectares Beginning Stocks 20,945 15,633 21,039 21,403 16,389 22,404 Production 32,000 54,500 49,000 40,100 49,300 54,000 Imports 1, TOTAL SUPPLY 54,186 70,134 70,052 61,503 65,691 76,406 FSR 1,720 1,880 1,830 1,860 1,940 2,000 Exports 5,590 13,088 9,205 7,368 7,738 8,000 Crush 31,243 34,127 37,614 35,886 33,609 36,600 TOTAL DISAPPEARANCE 38,553 49,095 48,649 45,114 43,287 46,600 CARRY OUT 15,633 21,039 21,403 16,389 22,404 29,806 Stocks to Use 41% 43% 44% 36% 52% 64% Stocks Express in Days of Use Argentina Soymeal Exports by Destination (TMT), Oct/Sep / Total Exports = 24.0 MMT / Total Exports = 23.7 MMT Indonesia Netherlands Vietnam Thailand Algeria United Kingdom Malaysia Italy Iran Poland Spain Other Argentina Soybean Exports by Destination (TMT), Oct/Sep South American Corn / / Total Exports = 5.6 MMT Total Exports = 7.7 MMT China Egypt Bangladesh Turkey Thailand United States Other
12 Major Origins Corn Production (MMT) Brazil Corn S&D CORN - BRAZIL BALANCE mln mt - MAR/FEB Harvested Area Yield mt/ha Beg. Stocks Production Imports Total Supply FSI Feed and Residual Exports Total Use US Brazil Argentina China Ukraine EU-27 Ending Stocks Stocks to use% 23.0% 17.0% 17.7% 12.3% 21.3% 15.7% Stocks in Days of use Brazil Corn Exports by Destination, Mar/Feb Argentina Corn S&D 4, / Total Exports = 7.7 MMT /2012 4,275 4, ,979 1,028 1,277 2,190 3,058 2,200 Total Exports = 24.3 MMT Japan Korea South Iran Egypt Taiwan United States Morocco Saudi Arabia Dominican Republic Malaysia Other CORN - ARGENTINA BALANCE mln mt - MAR/FEB Harvested Area Yield mt/ha Beg. Stocks Production Imports Total Supply FSI Feed and Residual Exports Total Use Ending Stocks Stocks to use% 5.8% 11.0% 17.5% 4.1% 3.4% 3.5% Stocks in Days of use


13 Argentina Corn Exports by Destination, Mar/Feb Livestock 2007/ / Total Exports = 14.7 MMT Total Exports = 17.1 MMT Colombia Algeria Korea South Peru Malaysia Egypt Saudi Arabia Morocco Japan Taiwan United States Other Dairy Herd and Milk Production Dairy Product Prices Rally Milk production during 2013 was 0.4% above 2012 production due to increased milk per cow Average 2013 dairy cow herd size was down 0.1% from the average 2012 herd Despite higher production, milk prices have rallied, increasing 14.7% from July to Dec Product prices continue to increase cheese, butter, and nonfat dry milk prices went up 10.4%, 10.7%, and 13.4% respectively from July to Dec

14 Dairy Price Ratios and Slaughter Cattle on Feed Below Last Year Milk to feed price ratio has greatly improved with lower feed costs and higher milk prices this December s milk/feed price ratio was the highest December ratio since 2009 Dairy slaughter during 2013 was 0.5% above slaughter in 2012 slaughter during the first two weeks this year has been down 10.2% from the same time last year Lower feed costs and record high cattle prices encouraged feedlots to stay aggressive in placements Cattle on feed inventories continue to be below last year Record Cattle Prices, Lower Slaughter Chicken Prices and Margins Texas steer price at record levels approaching $150 per cwt Lower cattle supplies have kept slaughter in check down 3.9% so far this year from the same time last year Broiler cutout prices this year have been near $80 per cwt, 10.2% below the same time last year Despite the lower cutout values compared to last year, lower feed costs have kept margins at break even, the same as last year


15 Eggs Set and Weights Above Year Ago PEDv Cases by State Eggs set for the first three weeks in January averaged 2.1% above the same time last year Weights continue to push higher, up 0.5% from the same time last year Total Reported Cases so far Date of First Reported Case PEDv Impact Greatest PEDv Impact Yet to Come Cases continue to spike across the nation total cases increased 28% in the last four weeks ending 1/19 The USDA has started to reflect the impact of PEDv on sow production, recording the lowest pig per litter growth since the summer of 2003 Year to date hog slaughter has been equal with the same time last year Pork production this year is up 2.6% from last year as producers feed hogs to heavier weights

16 Hog Profitability and Weights Spot producer margins are near $5 per head average expected margin for 2014 is over $30 per hear (based on futures) Producers look to take advantage of profitable margins by selling larger animals Conclusions Soybean Complex will be volatile 2014 Corn price outlook has more bearish opportunities due to PEDv SA weather is needed to finish their 2014 crop US weather for 2014 growing season critical World Political Stability SA politics China China China Follow Current Market Updates at tweet accounts #SteveBirdnest or #DaveLongBigMill or Instagram#BMasonTurkey