Poultry production a life-cycle approach to appraisal and development
|
|
|
- Hilda Crawford
- 5 years ago
- Views:
Transcription
1 Poultry production a life-cycle approach to appraisal and development Presentation to the UK Poultry Council Queen Elizabeth II Conference Centre, London 1 May, 2007 Donal Murphy-Bokern Murphy-Bokern Konzepte Kroge-Ehrendorf Germany and Adrian Williams, Daniel Sandars, Eric Audsley Cranfield University, UK
2 Background
3 This talk Some policy background One Planet Living and Life Cycle Assessment From burdens to impacts Further research and development
4 Policy drivers The strategy for sustainable farming and food Delivering the essentials of life Defra s five year strategy Climate Change: The UK Programme 2006 Developing measures to promote catchment sensitive farming England Rural Development Programme The air quality strategy for England, Scotland, Wales and Northern Ireland: working together for clean air David Miliband s speeches February 2007, January 2007, and July 2006

5 Climate change is a top government priority Climate change is probably the greatest long-term challenge facing the human race. This is why I have made it a top priority for this government, at home and internationally Tony Blair Climate Change: The UK Programme 2006


6 Recent warming can be simulated when man-made factors are included Temperature change ºC observed model simulation
7 C O 2 Ammonia Methane Nitrous Oxide

")
8 Stern on Agriculture 14% of global greenhouse gas (GHG) emissions in
9 One planet farming Put simply, we are living as if we had three planet s worth of resources to live with, rather than just one. So if we are to build a sustainable future economically as well as environmentally we need to cut by about two thirds our ecological footprint. For that we need one planet farming as well as one planet living one planet farming which minimises the impact on the environment of patterns of food production and consumption, and farming which maximises its contribution to renewal of the natural environment.
10 One planet farming symbolises globalisation of the agri-environmental agenda. It expresses the responsibility of consumption as the driver behind production.
11 Life-cycle assessment Life Cycle Assessment is an objective process to evaluate the environmental burdens associated with a product, process, or activity by identifying energy and materials used and wastes released to the environment, and to evaluate and implement opportunities to affect environmental improvements. (SETAC, 1990)
12 The LCA Concept Analysis of a production system Inputs = Outputs Mass flows measured at the system boundary must balance Manufactured Inputs e.g. fertiliser, concentrate feeds, machinery Natural Resources e.g. minerals, fossil energy, land Boundary Production System Functional Unit e.g. 1 t pig meat or wheat Emissions & wastes e.g. ammonia, carbon dioxide
13 What can you do with an assessment? Policymakers Producers Consumers Eco-design of production Sustainable consumption


14 ystem Modelling The Cranfield Study Industry structure models Soil, crop & livestock process models Provides ability to address a wide range of questions


15 The Modelling Diversity the of sheep Sheepproduction chain Hill / mountain, 1 ewe & 0.9 lamb needs 5-10 ha Lowland, 1 ewe & lambs needs 0.1 ha
16 Industry Structure Model Hill Pure bred hill Ewe lambs retained Lamb Non-organic NB: The organic industry has self-contained flocks Upland Male lambs Draft ewes Halfbreds Rams Longwool Lowland Male lambs Cross bred ewes/ lambs Lowland Rams Downland Surplus lambs Finished lambs Surplus lambs


17 Arable Modelling Long term, mass balances Functional relationships Models to inform emission estimates Animal manure credits and debits Input-output relationships as affected by 3 soil textures, 3 rainfalls Basket of outputs = commodity
18 Some results
19 Distribution of primary energy use in bread wheat and potato production 2.5 Bread Wheat Potatoes 60 kg crude oil Primary Energy, GJ/t Fert prodn Pest manu Crop store & proc Machinery manu. Field diesel 0.0 Non-O Org Non-O Org
20 Distribution of GWP for three crops 100% Bread Wheat Maincrop Potatoes 1st Early Potatoes 80% 60% 40% N2O CH4 CO2 20% 0% Non- Org Org Non- Org Org Non- Org Org
21 Main burdens in animal production (National Scale) 1 tonne of carcase meat, milk dry matter, 20,000 eggs Beef Sheep Pig Poultry Meat Meat Meat Eggs Milk Primary Enery, GJ GWP100, t CO2 equiv EP, kg PO4 equiv AP, kg SO2 equiv ARU, kg antimony equiv Land use (grade 3a), ha Crude Oil, kg t carcass, 20,000 eggs (1 t), 10 m 3 milk (1 t dm)
22 Distributions of energy in meat production 100% 80% 60% 40% Breeding Finishing / production 20% 0% Beef as now (with milk) Suckler beef Sheep meat Pig meat Poultry meat
23 Effects of milk yield on burdens PE, GJ GWP100, t ARU, kg CO2 ant. Equiv. Land, ha Low Medium High
24 Poultry production input data values used in the LCA model Breeder Systems Freerange Housed Free range Pole-barn housed Fully housed Time to laying, week 18 Finishing, day Female finishing age, week Female finishing weight, kg Male finishing age, week Male finishing weight, kg Rejects, % 1.5 Laying, time, week 54 Eggs laid 170 Eggs rejected 20 Hatching rate, % 0.85 Chicks hatched 115 Feed, t/1000 birds Poult feed, t/1000 birds 6.6 Spent broiler breeder, kg 5 Manure, t/1000 birds Straw, t/1000 birds Finished weight, kg Mortality, % Methane, g/head Ammonia, g/head Nitrous oxide, g/head Broiler systems Freerange - Organic Turkey systems Free range - Organic
25 Comparison burdens of production of some alternative poultry meat systems (per t) Impacts & resources used Nonorganic Organic Free-range (nonorganic) Primary energy used, MJ 12,000 15,800 14,500 GWP 100, kg 100 year CO 2 equiv. 4,570 6,680 5,480 EP, kg PO 3-4 equiv AP, kg SO 2 equiv Pesticides used, dose ha ARU, kg antimony equiv Land use, ha N losses NO - 3 -N, kg NH 3 -N, kg N 2 O-N, kg
26 Production sources 1 tonne poultry meat Poultry Meat (default national proportions) Primary energy used, MJ GWP100, kg CO2 Eutrophic ation potential, kg PO4 eqv. Acidificati on potential, kg SO2 eqv. Abiotic resource use, kg Sb eqv. Feed Bedding Buildings Direct energy Internal transport Gaseous emissions Manure Total
27 Comparison burdens of production of some alternative egg production systems Impacts & resources used (per 20,000 eggs) Nonorganic Organic 100% cage, nonorganic 100% free-range, nonorganic Primary energy used, MJ 14,100 16,100 13,600 15,400 GWP 100, kg 100 year CO 2 equiv. 5,530 7,000 5,250 6,180 EP, kg PO 3-4 equiv AP, kg SO 2 equiv Pesticides used, dose ha ARU, kg antimony equiv Land use, ha N losses NO - 3 -N, kg NH 3 -N, kg N 2 O-N, kg
28 Production sources 20,000 eggs Primary energy used, MJ GWP100, kg CO2 Eutrophic ation potential, kg PO4 eqv. Acidificati on potential, kg SO2 eqv. Abiotic resource use, kg Sb eqv. Feed Bedding Buildings Direct energy Internal transport Gaseous emissions Manure Total
29 Qualifications Steady states - not transition Soil C not included N 2 O could be calculated by other methods Activity data are limited Not about environmental performance of individual farms or biodiversity Burdens, not impacts
30 Nitrogen and the LCA of agricultural commodities Wet & dry Deposition 380 N 2 O 83 NH 3 Denitrification Nox 493 a carbon footprint inadequately describes agriculture; it has a carbonnitrogen footprint..the majority of environmental burdens arising from the production of agricultural food commodities arise either directly or indirectly from the nitrogen cycle and its modification.. Timber 30 Food 901 Crop uptake Fertiliser Organic 1100 Residues 788 (Adrian Williams, Eric Audsley and Daniel Sandars of Cranfield University Executive summary of the Defra Project Report IS0205) Nitrate NO 3 Ammonium NH 4 Leaching Eutropication Improving the nitrogen economy of UK agriculture lies at the centre of improving environmental performance re the major LCA parameters

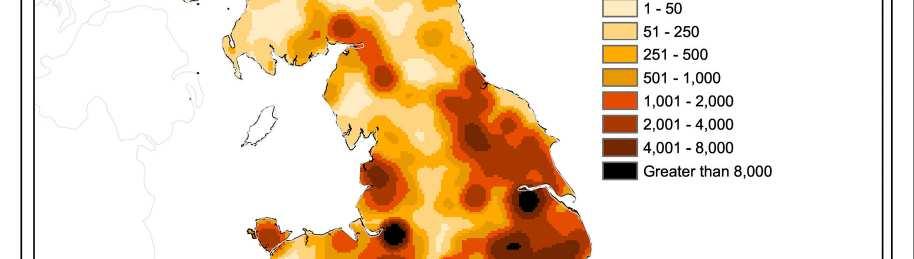
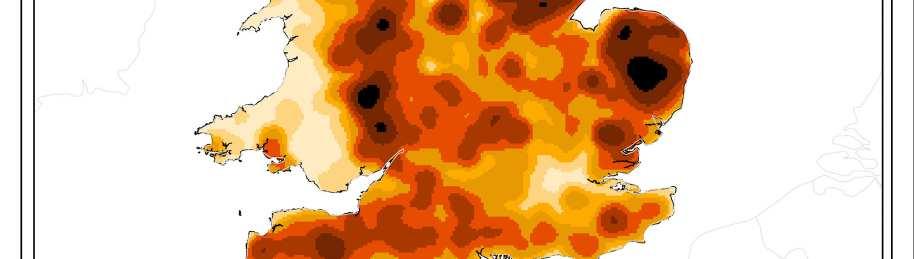
31 From burdens to impacts location, location, location Nitrates Ammonia Phosphorus
32


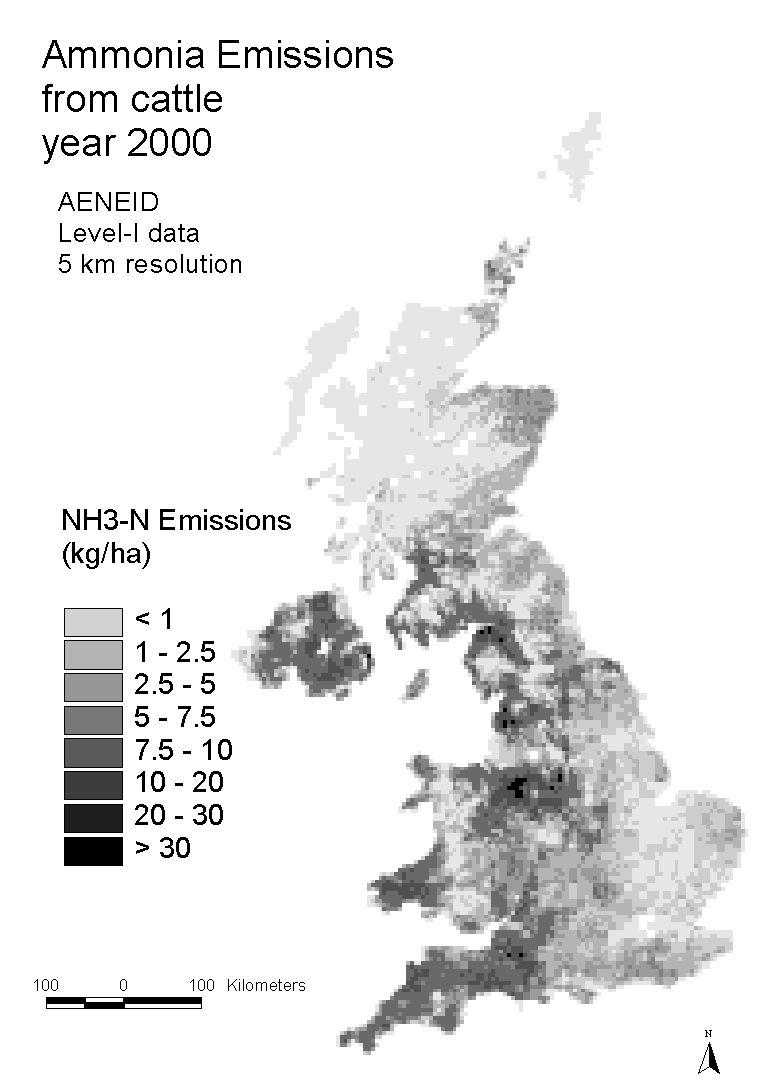
33 Ammonia (NH 3 ) Highly reactive gas Short and long range Sources: Urban sources Agriculture

34 Sample output data from AENEID + + =

35 Ammonia emission trend 15% reduction since 1990
36 Where are we now? Eutrophication habitats at risk Percentage area of sensitive habitats at risk: 65% in % in % in 2010
37


38 Dealing with spatial scale European exceedances of the critical load for nitrogen Ecosystem protection National targets and policy


39 Agroforestry systems for ammonia abatement National benefits of ammonia recapture by trees Mark Theobald
40 Locally - Four-way benefit of trees 3. Increased mixing of the air Direction of Wind 1. Sheltering Reduces Emissions -20% 2. Recapture of NH 3 by trees -10% -30% Ammonia sources 4. Recapture of NH 3 from livestock under trees -80% (?)
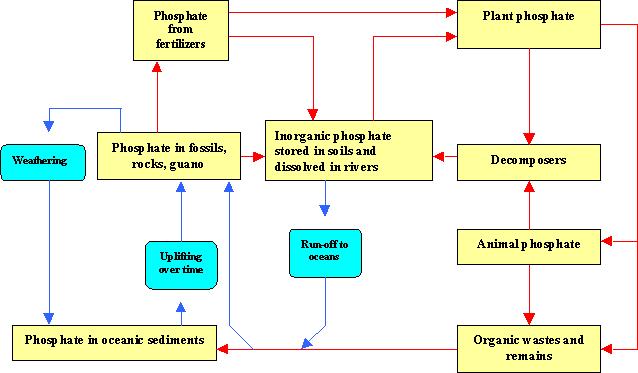
41 Phosphorus


42 TOTAL LIVESTOCK BIO-MASS ON AGRICULTURAL LAND Legend Source : LEAD FAO Year :2002 Map prepared by LEAD - FAO Contact us: lead@fao.org


43 PHOSPHATE BALANCE ON AGRICULTURAL LAND Legend Source : LEAD FAO Year :2002 Map prepared by LEAD - FAO Contact us: lead@fao.org


44 CONTRIBUTION OF MANURE TO PHOSPHATE SUPPLY ON AGRICULTURAL LAND Legend Source : LEAD FAO Year :2002 Map prepared by LEAD - FAO Contact us: lead@fao.org
45
46
47 Production sources 1 tonne poultry meat Poultry Meat (default national proportions) Primary energy used, MJ GWP100, kg CO2 Eutrophic ation potential, kg PO4 eqv. Acidificati on potential, kg SO2 eqv. Abiotic resource use, kg Sb eqv. Feed Bedding Buildings Direct energy Internal transport Gaseous emissions Manure Total
48 100% 80% 60% Analysis of IPPC size distribution 40% 20% 0% 100% pig poultry dairy cows >100 or cattle >300 dairy cows >150 or cattle >450 dairy cows >200 or cattle >600 number of farms > IPPC: % of farms in England (2004) below and above IPPC thresholds and experimental cattle thresholds 80% 60% 40% 20% 0% pig poultry dairy cows >100 or cattle >300 dairy cows >150 or cattle >450 dairy cows >200 or cattle >600 % of animals in England (2004) below and above IPPC thresholds and experimental cattle thresholds
49 Contribution of NH 3 from (potential) IPPC farming to UK emissions 100% UK NH 3 Emission (kt NH3) 2000 % animals in IPPC (England, 2004) UK NH 3 regulated under in IPPC (kt) 80% Pig % % 40% Poultry % % 0% pig poultry dairy cows >100 or cattle >300 dairy cows >150 or cattle >450 dairy cows >200 or cattle >600 Cattle a) 37% b) 20% c) 11% a) 51.7 b) 27.9 c) 15.4
50 Conclusions The environmental burdens from the UK poultry industry are relatively low. Well located to reduce impacts from burdens Well placed to reconnect plant and livestock production

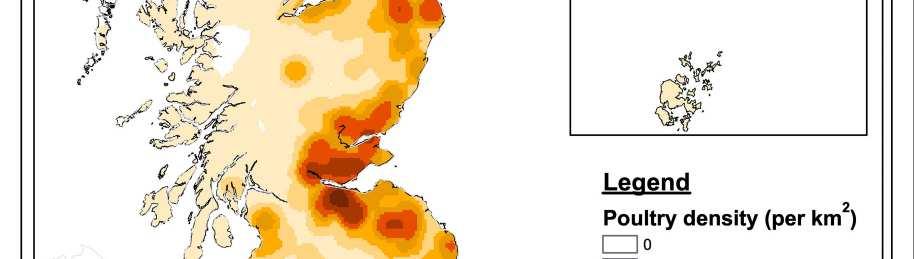
51 Further research and development Source: Scottish Agricultural College

52 Emissions trading... We need to look closely at how incentives within the food, energy and land markets can reflect environmental impact more closely. David Miliband, Oxford Farming Conference Speech 2007
53 Comparative life-cycle assessment of food procured through a diversity of food chains The size and configuration of a sustainable livestock sector Global warming impacts on livestock Reducing the N load GREEN grain Biogas Reconnection protein quality.
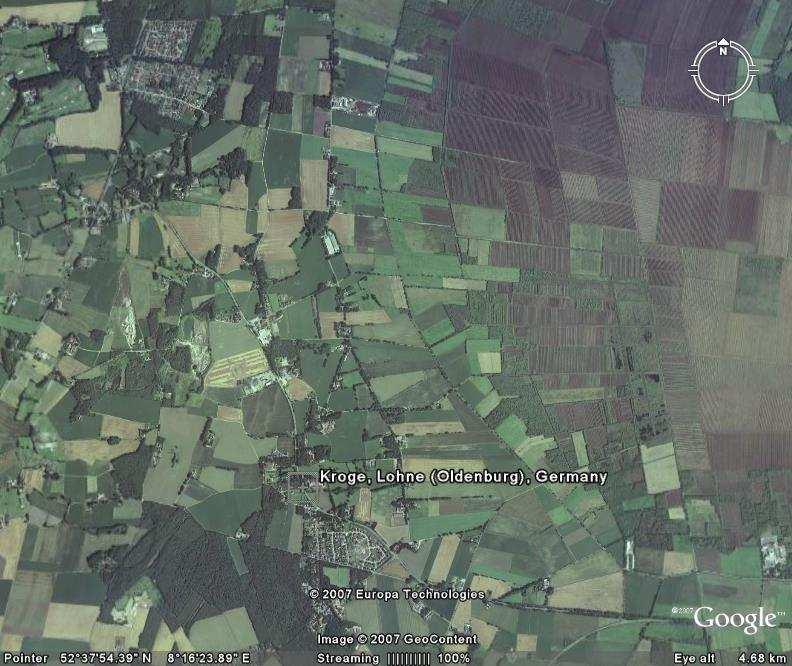
54 Kroge-Ehrendorf, Lower Saxony

55

56 Reconnecting plant and animal production to close nutrient cycles Wet & dry Deposition 380 N 2 O 83 NH 3 Denitrification Nox 493 Timber 30 Food 901 Crop uptake Nitrate NO 3 Fertiliser Organic 1100 Residues 788 Ammonium NH 4 Leaching Eutropication

57 Mr Bernard Barlage: closing nutrient cycles growing maize for pig production

58 And using advanced production technology to reduce nitrogen emissions to air
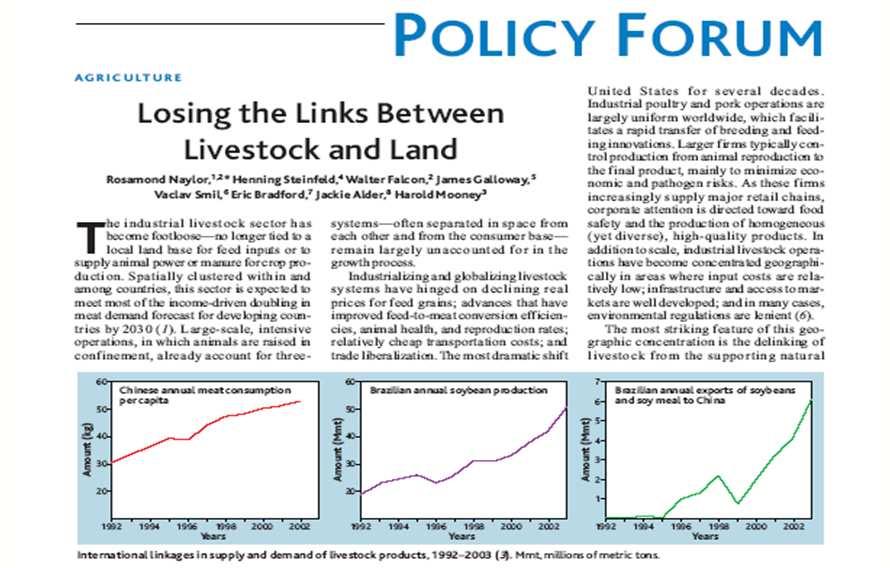
59 Acknowledgements Mark Sutton, Stefan Reis and Mark Theobald of the Centre for Ecology and Hydrology Rosemond Naylor, Stanford Katherine Bass and Soheila Amin-Hanjani, Defra
60 Thank you for your attention murphy-bokern.com Murphy-Bokern Konzepte Lindenweg Kroge Germany