Foundation for Ecological Security, India Structure of the presentation
|
|
|
- Frederick Baker
- 5 years ago
- Views:
Transcription

1 Foundation for Ecological Security, India Structure of the presentation The Indian context Watershed Mgt in India Issues in Watershed Mgt What we do How we work Results Challenges 1

2 The Indian context The network of rivers comprises 12 major basins having a combined catchment area of about 256 million ha. In addition, there are 46 medium basins varying in size from 2,000 to 20,000 km 2 covering a total area of about 25 million ha. 2


3 India has 12 eco-regions, 1. Cold Arid 2. Glacier 3. Warm Sub Humid 4. Hot Sub Humid 5. Hot Semi Arid 6. Hot Arid 7. Warm Per Humid 8. Hot Sub Humid to Humid 9. Sub Humid 10. Hot Sub Humid to Semi Arid 11. Hot Humid Per Humid 12. Hot Humid to Per Humid Island In western, northwestern and peninsular India groundwater withdrawal exceeds annual recharge. Groundwater use in the 1980s. 3


4 In India, the bulk of the year s rainfall is received in some 100 hours of heavy downpour, providing little time for recharging the groundwater Some studies indicate that up to 50% of wells once in use in many parts of India have completely dried up. Total geographical area of India is 329 Million Ha, of which 53.3 % is affected by Soil erosion and land degradation problems. About 7 million Ha of land is affected by salinity. An estimated 6 Billion MT of soil is lost annually ha of productive table land becomes ravined each year. 4


5 India has 7.31 % of the faunal species and % of the floral species of the world. 33 % of these are endemic to India. Habitat loss and degradation affects 89% of all threatened birds, 83 % of mammals and 91% of all threatened plants assessed globally. (IUCN, 2000) In 1995, the state granaries were overflowing with 30 million tonnes of unsold grain. At the same time, 40 per cent of India's population - more than 350 million people - were living below the poverty line. 5


6 242 of the 593 districts of the country are identified as fuelwood-deficient India's livestock numbers grew from 228 million half a century ago to 336 million in It is estimated that India's forest cover can support grazing by just 31 million livestock. 6

7 Over the last fifty years India has spent Rs. 800 Billion on the irrigation sector alone. Yet there are more drought-prone areas and more flood-prone areas today than there were in Watershed Mgt in India 7
8 Policy mindset in water management - India Dam dominated or groundwater exploitation Disarray of local institutions of management Development oriented than management poverty alleviation than landscape too micro-ridden Inequitable land based - for rich Watershed semi-arid/ dry land scenario Interlinking of rivers The Issues 8
9 The Issues Landscape level Regulation and Planning on Conservation and use Administrative Boundaries vs. Watershed Boundaries Governance Bodies A river basin approach by formation of River basin authority or commission and a legislation for catchment management. Regionally differentiated approach that integrates diverse ecological, social and economic contexts. Inter departmental coordination. FES, India 9
10 Our work We are a not for profit organization 200 people having 18 years of experience We work with 950 village institutions with 1 lakh 25 thousand rural families on 75 thousand hectares of land in varied eco-regions How we work 10
11 Our past Small, scattered woodlots Single category of land and village institution One protected, other exploited No impact on hydrological, biomass, biodiversity Not integrating farming systems and local land use Socio-cultural-political linkages advantages not considered Good in contiguous patches We grew to... Landscapes A larger constituency for conservation Commons - spaces of the poor Institutions - tiers of self regulation 11
12 Rationale - Landscapes Ecological impact on livelihoods hydrological regimes, bio-mass and biodiversity Cuts across administrative boundaries Builds on social,cultural and political characteristics Builds on customary settlement and land use patterns Rationale - A larger constituency for conservation conservation and livelihoods go hand in hand in many rural areas our strength is working with communities islands of bio-diversity need to spread supply to be addressed by judicious use 12
13 Rationale - Commons: Spaces of the Poor Revegetation of commons improved hydrological regimes and biomass improved farming system improved farm based economies vast stretches remain unappreciated bring people together Poor find physical, social and political space to interface on equality and fairness the only foothold on land for the poor Rationale- Institutions: Tiers of self regulation Local tier managing local resources inclusion of all the constituents all constituents determine the future of collective disaggregated opinions Shared resources by constituent habitations boundaries and access supply and demand umbrella of resource based institutions State as the larger adjudicator function 13


")


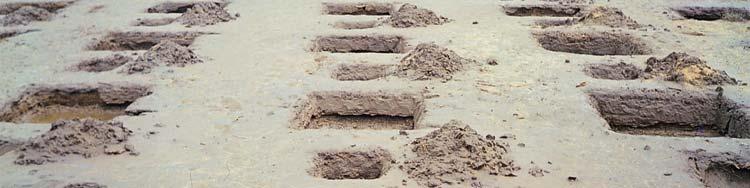
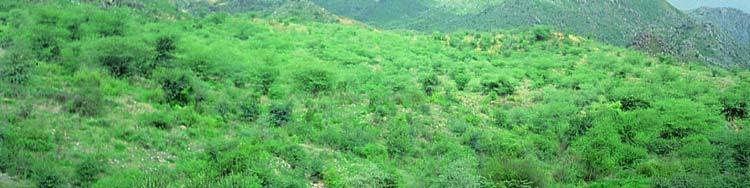
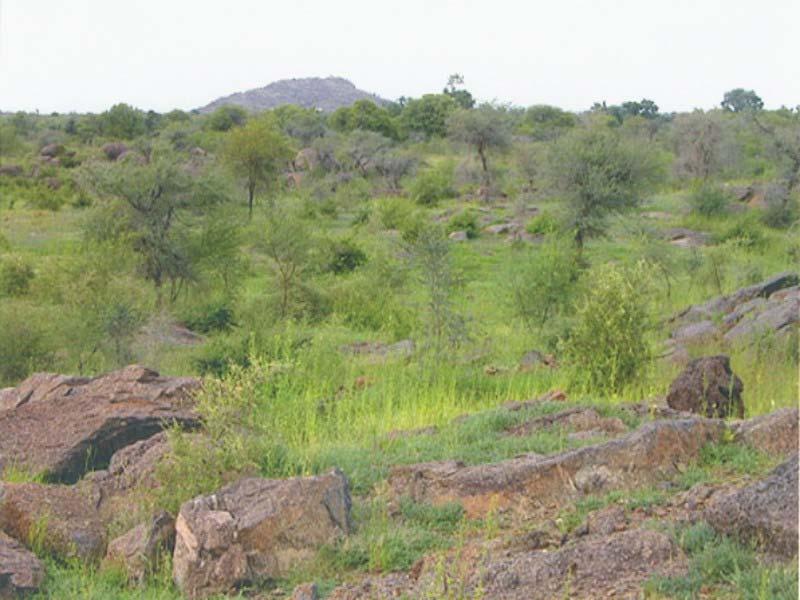
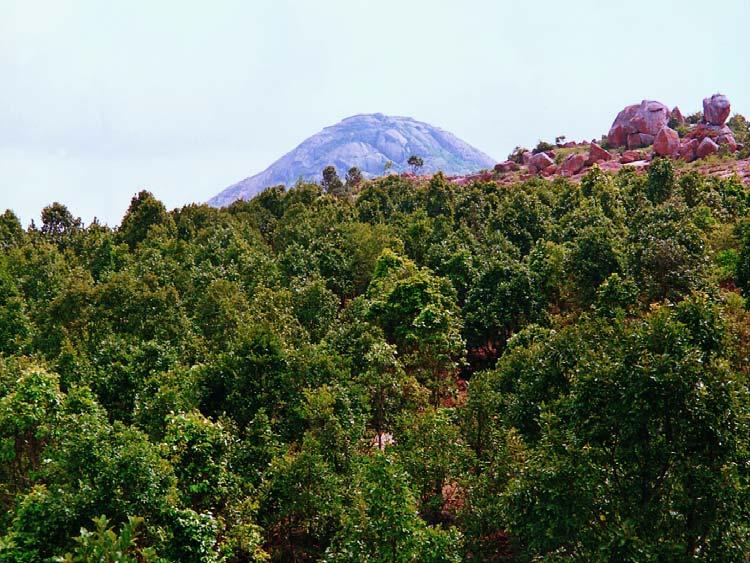
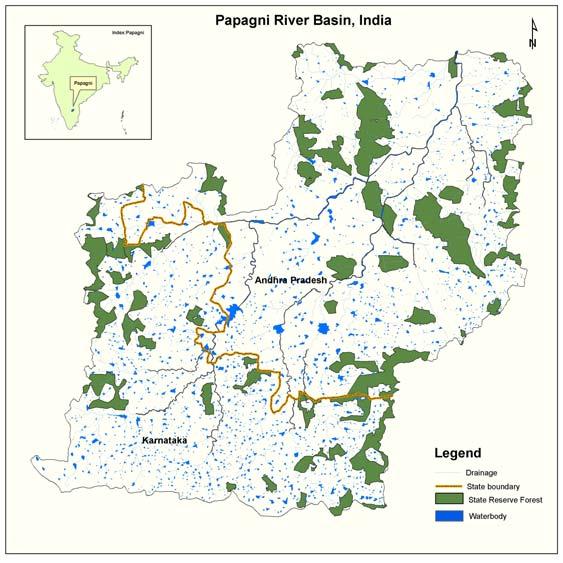
14 Papagni River basin, AP and Karnataka Semi-arid zone (40 % Wasteland) Rainfed agriculture Landscape conservation & Use 14


15 Mahi river & Gulf of Cambay, Gujarat * Coastal saline mudflats * Shelter belts * Mahi Riverbank Stabilization * Industry and commercial agriculture Mansi, Wakal river basins (Udaipur) & Khan, Kali river basins (Dahod) * Degraded forests * Tribals, Rainfed Agriculture, Migration * A farming system approach 15


16 Lakhunder and Gadganga river basins, Madhya Pradesh * Extensive degraded grasslands * Migrant pastoralists * Agriculture and Animal Husbandry Angul & Dhenkanal, Central Orissa * Good Vegetation * Forest Dependence & Subsistence Agri. * Gramya Jungle, Palli Sabhas * Livelihoods & Tenure 16


17 Bhilwara, Rajasthan * Degraded lands * Panchayat Conglomerates * Rainfed Agri. & Livestock * Commons & Animal Husbandry Gori River Valley, Uttaranchal * Unique physiographic zone * Forest dependent community * Working with Van Panchayats * Biodiversity conservation 17
18 Basic Concepts Economic Power & politics Ecology Social 18
19 Studies of social drivers Decision system analysis Biogeochemical assessments G l o b a l Population Global political economy Politics Economics Climate Models Global cycles Carbon Cycle Models Atmospheric chemistry Models Emission Models R e g i o n a l Markets Macro-decision system Social/ cultural structure Public Policy Political Air Chemistry Regional climate/ chemistry Pollution transport Regional climate Human aspirations Micro-decision system Land assessments L o c a l Needs and wants Culture Geograph y and Climate Consumption Production Soil Vegetation Water Nutrients A wiring diagram illustrating how human needs and wants drive land cover change, which in turn impact on the environment at local to global scales. Boxes (modules and sub-modules) represent variables to consider and the arrows links between variables (information flows or processes). (From Rayner et al., 1994; published by Cambridge University Press.) 19
20 Policy meets practice Federating process Ecological restoration vis-a-vis extraction patterns Dialogue on potential and consumption Impacts 20

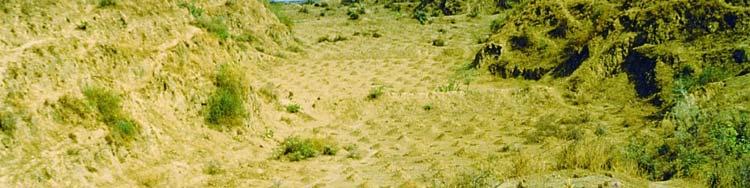


21 Gujarat 1986 Gujarat

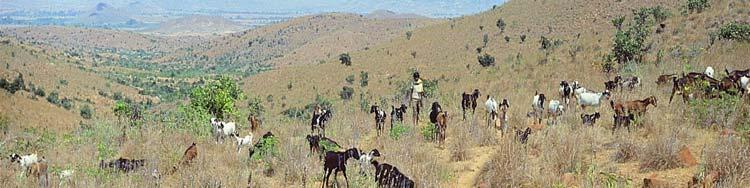
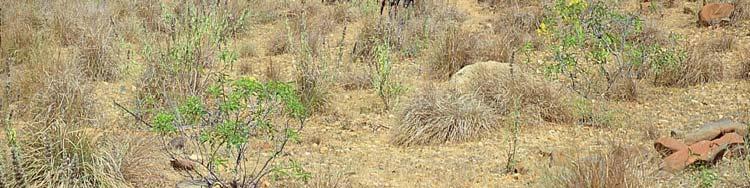


22 AP 1990 AP

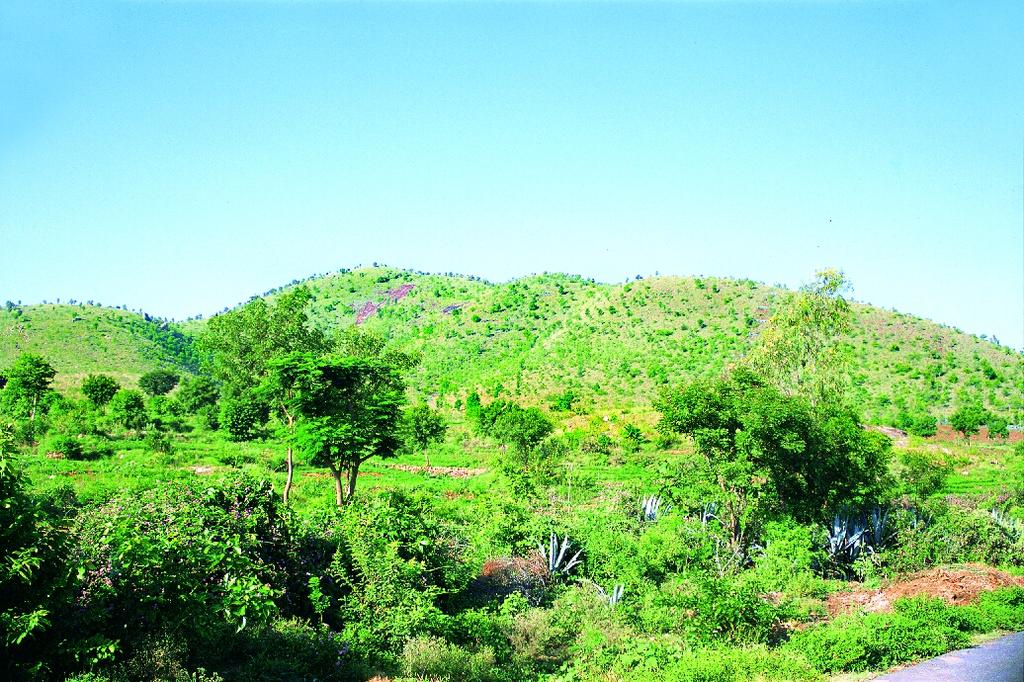
23 AP 1993 AP


24 Gujarat 1988 Gujarat


25 Rajasthan 1988 Rajasthan

26 Rajasthan 1999 Rajasthan

27 Rajasthan 1999 Rajasthan

28 Karnataka 1999 Karnataka

29 29
30 Vegetation change from 1996 to 2002 in Sadhukonda RF Change in Landcover in Sadhukonda RF during Area in Ha Dense forest Open forest Mixed forest Scrubland Mixed degraded Wasteland forest Landcover type Rock outcrop The area of the Reserve Forest is about 6,400 ha. Change in extent of mixed degraded forest Lilri Watershed in Rajasthan Area Ha Area Ha Change: Mixed Degraded forest area increased by 51% 30

31 Vegetation change ( ) Open forest Mixed degraded forest Scrubland Wasteland Agriculture Agriculture Waterbody single crop double crop Land cover 76 0 The total area of the watershed is around 4500 hectares G Cattle Ponds - small but effective 31


32 Women, water in Bhilwara Increase in net sown area of 2 nd crop in 12 villages of Madhya Pradesh despite prevailing drought conditions 32


33 In critical ecosystems like the Mountains, each unit of agriculture lands requires six units of common lands to sustain Watermill in Uttaranchal: Different form of commons 33


34 Demanding equal and minimum wages from Panchayats and govt. contracts. Successful Negotiations by communities with migratory herders led to better protection of the Commons 34

35 Positive Signs Working in Six river basins in different eco-regions Tenure- 31 thousand hectares leased to communities thousand hectares earmarked Policy on Commons Right to safe drinking water Recommendations to Planning Commission About 150 villages in each ecological location Challenges 35
36 Challenges facing us Landscape level Regulation and Planning on Conservation and use Nesting user groups/institutions at micro and meso levels Are we touching the real poor? Close coordination between all development agencies engaged in watershed progamme to avoid duplication and bottlenecks in implementation. Funding Scenario Macro Issues Increasing and irrational diversion of land for industrialization Commons and forests Local economies being brought under state/market control Livelihood options local, larger economy coping mechanism No liberalization/coherence in various rural development policies True valuation of ecological and social services Primacy to ecological concerns in planning 36
37 Thank You 37