2016/6/14. China Grain Supply & Demand and Price. China National Grain & Oils Information Centre Li Xigui 13 Jun Grains
|
|
|
- Adelia Chambers
- 5 years ago
- Views:
Transcription
1 China Grain Supply & Demand and Price China National Grain & Oils Information Centre Li Xigui 13 Jun Grains 1
 Export")
2 China s economy :the main economic indicators are slow down, China economy enters a new transition period Unit:% 30 China's macroeconomic is slowdown TO Mar GDP Value Added of Industrial Enterprises above Designated Size Investment in Fixed Total Retail Sales of Assets (Excluding Consumer Goods Rural Households) Export Import 3 China's population Source: National Bureau of Statistics of China China s population growth is also slowing down. 4 2
3 Comprehensive measures to ensure grain production Agricultural subsidies and high prices promote the enthusiasm of farmers to increase the grain area Grain direct subsidies, agricultural means subsidies, seed subsidies The minimum purchase price system, temporary purchase and storage system and target price subsidies Technological innovation, disaster prevention and mitigation to promote the improvement of yield High yield Experimental field demonstration, green production model research, soil testing Fertilization Pest control, agricultural flood and drought control Planting structure is conducive to the improvement of total output High yield crop maize and one-season rice areas are growing Low yield crop soybean area continues to decrease 5 China grain circulation policies National grain reserve Local grain reserve City or county grain reserve Minimum supporting price purchase system, for wheat, paddy Temporary purchase and storage system, for corn; and new policies will be Market-based purchase and sale + Subsidy to farmers Target price policy, for soybean and cotton 6 3


4 Grain production of China grow 44.3% to 2003 and Annual average growth rate get 3.1% Unit: Million MT Source: National Bureau of Statistics of China, including soybean 7 Grain area remain rise but still lower than last ten years Unit: 1000 hectares Source: National Bureau of Statistics of China, including soybean 8 4


5 The proportion of corn in grain area continued to rise Unit: % Source: National Bureau of Statistics of China, including soybean 9 9 Three main grain supply and demand of China Unit: 1000 ton China's grain supply is much bigger than the demand in present and near future! As grain production is likely to grow, China s rice stock will reach a new record this year. 10 5
6 Grain import tariff quota Import tariff quota (Million MT) The percent of non state trade Corn % Wheat % Paddy 5.32(Including 2.66 long rice and 2.66 short rice) 50% Driven by high import profit, import of grains with no quota limit will enter China to replace corn for feed use. This will lead to high stock-to-use ratio of china grain. Corn 6


7 Corn area reduce 2.6% and yield is forcasted down 0.5% 13 China s corn supply & demand Unit: Unit:1,000 Hectares, Ton/Hectare, 1,000 Tons Item 2012/ / / / /17 May- For. Pre- For. Planted Areas 35,030 36,318 37,123 38,117 37,170 Yield Production 205, , , , ,000 Imports 2,702 3,277 5,516 2,700 2,000 Total Supply 208, , , , ,000 Food Use 17,400 18,000 18,000 18,160 18,160 Feed Use 112, , , , ,500 Industrial Use 52,000 49,000 50,500 55,400 60,700 Seed Use 1,450 1,480 1,500 1,440 1,385 Domestic Use 183, , , , ,745 Exports Total Demand 183, , , , ,775 Surplus 24,887 41,763 51,150 41,850 13, Market Year : October/September. Surplus : difference between current year total supply and demand, not ending stocks. 7
8 The sorghum supply & demand balance Unit: 1,000 Tons 2011/ / / / / /2017 May- For. Pre- For. Production 2,051 2,556 2,892 2,885 3,060 3,140 Imports ,160 10,162 7,000 3,000 Total Supply 2,101 3,206 7,051 13,047 10,060 6,140 Food Use Feed Use ,200 9,700 7,000 3,000 Industrial Use 1,300 2,000 2,100 2,200 2,200 2,200 Seed Use Waste Domestic Use 2,065 3,120 6,970 12,620 9,970 5,970 Exports Total Demand 2,110 3,170 7,020 12,670 10,020 6,020 Surplus Market Year : October/September. Surplus : difference between current year total supply and demand, not ending stocks. 15 It is estimated that China imports nearly 10 million MT of sorghum for feed use in 2014/2015, and the amount is likely to less 7 million MT in 2015/2016, mainly to the southern consuming areas. US is the major supplier. The barley supply & demand balance Unit: 1,000 Tons 2011/ / / / / /2017 May- For. Pre- For. Production 1,637 1,625 1,699 1,812 2,000 2,050 Imports 2,541 2,184 4,891 9,859 5,000 2,400 Total Supply 4,178 3,809 6,590 11,671 7,000 4,450 Food Use Feed Use ,500 6,200 2, Industrial Use 3,730 3,200 3,700 3,700 3,700 3,700 Seed Use Domestic Use 4,170 3,800 6,570 10,280 6,880 4,280 Exports Total Demand 4,174 3,801 6,570 10,280 6,880 4,280 Surplus Market Year : October/September. Surplus : difference between current year total supply and demand, not ending stocks. Import of barley for feed use started to become active in May It is estimated that over 9 million MT of barley is imported for feed production in 2014/2015, and the amount is likely to be less 5 million MT in 2015/2016. Southern China is the major consuming region. China has approved barley import from Australia, Canada, Denmark, France, Argentina and Ukraine. 8


9 Corn temporary purchase price in Heilongjiang, Jilin, Liaoning, Neimenggu Year Yuan/kg Price Not availble 17 China corn price in northeast region port 18 9


10 The corn price in Shandong and Hebei RMB exchange rate in 1th June 2016: 1 Dollar= Yuan 1 Pound= YUAN 19 Wheat 10


11 Wheat area and yield remain stable Unit:1000 Ha Unit:Ton/Ha Winter wheat area Spring wheat area Winter wheat yield Spring wheat yield 21 Wheat production remains growing 22 11


12 Wheat supply & demand balance Unit: 1,000 Tons 2010/ / / / / / /17 May- For. Pre- For. Production 115, , , , , , ,310 Imports 795 2,949 2,895 6,772 1,495 3,000 3,000 Total Supply 115, , , , , , ,310 Food Use 83,300 89,900 97,100 96,300 92,000 90,000 90,000 Feed Use 13,500 28,000 21,000 13,500 14,000 10,500 6,000 Industrial Use 10,800 11,000 12,000 13,000 9,500 9,000 9,000 Seed Use 4,690 4,690 4,700 4,700 4,700 4,700 4,700 Domestic Use 112, , , , , , ,700 Exports Total Demand 112, , , , , , ,705 Surplus 3,685-13,290-11,062 1,198 7,499 18,982 23,605 Market Year : June/ May. 23 国 Wheat import and export 24 12

13 Wheat Minimum Purchase Price, Year Yuan/kg White wheat Red wheat Mixed wheat Wheat: Minimum price purchase 26 13


14 Wheat prices are showing a downward trend 27 Rice 14

15 Reduction of output early paddy in Increasing of one-season paddy in
16 Reduction of output late paddy in types: Indica & Japonica In 2014,the production of japonica is million, 30% of the total production. In2014,the production of indica is million, 70% of the total production. Japonica production has been increasing for the past 10 years. Beside prices, Chinese people is paying more attention on the quality and safety of food. The production proportion of indica and japonica year japonica proportion indica proportion 25% 25% 29% 30% 30% 30% 30% 75% 75% 71% 70% 70% 70% 70% 32 16


17 Rice import increases from 2012 Year Rice monthly Import(1000 tons) 2012Y 2013Y 2014Y 2015Y 2016Y Jan Feb Mar Apr May Jun Jul Aug Sep Oct Nov Dec Add the border trade and smuggling, the real rice imports reached million tons in 2012 and 2013 and the decline in non-normal trade in 2014 and 2015 for customs against. In accordance with the ASEAN trade agreements, short grain rice or broken rice import tariffs reduced to 20% from 2015 and most rice import tariffs will be reduced to 5% to it s projected to be a bigger import of rice in 2015 because price of imported rice is still much cheaper. Rice Price in South East Asian Keep Decline in three Years Unit:Yuan/Ton Tailand 5% broken rice Vietnam 5% broken rice /1/1 11/1/1 12/1/1 13/1/1 14/1/1 15/1/1 16/1/


18 Domestic price & Import price 35 Paddy Supply and Demand, 2015/16 Market Year Unit:1000 Tons 2011/ / / / /16 May. For Production 201, , , , ,245 Imports 2,806 3,166 3,367 4,349 4,200 Increased Supply 203, , , , ,445 Food Use 169, , , , ,000 Feed Use 16,180 15,260 11,300 10,200 9,000 Industrial Use 12,000 13,000 10,800 10,600 10,200 Seed Use 1,220 1,240 1,250 1,280 1,300 Domestic Consumption 198, , , , ,500 Exports Total Consumption 199, , , , ,000 Surplus 4,771 5,315 13,208 18,940 22, Market Year : October/September. 18

19 Supporting policy on rice industry Source: State Administration of Grain 37 Paddy Minimum Purchase Price, Year Early Paddy Yuan/kg Middle-season & Late-Indica Paddy Japonica Paddy First Time Second Time First Time Second Time


20 Rice :new round of excess cycle 39 Early Paddy Price 40 20


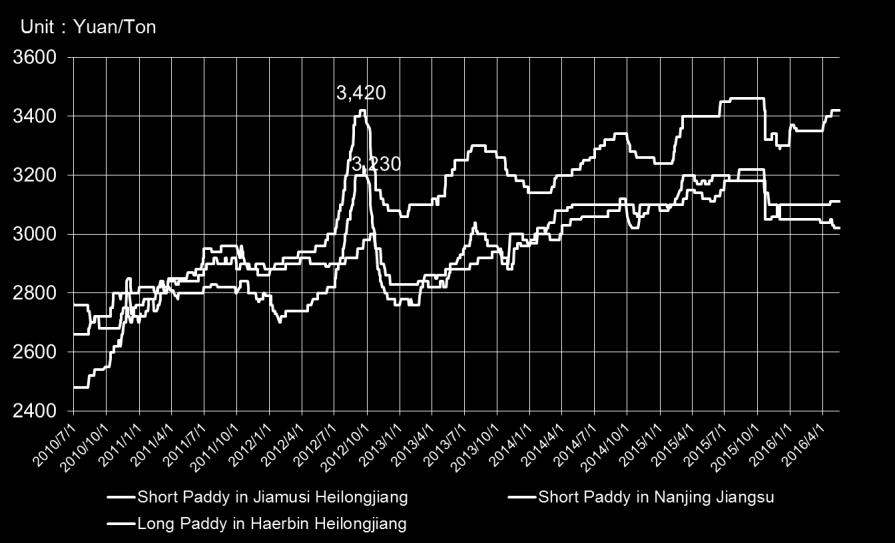
21 Late Paddy Price 41 Japonica Paddy Price 42 21
22 Soybean China s soybean supply & demand China Soybean Supply and Demand Unit:1,000 Hectares, Ton/Hectare, 1,000 Tons Item 2012/ / / /16 May- For. May- For. Planted Areas 7,172 6,791 6,800 6,450 Yield Production 13,050 11,951 12,154 11,600 Imports 59,834 70,364 78,355 82,000 Total Supply 72,884 82,315 90,509 93,600 Seed and Residual Use Food and Industrial Use 10,000 10,500 11,000 11,500 Crushings Use 63,000 67,000 72,000 77,000 Domestic soybean 4,000 3,000 2,500 2,000 Imported soybean 59,000 64,000 69,500 75,000 Feed Use 1,500 2,000 3,000 3,500 Domestic Use 75,000 79,980 86,480 92,450 Exports Total Demand 75,266 80,195 86,623 92,600 Surplus -2,382 2,120 3, Market Year : October/September. Surplus : difference between current year total supply and demand, not ending stocks. 22

23 China s soybean area and production end reducing 45 China s soybean imports continue to create a record high Unit:1,000 Tons China soybean imports 90,000 80,000 70,000 60,000 59,231 78,355 70,364 82,000 50,000 40,000 30,000 20,000 10, ,246 21,416 25,806 37, / / / / / / / / / / / / / / / /

 In 2014, china Start implementation of the soybean target price")
24 Forecast China annual processing capacity of soybeans will reach 153 million tons by The soybean policies In 2008, China first time to start the temporary purchase and storage policy on soybean. Total purchase 19 million tons of soybean during the purchase supporting price raised annually, about 24.32% from 2008 to YEAR Support price (Yuan/ton) In 2014, china Start implementation of the soybean target price pilot, and the target price remain 4800 Yuan/ton in 2015 and YEAR Target price (Yuan/ton) 48 24


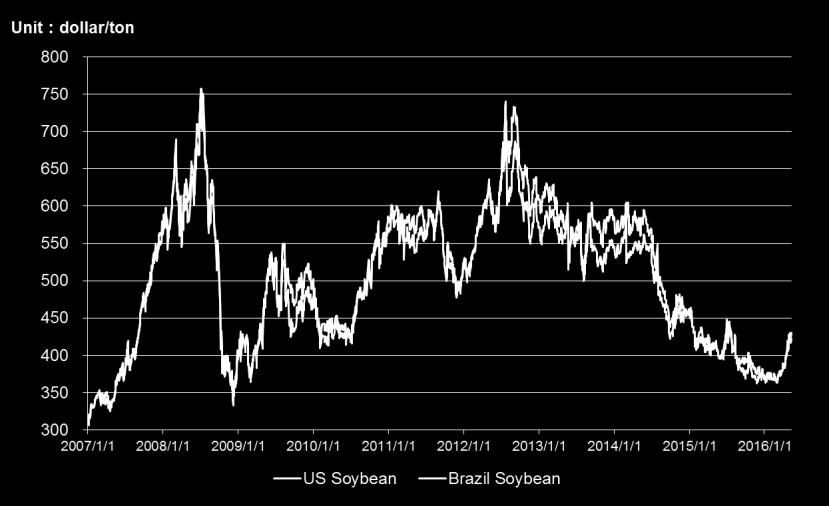
25 Domestic soybean price 49 Imported soybean price 50 25

26 soybean oils price 51 Li Xigui Analysis and Forecast Department Division