A PROFILE OF THE SOUTH AFRICAN BEEF MARKET VALUE CHAIN
|
|
|
- Meghan Lucas
- 5 years ago
- Views:
Transcription

1 A PROFILE OF THE SOUTH AFRICAN BEEF MARKET VALUE CHAIN 2010 Directorate Marketing Private Bag X 15 Arcadia 0007 Tel: /6 Fax: DM@daff.gov.za 1
2 1. DESCRIPTION OF THE INDUSTRY Production Areas Production Trends Local Consumption Employment. 2. MARKET STRUCTURE Domestic Market Import Export Analysis Exports Share Analysis Imports. 3. VALUE CHAIN ANALYSIS. 4. MARKET INTELLIGENCE Export tariffs Import tariffs. 5. PERFORMANCE OF SOUTH AFRICAN BEEF INDUSTRY IN Exports Imports. 6. ACKNOWLEDGEMENTS/ REFERENCES
3 1. DESCRIPTION OF THE INDUSTRY The livestock sector is one of the best growing parts of the agricultural economy, driven by income growth and supported technological and structural change. This sector contributes 40 percent of global value of agricultural output and supports the livelihoods and food security of almost billion people. Beyond their role in generating food and income, livestock are a valuable asset, serving as a store of wealth, collateral for credit an essential security net during calamitous times. Globally, livestock contribute 15 percent of total food energy and 25 percent of dietary protein. In South Africa, stock farming is the only viable agricultural activity in a large part of the country. Approximately 69% of South African agricultural land is used for extensive grazing. Cattle production have increased by nearly 1 million heads from 12.6 million in 1994 to 13.5 million in 2004 and areas for grazing declined owing to expanding human settlements and other activities such as mining, crops, forestry and conservation. Beef cattle producers vary from highly sophisticated commercial (who rely on high technology) to communal subsistence producers (who rely on indigenous knowledge and appropriate technology). Three major groups of beef cattle farmers co-exist in South Africa. The commercial beef producer (mostly white farmers) where production is relatively high and comparable to developed countries. Their production is generally based on synthetic breeds and/or crossbreeding, using Indicus / Sanga types and their crosses as dams. The emerging black beef cattle farmer who own or lease land (LRAD beneficiaries). Their cattle generally consist of indigenous crossbred or exotic type of animals. The communal beef cattle farmer who farm on communal grazing land. Their cattle are mostly of indigenous types. 60% of the 14.1 million cattle available in South Africa are owned by commercial farmers and 40% by emerging and communal farmers. The gross value of beef production is dependent on the number of cattle slaughtered and the prices received by producers from abattoirs. The average gross value of beef produced during the period 1999/00 until 2008/09 amounted to R 7,879,500. Figure 1 below show the gross value of beef production during the period 1999/00 until 2008/09. 3
4 R'000 14,000,000 12,000,000 10,000,000 8,000,000 6,000,000 4,000,000 2,000,000 0 Figure 1: Gross Value of Beef Production 1999/ / / / / / / / / /09 Years Source: Agricultural Statistics Production Areas Beef is produced throughout South Africa. The amount of beef produced depends on the infrastructure such as feedlots and abattoirs, not necessarily by the number of cattle available in those areas. South Africa has highly developed transport infrastructure that allows movement of cattle and calves from one area to another, even from other countries such as Namibia. For these reasons, Mpumalanga commands the greatest share of beef production in South Africa accounting for 23% of the beef produced in 2009 followed by Free State and Gauteng taking up 20% and 13% respectively. Figure 2 below show the beef production per province during 2009 production year. There is an increase of 215% during 2008/09 compared to 1999/00. 4
5 Figure 2: Beef Production per Province 2009 Mpumalanga 23% Eastern Cape 7% Gauteng 13% Kwazulu-Natal 10% Free State 20% Western Cape 5% Limpopo 6% North West 9% Northern Cape 7% Source: Red Meat Levy Admin 1.2. Production Trends South Africa has approximately 495 abattoirs. Approximately 40% of all slaughtering are performed by abattoirs that may slaughter an unlimited number of animals (Class A) and approximately 60% of cattle are slaughtered by highly regulated abattoirs (Class A & B). Most of these abattoirs have linkages with feedlots. Over the past ten years the number of cattle slaughtered has significantly increased by 6.7% leading to 26.2% increase in beef production. This may be due to increasing demand. Figure 3 below show the slaughtering of cattle and production of beef during the period 1999/00 until 2008/09. 5
6 1,000,000,000 Figure 3: Cattle slaughtering and beef production 4,000,000 Kilograms 800,000, ,000, ,000, ,000,000 3,000,000 2,000,000 1,000,000 Cattle per head / / / / / /05 Years 2005/ / / /09 Production Slaughtering Source: Agricultural Statistics. Figure 3 above show that slaughtering and production of beef follows the same trend. Both increased significantly in 2005/06 to 2006/07 but declined in 2007/08. This decline might have been caused by global economic meltdown. An increase of 26% in production and 184,000 of number of cattle slaughtered was experienced in 2008/09 compared to 1999/ Local Consumption Figure 4 show local consumption of beef comparing it to total production for each year to determine if the country is self-sufficient in terms of beef production. 1,000,000,000 Figure 4: Beef production vs consumption 800,000,000 Kilograms 600,000, ,000, ,000, / / / / /04 Years 2004/ / / / /09 Production Consumption Source: Agricultural Statistics. 6
7 Figure 4 indicates that beef consumption was higher than beef production throughout the period under analysis. Both production and consumption followed the same trend. Both declined in 2000/01 and increased constantly from 2001/02 due to rising living standards and increased disposable income of larger number of consumers before reaching the highest level in 2006/07. Though in 2007/08 both declined slightly due to global economic meltdown, there was an increase in 2008/09 of 26% in production and 21% in consumption compared to 1999/00. Table 1 below show that South Africa does not produce enough beef for the domestic market even if the number of cattle slaughtered has increased considerably from 1999/00 to 2008/09. Table 1: Total cattle slaughtering, production and consumption of beef Cattle slaughtering Production Consumption Year Head Kilograms Kilograms 1999/00 2,726, ,000, ,000, /01 2,302, ,000, ,000, /02 2,510, ,000, ,000, /03 2,535, ,000, ,000, /04 2,599, ,000, ,000, /05 2,671, ,000, ,000, /06 2,972, ,000, ,000, /07 3,077, ,500, ,000, /08 2,781, ,700, ,000, /09 2,910, ,600, ,000,000 Source: Agricultural Statistics Employment Commercial farmers are estimated at , emerging farmers at and communal farmers 3 million. There are approximately 70 feedlots in South Africa and 495 abattoirs. Beef industry is a major employer with people employed and dependent on the livestock industry for their livelihood. 2. MARKET STRUCTURE 2.1. Domestic Market The red meat industry evolved from a highly regulated environment to one that is totally deregulated today. Various policies, such as the distinction between controlled and uncontrolled areas, compulsory levies payable by producers, restrictions on the establishment of abattoirs, the compulsory auctioning of carcasses according to grade and mass in controlled areas, the supply control via permits and quotas, the setting of floor prices, removal scheme, etc., characterised the red meat industry before deregulation commenced in the early 7
8 1990s. Since the deregulation of the agricultural marketing dispensation in 1997, the prices in the red meat industry are determined by demand and supply forces. Average producer prices of beef from 1999/00 to 2008/09 are illustrated in Figure Figure 5: Average beef producer prices Rands/kg / / / / /04 Years 2004/ / / / /09 Source: Agricultural Statistics. Figure 5 shows that prices of beef increased significantly from 1999/00 to 2008/09 mainly due to increased consumption caused by rising living standards of larger number of consumers and low domestic production. There was an increase of R13.77/Kg in 2008/09 compared to 1999/00. The market players in the beef industry are vertically integrated. They have their own feedlots, abattoirs, processors and distributors. Figure 6 below is a graphical representation of the market players. 8
9 SMMES's / Emerging / Subsistence 23% Figure 6: M arket share in the beef industry Chalmar 5% SIS 8% Karan Beef 25% Bull Brand 12% Beefcor 4% Beef Master 10% Sparta Beef 7% EAC Group 6% Source: SAMIC The chart shows that 77% of the beef market share is in the hands of 8 suppliers. The remaining 23% is owned by small, medium and micro enterprises. Karan Beef is the largest supplier commanding 25% of the total market share and Bull Brand is second with 12% market share Import Export Analysis Figure 7 compares volumes of imports and exports for beef from2000 to Figure 7: Beef Import and Export Quantities 25,000,000 20,000,000 Quantity (Kg) 15,000,000 10,000,000 5,000, Period (Years) Import Quantity Export Quantity Source: Quantec EasyData. Figure 7 indicates that South Africa s exports of beef were higher than imports in 2001 and This was due to weaker Rand that stimulated exports of beef 9
10 from South Africa and neighbouring countries to the European Union and Asia. There was a decrease of 25% in the year 2009 compared to The rest of the periods, from 2000 and from 2003 to 2009 imports of beef were far greater than exports. This was triggered by the increased domestic demand Exports South Africa exported approximately 4.6 million kilograms of beef in 2009 yielding an export value of R 185 million. There was an increase of 34% of quantity of beef exported and 204% of export value in 2009 compared to The quantity and the value for exports of beef are shown in Figure 8 below. Figure 8: Beef Exports Quantity (Kg) 12,000,000 10,000,000 8,000,000 6,000,000 4,000,000 2,000, Period (Years) 200,000, ,000, ,000, ,000, ,000, ,000,000 80,000,000 60,000,000 40,000,000 20,000,000 0 Value (Rands) Export Quantity Export Value Source: Quantec EasyData. Figure 8 indicates that the beef exports increased significantly in 2001 and 2002 in both quantity and value. In 2003, the quantity of beef exported declined but remained higher than 1999 level before declining to the lowest level in 2005 and fluctuated between 2 million and 4 million kilograms from 2006 to The export value of beef fluctuated from 2003 to 2005 before increased significantly from 2006 to Figure 9 below shows the main export market to different continents. 10
11 Figure 9: Beef exports to continents Quantity (Kg) Period (Years) Africa Asia Europe Oceania Americas Source: Quantec EasyData. South Africa was mainly exporting to Africa, mainly SADC throughout the period under analysis. European was the second continent to receive beef from South Africa from the year 2000 to 2007 and took its second level again in The following figure 10 to 14 gives an indication of where within the continents (Africa, Europe, Asia and Oceania) is beef from South Africa obtained. Figure 10: Beef exports to SADC Quantity (Kg) 1,800,000 1,600,000 1,400,000 1,200,000 1,000, , , , , Period (Years) Angola DRC Mauritius Malawi Mozambique Seychelles Zambia Zimbabwe United Republic of Tanzania Source: Quantec EasyData 11
12 Figure 10 displays that beef produced in South Africa was mainly exported to Mozambique which has commanded the highest beef exports through out the decade except in 2002 and 2008 only. During those periods (2002 & 2008) Angola took the lead, which made it the second country to obtain the highest beef exports from South Africa. Figure 11: Beef Exports to Western Africa Quantity (Kg) 180, , , , ,000 80,000 60,000 40,000 20, Period (Years) Côte d'ivoire Ghana Nigeria Saint Helena Source: Quantec EasyData. It is clearly indicated from figure 11 above that South African beef is exported to Nigeria in the western Africa followed by Ghana throughout the decade. In 2003 both Nigeria and Ghana reached a peak of Kg and Kg of South African beef respectively. 12
13 Figure 12: Beef exports to Middle and Eastern Africa 350, , ,000 Quantity (Kg) 200, , ,000 50, Period (Years) Congo Côte d'ivoire Ethopia Garbon Kenya Comoros Uganda Source: Quantec EasyData. In Middle and Eastern Africa, Gabon commanded the highest beef from South Africa throughout the period under analysis though its quantity exported was depreciating. Congo commanded the second highest beef from 2000 to 2009 while there were some intermittent among Côte d'ivoire, Ethiopia, Kenya, Comoros and Uganda. Figure 13: Beef exports to EU 4,000,000 3,500,000 3,000,000 Quantity (Kg) 2,500,000 2,000,000 1,500,000 1,000, , Period (Years) Belgium Germany France United Kingdom Netherlands 13
14 Source: Quantec EasyData. It is clearly indicated from figure 13 above that, from 2001 to 2004 and also in 2007 beef from South Africa was mainly exported to United Kingdom in the European Union countries. Germany is the second country to receive the highest exports during 2001 to Netherland commanded the highest share in 2009 only. There were some intermittent among Belgium, France and Netherlands from 2000 to Figure 14: Beef Exports to Asia Quantity (Kg) 500, , , , , , , , ,000 50, Period (Years) Source: Quantec EasyData. United Arab Emirates Bahrain Hong Kong Kuwait Lebanon Qatar United Arab Emirates commanded the highest share in 2000 and from 2004 to Though there were some fluctuations in beef exports throughout the decade, Lebanon commanded the greatest share of South African beef in 2002 and obtained the second highest level in
15 Figure 15: Beef export destinations in 2009 Zimbabw e 2% Zambia 1% Not allocated 10% Angola 14% Democratic Republic of the Congo 5% Germany 3% Netherlands 31% Gabon 3% Nigeria 3% Mozambique 28% Source: Quantec EasyData. The main destination of South African beef is Netherlands which commanded 31% of South African beef during 2009 followed by Mozambique by 28%. The two countries are the net importers because together they constitute 59%, the other seven countries share 39% and 10% is unallocated. Values of beef exports from various provinces of South Africa are presented in Figure 16. Figure 16: Value of beef exports by Provinces Value (Rands) Period (years) Western Cape Eastern Cape Northern Cape Free State Kwazulu-Natal North West Gauteng Mpumalanga Limpopo Source: Quantec EasyData. Figure 16 indicates that Gauteng have recorded high export values of beef between the periods 2000 and This is mainly due to the fact that most 15
16 exporters of beef are situated in Gauteng Province and the greatest proportion of beef was exported to neighboring countries and Gauteng Province is the main exit point. Exports of beef were also recorded in Western Cape, Northern Cape, Mpumalanga, Mpumalanga and Northern Cape provinces. The following figures (Figures 17-25) show the value of beef exports from the various district municipalities in the nine provinces of South Africa. Value (Rands) Figure 17:Value of beef exports from Western Cape Province 45,000,000 40,000,000 35,000,000 30,000,000 25,000,000 20,000,000 15,000,000 10,000,000 5,000,000 Period (Years) City of Cape Tow n 8,853,243 19,418,096 15,355,203 12,885,447 10,019,481 5,958,250 17,095,345 11,954,484 28,846,403 40,886,649 West Coast , ,156 0 Cape Winelands , Eden 0 2,766,888 1,037,805 2,814 1, ,244, Source: Quantec EasyData. In the Western Cape, beef exports were recorded mainly in the City of Cape Town and Eden district municipalities. City of Cape Town district municipality recorded high export values the lowest level in 2005 by R 6 million and the highest value during 2009 by R 41 million. This is due to the fact that the City of Cape Town is the main exit point in the province. 16
17 Value (Rands) 4,500,000 4,000,000 3,500,000 3,000,000 2,500,000 2,000,000 1,500,000 1,000, ,000 0 Period (Years) Figure 18: Value of beef exports from Eastern Cape Province Cacadu 325, ,862 3,733, , , Nelson Mandela 0 1,514, ,013 1,148,7314,269, , , Source: Quantec EasyData. In the Eastern Cape Province, beef exports were recorded from Cacadu and Nelson Mandela district municipalities. The highest export value was recorded from Cacadu district in 2002 and from Nelson Mandela district in ,000,000 30,000,000 Figure 19: Value of beef exports from Northern Cape Province Value (Rands) 25,000,000 20,000,000 15,000,000 10,000,000 5,000,000 0 Period (Years) Pixley ka Seme 0 2,126,955 12,589,474 6,163,386 29,588, ,932 2,988,159 8,529,557 3,175,706 32,710,422 Siyanda 522,021 34, ,569 6, Source: Quantec EasyData. The Northern Cape Province has recorded beef exports from two district municipalities namely, the Pixley ka Seme and Siyanda. Pixley ka Seme district municipality dominated the export values of beef from 2004 to
18 80,000 Figure 20: Value of beef exports from Free State Province 70,000 60,000 Value (Rands) 50,000 40,000 30,000 20,000 10,000 0 Period (Years) Lejweleputswa , Thabo Mofutsanyane 0 0 9, Source: Quantec EasyData Figure 20 indicates that exports of beef from the Free State Province occurred in Lejweleputswa district municipality in 2006 while in Thabo Mofutsanyane district municipality exports were recorded only in ,000,000 Figure 21: Value of beef exports from KwaZulu-Natal Province 10,000,000 Value (Rands) 8,000,000 6,000,000 4,000,000 2,000,000 Period (Years) Ugu , ,896 99, , Umgungundlovu 14, Uthukela 0 33,599 10, Uthungulu , ethekw ini 322,037 1,425,026 4,393,672 6,379, ,205 3,682,022 7,024,701 10,709,869 3,161,359 3,642,573 Source: Quantec EasyData In the KwaZulu Natal Province, beef exports were mainly from ethekwini district municipality showing increases in the value of the exports from 2001 until 2003 and again from 2005 until 2007 with the lowest level recorded in Ugu district municipality recorded beef export values from 2002 to Tiny export 18
19 values were recorded in Umgungundlovu, Uthukela and Uthungulu district municipalities and fluctuated from 2000 to Value (Rands) Figure 22: Value of beef exports from North West Province 9,000,000 8,000,000 7,000,000 6,000,000 5,000,000 4,000,000 3,000,000 2,000,000 1,000,000 0 Period (Years) Bojanala 280,825 5, , Southern ,188,636 Bophirima ,334 Source: Quantec EasyData In North West Province beef exports recorded mainly through Bojanala district and Southern municipalities. Bojanala district municipality recorded the highest value during 2000 and 2002, while Southern district municipality recorded the highest value during Value (Rands) 80,000,000 70,000,000 60,000,000 50,000,000 40,000,000 30,000,000 20,000,000 10,000,000 0 Period (Years) Figure 23: Value of beef from Gauteng Province Sedibeng ,935 5,414,295 9,015,622 2,990,024 1,120, , ,241 West Rand 6,780,417 10,702,491 15,086,461 15,299, ,573 28,306,883 24,813,599 22,705, ,812 2,866,437 Ekurhuleni 6,776,675 6,866,462 3,504,979 5,861,757 7,250,884 3,743,074 10,629,304 15,530,756 13,415,321 13,157,912 City of Johannesburg 15,854,162 25,785,691 24,229,176 16,016,947 31,996,976 21,555,618 21,170,366 32,003,589 69,890,467 57,444,188 City of Tshw ane 13,128,058 17,083,973 41,467,586 10,351,843 20, , , , ,975 Source: Quantec EasyData Exports of beef in Gauteng Province were fluctuating among City of Johannesburg, City of Tshwane, West Rand, Ekurhuleni and Sedibeng district municipalities. From 2000 to 2009, all the districts experienced fluctuations in the value of beef exports with City of Johannesburg, City of Tshwane and West Rand competing for dominance. 19
20 40,000,000 Figure 24: Value of beef exports from Mpumalanga Value (Rands) 35,000,000 30,000,000 25,000,000 20,000,000 15,000,000 10,000,000 5,000,000 0 Period (Years) Gert Sibande 7,817,112 12,016,572 9,184,862 18,757,444 34,776,217 1,705,910 1,914,175 1,444,516 16,564,462 21,252,019 Nkangala 14,327 4,455 9, ,001 53,011 88,499 Ehlanzeni 42, , ,809 5,202,856 1,693,214 3,030, ,044 1,229, ,200,809 Source: Quantec EasyData. In the Mpumalanga Province, Gert Sibande and Ehlanzeni district municipalities have played an important role in the export of beef since 2000 with increased export values. Gert Sibande dominated the market through out the decade and recorded the highest export value in 2004 and Figure 25: Value of beef exports from Limpopo Province 140, ,000 Value (Rands) 100,000 80,000 60,000 40,000 20,000 0 Period (Years) Mopani , , Vhembe 11, ,308 Waterberg , , Source: Quantec EasyData. Exports of beef in the Limpopo Province fluctuated among Vhembe, Waterberg and Mopani district municipalities from 2000 to The highest export values were recorded in Waterberg district municipality from 2002 to Share Analysis. 20
21 Table 2: Share of provincial beef exports by South Africa (%) Year Province Western Cape Eastern Cape Northern Cape Free State Kwazulu-Natal North West Gauteng Mpumalanga Limpopo Total Source: Calculated from Quantec EasyData. From Table 2 above, Gauteng Province commands the greatest share of South Africa s beef exports followed by Western Cape Province. This is mainly due to the fact that most exporters of beef are situated in Gauteng Province and the greatest proportion of beef was exported to neighboring countries and Gauteng Province is the main exit point. Northern Cape, Kwazulu Natal, Eastern Cape and Mpumalanga provinces were regular exporters while Free State, North West and Limpopo registered fractional exports of beef. The following Tables 3 to 11 shows a share of the various district municipalities beef exports to the various provincial beef exports. Table 3: Share of district beef exports to the total Western Cape provincial beef exports (%) Year District City of Cape Town West Coast Cape Winelands Eden Total Source: Calculated from Quantec EasyData. City of Cape Town district municipality has commanded the greatest share of beef exports in Western Cape Province during the period 2000 and During the same period, Eden district municipality recorded intermittent exports of beef. Fractional exports of beef were recorded from West Coast and Cape Winelands district municipalities in 2003 and Table 4: Share of district beef exports to the total Eastern Cape provincial beef exports (%) Year District Cacadu Nelson Mandela Total Source: Calculated from Quantec EasyData. 21
22 In Eastern Cape Province exports of beef were recorded from Cacadu and Nelson Mandela district municipalities but diminished in Table 5: Share of district beef exports to Northern Cape provincial beef exports (%) Year District Pixley ka Seme Siyanda Total Source: Calculated from Quantec EasyData From Northern Cape Province, Siyanda district municipality commanded 100% share of all beef exports in 2000 while Pixley ka Seme commanded the greatest share from 2001 increasing to 100% from 2005 to Table 6: Share of district beef exports to the total Free State provincial beef exports (%) Year District Lejweleputswa Thabo Mofutsanyane Total Source: Calculated from Quantec EasyData. Table 6 shows that exports of beef in Free State Province occurred from the Lejweleputswa district municipality in 2006 and Thabo Mofutsanyane district municipality in Table 7: Share of district beef exports to the total KwaZulu Natal provincial beef exports (%) Year District Ugu Umgungundlovu Uthukela Uthungulu ethekwini Total Source: Calculated from Quantec EasyData From Kwazulu-Natal province, ethekwini district municipality has commanded the greatest share of beef exports from 2000 to The beef exports also occurred in Umgungundlovu district municipality in 2000 and in Uthukela district from 2001 to Ugu district municipality exported beef from 2002 to 2006 but diminished from Table 8: Share of district beef exports to the total North West provincial beef exports (%) Year District Bojanala Southern
23 Bophirima Total Source: Calculated from Quantec EasyData. Bojanala district municipality in the North West Province commanded 100% share of all beef exports from 2000 to From 2003 to 2008 exports of beef diminished entirely from the North West Province and were recorded again in Table 9: Share of district beef exports to the total Gauteng provincial beef exports (%) Year District Sedibeng West Rand Ekurhuleni City of Johannesburg City of Tshwane Total Source: Calculated from Quantec EasyData. In Gauteng Province beef exports occur mainly through the City of Johannesburg, Ekurhuleni, West Rand, Sedibeng and City of Tshwane district municipalities. From 2000 to 2009, these district municipalities have experienced fluctuations in the value of beef exports with City of Johannesburg commanding over 50% share in 2004 and 2008 to Table 10: Share of district beef exports to the total Mpumalanga provincial beef exports (%) Year District Gert Sibande Nkangala Ehlanzeni Total Source: Calculated from Quantec EasyData. From Mpumalanga Province, Gert Sibande district municipality has commanded the greatest share of beef exports from 2000 to 2009 followed by the Ehlanzeni district municipality. Fractional exports of beef were recorded from Nkangala district municipality during the year 2000 to 2002 and 2007 to Table 11: Share of district beef exports to the total Limpopo provincial beef exports (%) Year District Mopani Vhembe Waterberg Total
24 Source: Calculated from Quantec EasyData. From Limpopo Province, exports of beef occurred in 2000 and 2009 from the Vhembe district municipality and during 2002 to 2003 from the Mopani district municipality and Waterberg district municipality during 2003 and Imports. South Africa imported approximately 10 million kilograms of beef in 2009 at an estimated value of R 140 million. The import quantity showed a significant decline of 25% in 2009 compared to These declines might have been caused by global economic meltdown that occurred from August Figure 26 below show the imports of beef from 2000 to Figure 26: Beef imports Quantity (Kg) 25,000,000 20,000,000 15,000,000 10,000,000 5,000, ,000, ,000, ,000, ,000,000 50,000,000 Valur (Rands) Period (Years) 0 Quantity Value Source: Quantec EasyData. The imports value and quantity of beef followed the same trend throughout the previous decade. Both reached the lowest level in 2001 and 2002 before increasing steadily from 2003 to In general beef imports decreased by 25% in 2009 compared to Figure 27 below show the main suppliers of beef from other continents during the period 2000 to
25 Figure 27: Quantity of beef imported from continents 25,000,000 20,000,000 Quantity (Kg) 15,000,000 10,000,000 5,000, Period (Years) Africa America Asia Europe Oceania Source: Quantec EasyData. Figure 27 above indicates that the main supplier of beef to South Africa is America from 2002 to The beef quantity from America has been increasing from the year 2003 to 2005; it remained the main supplier though it decreased from 2006 to There were some recorded intermittent among America, Oceania, Europe, and Africa in 2000 to The following Figures 28 to 29 indicate the origins of beef in America and Asia. Figure 28: Beef imports from South America 12,000,000 10,000,000 Quantity (Kg) 8,000,000 6,000,000 4,000,000 2,000, Period (Years) Source: Quantec EasyData. Argentina Brazil Uruguay Paraguay Figure 28 clearly indicates that the highest quantities of beef imports in South America originated from Brazil, Uruguay, Argentina and Paraguay and have been competing for dominance throughout the period under analysis. Brazil reached a peak in 2004, Uruguay in 2006 and Paraguay in
26 Figure 29: Beef Imports from Oceania 3,500,000 3,000,000 2,500,000 Quantity (Kg) 2,000,000 1,500,000 1,000, , Period (Years) New Zealand Australia Source: Quantec EasyData. In Oceania, Australia has been the main importer of beef to South Africa during the period under analysis and it reached its peak of 3 million kg of beef during New Zealand commanded the second highest level of beef imports from 2000 to 2009 Figure 30: Countries of origin for beef imports in 2009 Argentina 27% Uruguay 41% Australia 18% Paraguay 13% New Zealand 1% Source: Quantec EasyData. 26
27 Figure 30 above shows the share of various suppliers of beef to South Africa in Uruguay commanded 41% share of South Africa s import market of beef followed by Argentina commanding up to 20%, Australia 18% and Paraguay 13%. 3. BEEF MARKET VALUE CHAIN Beef market value chain is illustrated on Figure 31. Figure 31: South African Beef Market Value Chain 48.6 million Consumers Per capita consumption = kg / year 7 to 13% of Agricultural GDP Affluent consumers (Premium beef markets) million kg produced 7 million kg imported to weaners imported 3.5 million kg exported Under Privileged Consumers Meat Processors (495 Abattoirs) Feedlot sector (65 to 70% of cattle slaughtered) Sanga types - 29% Zebu types - 11% British types - 26% European types - 27% Dairy / other - 7% Commercial Producers 8.2 million cattle Source: ARC with potential to commercialize Local Markets Butchers - 18% Auctions - 41% Festivities - 35% Previously Disadvantaged Groups emerging farmers 3 million subsistence farmers 5, 69 million cattle 27
28 It is estimated that there are approximately commercial farmers currently farming with livestock. This includes producers that keep livestock as their main enterprise and those that keep livestock as a secondary enterprise. They own around 8.2 million cattle. There are small-scale farmers and 3 million subsistence farmers that own around 5.69 million cattle. The beef supply chain has become increasingly vertically integrated. This integration is mainly fuelled by the feedlot industry where most of the large feedlots own their own abattoirs, or at least have some business interest in certain abattoirs. In addition, some feedlots have integrated further down the value chain and sell directly to consumers through their own retail outlets. Some abattoirs have also started to integrate vertically towards the wholesale level. Under the previous marketing regime, wholesalers mostly bought carcasses through the auction system. Currently, many wholesalers source live slaughter animals (not weaners) directly from farmers or feedlots on a bid and offer basis, i.e. they take ownership of the animal before the animal is slaughtered. The animal is then slaughtered at an abattoir of the wholesaler s choice, where after the carcass is distributed to retailers. In some instances, the public can also buy carcasses directly from wholesalers. The abattoir industry has expanded tremendously in number and in capacity. In this regard, it is important to note that this industry can be divided into those abattoirs that (i) are linked to the feedlot sector and the wholesale sector, or are owned by municipalities and (ii) those that are mainly owned by farmers and SMME s. The former abattoirs are mainly class A and B abattoirs, whereas the latter are usually classified as C, D and E class abattoirs. The beef industry produces around tons of meat and imports around tons while exporting tons. Per capita consumption is around kg and number of consumers is around 48.6 million. Table 12 below shows the industry role players. 28
29 Table 12: Industry role players No. Name Description Contact Details 1 AUSTIN EVANS FEEDLOT Feedlot P O Box 397, Somerset East, 5850 T : (042) F : (042) ADAM AGRI Feedlot PO Box 75, Colesberg, 9795 T: (051) F: (051) BEEFCOR It is situated east of Pretoria. It owns and operates the Bayview Feedlot, Boskop Ranch and Beefcor Wholesale. The feedlot carries head and markets between and head annually, most of which are distributed in Gauteng. The company also has a 20% share in Hidskin Processors and a 25% share in Chamdor Abattoir. 4 BEEFMASTER It is a private, family owned business situated 10 km from Christiana, in the North-West province. The feedlot carry around cattle standing at any given time. It currently supplies approximately 10% of the country s beef and with its geographic position delivers to all nine provinces within 24 hours. 5 Bull Brand It is owned by Bull Brand - integrated Meat Company situated in Krugersdorp. It has fresh meat production process-abattoir, deboning, added value department and canning. They own two feedlots in Potchefstroom and Magaliesberg and they both carry heads of cattle at any point in time. 6 BRAAMS VOERKRALE BK P O Box 187, Bronkhorstspruit, 1020 T : (013) F : (013) P O Box 425, Christiana, 2680 T : (053) F : (053) Feedlot P O Box 158, Durbanville, 7551 T : (021) F : (021) CB FEEDLOT Feedlot P O Box 44, Reitz, 9810 T: (058) F : (058)
30 No. Name Description Contact Details 8 CHALMAR BEEF It is situated in Bronkhorspruit. Its feedlot carries head of cattle standing at any given time. When the new abattoir and de-boning facility opened for business in 2003, Chalmar beef became fully integrated. P O Box , Wingate Park, 0153 T : (011) F : (011) D C LOUW FEEDLOT Feedlot P O Box 56, Adelaide, 5760 T : (046) F : (046) DOORNBULT VOERKRALE (Pty) Ltd Feedlot P O Box 13, Ladanna, 0704 T : (015) F : (015) EAC Group Started by Claassen 40 years back. In 1986, joined the force with two shareholders and started Midland meat factory. They have distribution network in Kwazulu Natal. Four modern abattoirs operate from Wolwehoek, Harrismith, Vereeniging and Frankfort. All three feedlots are situated in the calf weaner and lamb weaner producing areas and they carry cattle at any specific time. The feedlots thus form an ideal marketing channel for weaner producers. 12 FORTRESS BONSMARAS It is situated 12 km north-west of Frankfort, Free State. It is a beautiful farm (2.925 ha) and the capacity of the feedlot is about 6000 weaners of Bonsmara or Bonsmaracross per annum. 13 KAMEELDRIFT VOERKRAAL Feedlot P O Box 630, Frankfort, 9830 T : (011) F : (011) F : PO Box 15648, Kameeldrift Oos T: F: KANHYM ESTATES LTD. Feedlot P O Box 89, Middelburg, 1050 T : (013) /3 F : (013) Karan Beef It is a family business situated at Heidelberg, south of Johannesburg. It operates feedlot, feed mill, abattoir and meat processing. The feedlot accommodates over head of cattle - making the Karan Beef feedlot the largest in Africa. The abattoir has the capacity to process up to 1 30 PO Box 53, Heidelberg, 1438, RSA Tel: Fax: feedlot@karanbeef.com
31 No. Name Description Contact Details 600 head of cattle every day. 16 KELLERMAN BOERDERY Feedlot P O Box 74,Koringberg,7312 T : F: (021) KLEYNFAAN FEEDLOT Feedlot P O Box 169, Vryheid, 3100 T : (034) F : KOODOOLAKE Feedlot P O Box 275, Stella, 8650 T : F : KOREM FARM Feedlot PO Box 58893, Karenpark, 0118 T : F : LIEBENBERGSTROOM VOERKRAAL BPK Feedlot P O Box 130, Edenville, 9535 T : (056) F : (056) MANJOH RANCH Feedlot P O Box 1052, Nigel, 1490 T : (011) F : (011) /3/4 F : (011) MADIKOR Feedlot P O Box 1050,Louis Trichardt,0920 T : (015) F : (015) / MIKRON BOERDERY Feedlot PO Box 357, Bultfontein, 9670 T: F: MLEKI`S BEEF Feedlot Postnet Suite 327, Private Bag x 2020 Isando, 1600 T: F: C: MUSHLENDOW Feedlot P O Box 357, Koster,
32 No. Name Description Contact Details T : (014) F : (014) MVB FEEDERS Feedlot P O Box 848, Louis Trichardt, 0920 T : (015) F : (015) PIET WARREN PLASE Feedlot P O Box 1, Gravelotte, 0895 T : (015) F : (015) POPPIELAND TRUST Feedlot P O Box 9, Bultfontein, 9670 T : (051) F : (051) RANCH ESTATES Feedlot P O Box 1270, Delmas, 2210 T : (013) F : (013) R : (011) SIS FARMING Is located in the Bethal/Ermelo region of the Mpumalanga escarpment. It purchases weaners from other farmers to fatten for subsequent sale and delivery to the Witbank Abattoir. It has cattle standing at any given time. P O Box 201, Bethal, 2310 T (013) F : (013) SKS BOERDERY Feedlot P O Box 348, Middelburg, 1050 T : (013) F : (013) SPARTA BEEF It is a family-owned and operated cattle feedlot and farming concern. The feedlot has around cattle standing at any time. The present operation was established on the farm "Sparta", a sub-division of the farm "Middel " in the Marquard district, during the 1960's. The farm "Middel", has been in the family for over 100 years and since inception, farmed as a family business. Originally mixed farming - cattle, sheep, pigs, plus various crops, such as maize (corn), wheat, oats and potatoes - was practiced on the farm. Sparta Beef expanded its horizons by entering into a joint venture P O Box 64, Marquard, 9610 T : (051) F : (051) R : (051)
33 No. Name Description Contact Details 33 TAAIBOSCHBULT Pty Ltd where it tans cattle hides in Butterworth, Eastern Cape. Later, in January 1999, it acquired a large abattoir in Welkom, Northern Free State, with Black Empowerment and other local business interests now known as Sparta Foods (Pty) Ltd. At the beginning of 2001, it started a wholesale department called Sparta Foods in Benoni (Gauteng). Owned by Bull Brand P O Box 2092, Potchefstroom, 2520 T : (018) F : (018) THERON BOERDERY Feedlot Elsonstraat 84, Pretoriawes, 0183 T : (012) F : (012) TRIPLE C FEEDLOT feedlot P O Box 1723, Dundee, 3000 T: (034) F: (034) C: VENCOR Feedlot P O Box 749, Ladanna, 0704 T : (015) F : (015) C : VERCUIEL Feedlot PO Box 245,Stella,8650 T: F: WINDHOEK BOERDERY 39 VERGEZIGHT FEEDLOT Source: SA feedlot Association. Feedlot Feedlot PO Box 387,Pietersburg,0700 T: F: PO Box 1034, Heilbron,9650 T: /2/3 F:
34 4. MARKET INTELLIGENCE Export tariffs. Tariffs that different importing countries applied to beef originating from South Africa in 2009 are shown in Table 13 and 14. Table 13: Export tariffs of beef, fresh or chilled Country Product Code Trade Regime Description Angola (Carcasses or half-carcasses of bovine animals, fresh or chilled) Kuwait (Carcasses or half-carcasses of bovine animals, fresh or chilled) Mozambique (Carcasses or half-carcasses of bovine animals, fresh or chilled) Netherlands (Carcasses or half-carcasses of bovine animals, fresh or chilled) Nigeria United Kingdom Source: Market Access Map (Carcasses or half-carcasses of bovine animals, fresh or chilled) (Carcasses or half-carcasses of bovine animals, fresh or chilled) MFN duties Applied MFN duties Applied Preferential tariff for South Africa MFN duties Applied MFN duties Applied MFN duties Applied 2009 Applied Total Ad Tariffs valorem Equivalent Tariff (estimated) 10.00% 10.00% 0.00% 0.00% 15.00% 15.00% 12.80% % $/Ton 20.00% 20.00% 12.80% $/Ton 67.28% Table 13 indicates that European Union (Netherlands and United Kingdom) applies the highest tariff rate of % on beef, fresh or chilled originating from South Africa followed by Nigeria with 20%, Mozambique with 15%, Angola with 10% and Kuwait is the lowest with 0%. 34
35 Table 14: Export tariffs of beef, frozen Country Product Code Trade Regime Description Angola (Frozen carcasses and half carcasses) Democratic (Frozen Republic of carcasses and half carcasses) Congo Egypt (Frozen carcasses and half carcasses) Israel (Frozen carcasses and half carcasses) Mozambique (Frozen carcasses and half carcasses) Netherlands (Frozen carcasses and half carcasses) Source: Market Access Map MFN duties Applied MFN duties Applied MFN duties Applied MFN duties Applied Preferential tariff for South Africa MFN duties Applied 2009 Applied Total Ad Tariffs valorem Equivalent Tariff (estimated) 10.00% 10.00% 10.00% 10.00% 0.00% 0.00% 0.00% 0.00% 15.00% 15.00% 12.80% $/Ton 75.21% Table 14 above shows that Netherlands (EU) apply the highest tariff rate of 75.21% on frozen beef of South Africa followed by Mozambique with 15%, Angola and DRC with 10%. Egypt does not apply any tariff rate for South African frozen beef. The two tables show that European Union s beef market is highly protected Import tariffs. South Africa applies an import tariff of 40.00% or $ /ton whichever is the greater to all imports of beef excluding Namibia which is a member of SADC. Namibia receives an Intra SACI tariff rate of 0% when exporting fresh or chilled beef carcasses and half carcasses to South Africa. Table 15 and 16 below has details. 35
36 Table 15: Import tariffs of beef, fresh or chilled Country Product Code Trade 2009 Regime Applied Tariffs Total Ad Description valorem Equivalent Tariff (estimated) Argentina MFN duties 40.00% or 40.00% (Carcasses or halfcarcasses of bovine whichever is the Applied $/Ton animals, fresh or greater chilled) Australia (Carcasses or halfcarcasses of bovine animals, fresh or chilled) Austria (Carcasses or halfcarcasses of bovine animals, fresh or chilled) Belgium (Carcasses or halfcarcasses of bovine animals, fresh or chilled) Namibia (Carcasses or halfcarcasses of bovine animals, fresh or chilled) Source: Market Access Map MFN duties Applied MFN duties Applied MFN duties Applied Intra SACU rate 40.00% or $/Ton whichever is the greater 40.00% 40.00% or 40.00% $/Ton whichever is the greater 40.00% or 40.00% $/Ton whichever is the greater 0.00% 0.00% 36
37 Table 16: Import tariffs of beef, frozen Country Product Code Trade Regime Description Argentina (Frozen carcasses and half carcasses) Namibia (Frozen carcasses and half carcasses) New Zealand (Frozen carcasses and half carcasses) Paraguay (Frozen carcasses and half carcasses) Uruguay (Frozen carcasses and half carcasses) Source: Market Access Map MFN duties Applied Intra SACU rate MFN duties Applied MFN duties Applied MFN duties Applied Applied Tariffs 40.00% or $/Ton whichever 2009 Total Ad valorem Equivalent Tariff (estimated) 40.00% is the greater 0.00% 0.00% 40.00% or $/Ton whichever is the greater 40.00% or $/Ton whichever is the greater 40.00% or $/Ton whichever is the greater 40.00% 40.00% 40.00% Table 16 above shows the import tariffs applied by South Africa to the exporting countries of frozen beef. Argentina, New Zealand, Paraguay and Uruguay receive the applied tariff of 40% and Namibia receives an Intra SACU tariff rate of 0%. 37
38 5. PERFORMANCE OF SOUTH AFRICAN BEEF INDUSTRY IN Exports. Table 17: List of importing markets for Beef (fresh or chilled) exported by South Africa in 2009 South Africa s export represents 0.06% of world export for the Beef (fresh or chilled); its ranking in world exports is 39. Importers Exported value 2009, USD thousand Trade balance 2009 in USD thousand Share in South Africa's exports, % Exported quantity 2009 Quantity unit Unit value, (USD/unit) Trade Indicators Exported growth in value between , %, p.a. Exported growth in quantity between , %, p.a. Exported growth in value between , %, p.a. Ranking of partner countries in world imports Share of partner countries in world imports, % Total import growth in value of partner countries between , %, p.a. 'World Tons Tariff (estimated) faced by South 'Netherlands Tons 'n/a 'Mozambique Tons 'n/a 'Angola Tons 'n/a 'Nigeria Tons 'n/a 'Kuwait Tons 'n/a 'United Kingdom Tons 'n/a 'Egypt Tons 'n/a 'Gabon Tons 'n/a 'Ship stores and bunkers Tons 'n/a 'DRC Tons 'n/a 'Mauritius Tons 'n/a 'UAE Tons 'n/a 'Germany Tons 'n/a 'Norway Tons 'n/a 'Qatar Tons 'n/a 'Seychelles Tons 'n/a Source: ITC calculations based on COMTRADE statistics. Africa 38
39 Table 17 shows that during 2009 South Africa exported a total of tons of beef (fresh or chilled) at an average value of US$ 5 139/unit. The major export destinations for beef (fresh or chilled) originating from South Africa during 2009 were Netherlands, Mozambique, Angola and Nigeria. Netherlands and Mozambique are the leading markets for beef (fresh or chilled), accounting for 24.31% and 15.76% respectively of South Africa s export market. On average, during the period 2005 and 2009 South Africa s exports for beef (fresh or chilled) to Netherlands experienced a 103% and 320% increase in value and quantity respectively per annum. Similarly those to Mozambique increased by 39% in value and 28% in quantity during the period 2005 and 2009; and increased by 172% in value during the period 2008 and South Africa s exports for beef (fresh or chilled) to the world increased in value and in quantity by 18% and 16% respectively during the period 2005 to 2009 and increased by 16% in value between 2008 and
40 40
41 The above chart illustrates that between 2005 and 2009 South Africa s beef (fresh or chilled) exports to Angola, United Arab Emirates (UAE) and Congo were growing at a rate that is less than their import growth from the rest of the world. Congo represents losses in the declining market with an annual South African export growth of -16% and its import growth is -3%. Angola and UAE represent gains in the dynamic markets of South Africa fresh or chilled beef exports. South Africa s beef (fresh or chilled) exports to Netherlands, United Kingdom (UK), Seychelles, Kuwait, Mozambique and Gabon were growing at a rate that is greater than their imports from the rest of the world during the periods 2005 and Netherlands, Seychelles and Kuwait represent gains in dynamic markets and UK represent gains in the declining market of South Africa fresh or chilled beef exports. Gabon s annual growth of South African fresh or chilled beef exports represent gains (2%) but its annual imports growth is stagnant (0%). Generally Netherlands is the most growing in demand of South African fresh or chilled beef with an annual growth of 103% 41
42 42
43 The chart above indicates that South Africa s fresh or chilled beef has been mainly exported to Netherlands with a share of 24.31% followed by UK with a share of 4.45% during If South Africa wishes to diversify its exports of fresh or chilled beef exports, Democratic Republic of Congo (DRC) due to its annual import growth of 68% and UAE is the also an alternative market with an annual import growth of 40%. South Africa can glance in penetrating these markets because their shares are both not impressive with 3.29% for DRC and 2.46% for UAE. 43
44 Table 18: List of importing markets for the Beef (frozen) exported by South Africa in South Africa s export represents 0.13% of world export for frozen beef; its ranking in world exports is 56. Importers Exported value 2009 (USD thousand) Trade balance 2009 (USD thousand) Share in South Africa's exports (%) Exported quantity 2009 Quantity unit Unit value (USD/unit) Trade Indicators Exported growth in value between (%, p.a.) Exported growth in quantity between (%, p.a.) Exported growth in value between (%, p.a.) Ranking of partner countries in world imports Share of partner countries in world imports (%) Total import 'World Tons 'Netherlands Tons 'Ship stores and bunkers Tons 'Mozambique Tons 'Israel Tons 'Egypt Tons 'Angola Tons 'DRC Tons 'Germany Tons 'Nigeria Tons 'Ghana Tons 'United Kingdom Tons 'Gabon Tons 'Seychelles Tons 'Zimbabwe Tons 'Congo Tons 'Switzerland Tons 'Norway Tons 'Saint Helena Tons 'Madagascar Tons 'Mauritius Tons 'Zambia Tons Source: ITC calculations based on COMTRADE statistics. growth in value of partner countries between (%, p.a.) 44
45 Table 18 shows that during 2009 South Africa exported a total of tons of frozen beef at an average value of US$ 4 500/unit. The major export destinations for frozen beef originating from South Africa during 2009 were Netherlands with a share of 34.7% followed by Mozambique with a share of 13.3%. Exports of frozen beef exported by South Africa during the periods 2005 and 2009 experienced an increase of 15% in value and 17% in quantity. During the same periods exports to Mozambique increased by 15% in value and 12% in quantity. Between the period 2008 and 2009, South Africa s exports of frozen beef increased by 55% in value and Mozambique increased by 8% in value. 45
46 46
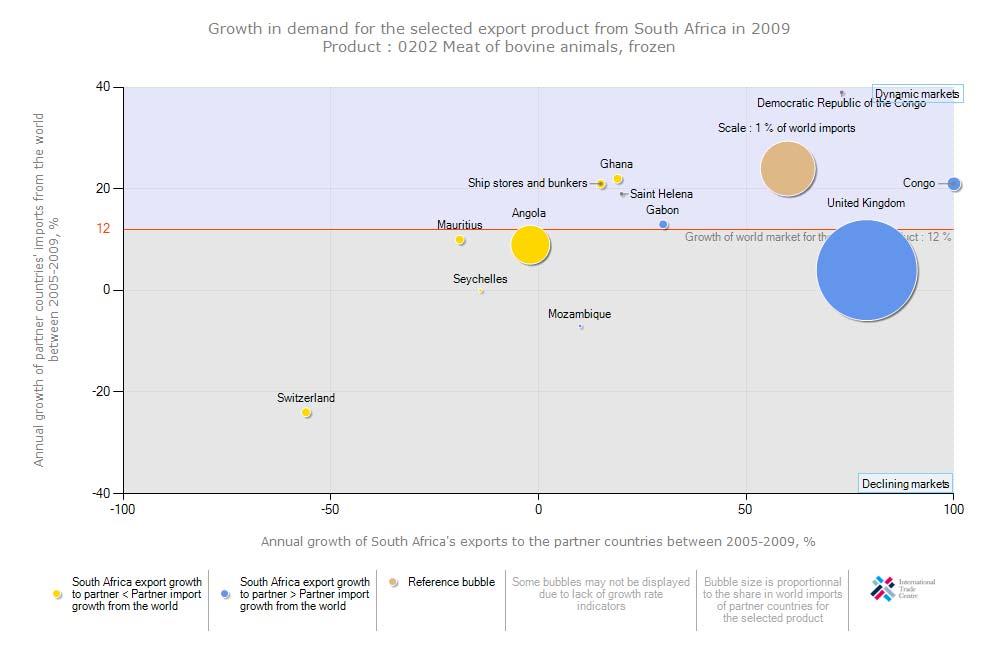
47 The chart illustrates that between 2005 and 2009 South Africa s frozen beef exports to Angola, Mauritius, Switzerland, Seychelles and Ghana were growing at a rate that is less than their import growth from the world. Angola, Mauritius, Switzerland and Seychelles represent losses in declining market and Ghana represent gains in dynamic market of South Africa frozen beef. During the same period, South Africa s frozen beef exports to United Kingdom (UK) Congo, Democratic Republic of Congo (DRC), Gabon, Saint Helena and Mozambique were growing at a rate that is greater than their imports from the rest of the world. Congo experienced the highest growing demand of South African frozen beef at a 148% rate followed by UK with 79% and it is the biggest market in the world. 47
48 48
49 The figure shows the prospects for market diversification for beef (frozen) exports by South Africa in South African s frozen beef was mostly exported to Netherlands which commanded market share of 34.73%. If South Africa is to diversify its frozen beef exports, the most attractive market exists in DRC which is the smallest market in the world but its annual growth is the highest at a rate of 39%. 49
50 5.2. Imports. Table 19: List of supplying markets for the beef (fresh or chilled) imported by South Africa in 2009 South Africa represents 0% of world imports for beef (fresh or chilled); its ranking in world imports is 105. Exporters Imported value 2009, USD thousand Trade balance 2009 in USD thousand Share in South Africa's imports, % Imported quantity 2009 Quantity unit Unit value, (USD/unit) Trade Indicators Imported growth in value between , %, p.a. Imported growth in quantity between , %, p.a. Imported growth in value between , %, p.a. Ranking of partner countries in world exports Total export growth in Tariff (estimated) Share of partner value of partner applied by South countries in countries between Africa world exports, % , %, p.a. 'World Tons 'Area Nes Tons 4891 'Namibia Tons '0 'Australia Tons '40 'Argentina '40 'Austria '40 'Belgium '40 'Brazil '40 'Canada '40 'Colombia '40 'Denmark '40 'France '40 'Ireland '40 'Poland '40 'Spain '40 'USA '40 'Angola 1670 '0 'Bahrain 115 '40 'Burundi 2 '40 'Chad 1 '40 'Comoros 2 '40 'Congo 113 '0 'DRC 364 '0 Source: ITC Trade Map. 50
51 Table 17 shows that during 2009 South Africa imported a total of 94 tons of beef (fresh or chilled) at an average value of US$ 4 383/unit. The major origin for beef (fresh or chilled) imported by South Africa during 2009 was Namibia which commanded 39.3% share of the total imports. 54% of frozen and chilled beef is imported from Area Nes (unidentified countries). South Africa s beef (fresh or chilled) imports decreased by 38% in value and 47% in quantity between the periods 2005 and 2009 and increased by 153% between the periods 2008 and 2009 in value. 51
52 52
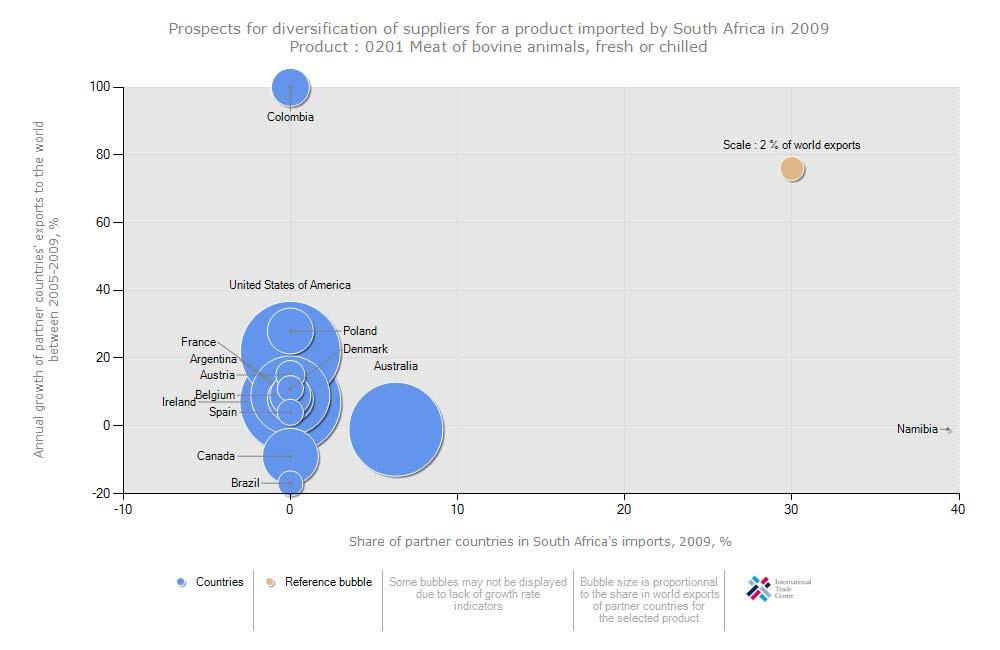
53 The figure above shows the prospects for diversification of suppliers for fresh or chilled beef imports by South Africa in The analysis shows that Namibia commanded the greatest market share of South Africa s fresh or chilled beef imports followed by Australia during the year If South Africa is to diversify its imports, the most attractive supplier exists in Colombia due to its export growth of 136%. This means South Africa can develop a market in this country because currently South Africa does not export fresh or chilled beef from it. 53
54 Table 20: List of supplying markets for the beef (frozen); imported by South Africa in South Africa's imports represent 0.13% of world imports for beef (frozen); its ranking in world imports is 56. Exporters Imported value 2009 (USD thousand) Trade balance 2009 (USD thousand) Share in South Africa's imports (%) Imported quantity 2009 Quantity unit Unit value (USD/unit) Trade Indicators Imported growth in value between (%, p.a.) Imported growth in quantity between (%, p.a.) Imported growth in value between (%, p.a.) Ranking of partner countries in world exports Share of partner countries in world exports (%) Total export growth in value of partner countries between (%, p.a.) 'World Tons 'Uruguay Tons 'Argentina Tons 'Australia Tons 'Paraguay Tons 'Area Nes Tons 6967 'New Zealand Tons 'Namibia Tons 'Antigua and Barbuda Tons 81 0 'Brazil Tons 'United Kingdom Tons 'Netherlands Tons 'India 'United States of America 'Angola 581 'Burundi 3 'Comoros 1 'Congo 55 'Democratic Republic of the Congo 559 Source: ITC calculations based on COMTRADE statistics. 54
55 Table 18 shows that during 2009 South Africa imported a total of tons of frozen beef at an average value of US$ 1 663/unit. The major origins for frozen beef imported by South Africa during 2009 were Uruguay, Argentina, Australia and Paraguay. The greatest share of South African frozen beef imports were from Uruguay which commanded 41.6% during the year 2009 followed by Argentina commanded 28.1% and together they constitute 67.7% of South African frozen beef imports. South Africa s frozen beef imports decreased by 19% in value and 21% in quantity between the periods 2005 and During the same period, imports of frozen beef from Uruguay increased by 17% in value and 13% in quantity; while imports from Argentina decreased by 15% in value and 21% in quantity. Between 2008 and 2009, South Africa s imports for frozen beef increased by 17% in value. This means total frozen beef imported by South Africa in 2009 was valued at US$ Frozen beef imported from Uruguay increased by 14% while those from Argentina increased by 53% in value during the period 2008 and Paraguay experienced the highest frozen beef import growth of 138% during 2008 and
56 56