IOPEPC Kharif-2017 Survey of Groundnut Crop
|
|
|
- Beverly Haynes
- 5 years ago
- Views:
Transcription

 78-79, Bajaj Bhawan, Nariman Point, Mumbai 400")
1 IOPEPC Kharif-2017 Survey of Groundnut Crop Indian Oilseeds and Produce Export Promotion Council (Under Ministry of Commerce, Govt. of India) 78-79, Bajaj Bhawan, Nariman Point, Mumbai
2 IOPEPC Kharif-2017 Survey of Groundnut Crop INTRODUCTION Groundnut (Arachis hypogaea L.) is an important oilseed and supplementary food crop of the world. It is fourth most important source of edible oil and third most important source of vegetable protein. It is commercially grown between 40 N and 40 S latitude. Globally, the crop is raised on 26.4 million hectares with a total production of 37.1 million MT. The average productivity is 1400 kg/ha. The annual global export of groundnuts is of two million MT valued at 2,600 million US $. Globally, with annual all-season coverage of about 70 lakh hectares India ranks first in acreage and with an output of about 85 lakh MT of in shell groundnuts, second in production. India also happens to be one of the largest exporters in the world and competes closely with Argentina, USA and China by commanding a share of 20-25% in global markets. For estimating production from kharif-2017 groundnut crop, an extensive survey was organized by IOPEPC in five major groundnut growing states of India during the peak harvesting period. NECESSITY FOR IOPEPC TO ORGANIZE CROP SURVEY The arrival of kharif groundnut produce begins in the last week of October. As production varies considerably over the years it significantly impacts the prices. Hence the prices in the Indian markets are determined by demand and supply situation. The export trade needs a reliable forecast of production every year coinciding with the commencement of harvesting operations i.e. in the last week of October. In addition to production figures, the trade also needs information on the quality of the produce which is often adversely affected by the vagaries of weather prevailing during the field, the harvest and the post-harvest stages of the crop. The Second Advance Estimates, the earliest realistic government estimates, are announced in January/February, i.e. about three-four months after the harvest of kharif crops. Therefore, with a view to 2
3 fulfilling this crucial need of the stakeholders for getting the production figures in the month of October-November, the IOPEPC has been organizing survey of groundnut crop in major growing states every year. The estimates based on kharif-2017 groundnut survey were released in the month of November The methodology adopted for conducting the survey and the results obtained are described here. METHODOLOGY Selection of states and districts for inclusion in survey: For selecting states, the states were first arranged in their decreasing order of acreages and then only as many states as would jointly account for at least 80% of the national acreage were identified for inclusion in the survey. Similarly, within a state, the districts were first arranged in decreasing order of their acreages. Then, depending on the proximity of the districts with the headquarters of the state agriculture university concerned, as many districts as would jointly account for at least 80% of the state acreage were selected. State Survey Coordinators and Survey Teams: In each state, one of the agricultural universities was opted as the collaborating partner. Names of the states and the respective agricultural universities are given in table 1. Table 1. States and partner agricultural universities State Partner agricultural university Gujarat Junagadh Agricultural University, Junagadh Andhra Pradesh Acharya N.G.Ranga Agricultural University, Guntur Karnataka University of Agricultural Sciences, Dharwad Maharashtra Mahatma Phule Krishi Vidyapeeth, Rahuri Rajasthan Swami Keshwanand Rajasthan Agricultural University, Bikaner A senior faculty member, nominated by the vice chancellor of the university concerned, was designated as the State Survey Coordinator. Names of the nominated state survey coordinators are given in appendix I. The activity was conducted by survey teams using a pre-designed questionnaire and by interacting with the farmers in their villages at their fields. Each survey team comprised a Team Leader and two or three Team- Members. The team leadership was assigned to a faculty member or senior 3
4 technical personnel of the university and memberships to the UG/PG students. The number of teams constituted for a state was determined on the basis of acreage of the state and also the availability of human resource with the state agriculture university concerned. Rainfall data and maps: Month-wise (June, July, August, September and October) and season-wise (June to September) cumulative data and maps on normal and actual rainfall along with its departure from the normal rainfall were downloaded from the website of India Meteorology Department, Govt. of India. The data pertained to meteorological sub divisions of various states and union territories of India. State-wise weekly progress of sowing and district-wise acreage: The data on state-wise weekly progress of sowing was downloaded from the website of the Department of Agriculture Cooperation and Farmers Welfare, Govt. of India. District-wise acreage: Information on district wise acreage within a state was obtained either from the website of the state government or through correspondence with state department of agriculture concerned. Scheduling of survey: The survey was planned in such a way so as to have maximum number of farmers interviewed in their respective fields during the peak harvesting period (October-November). Number of farmers to be interviewed: In each state, all the efforts were made to interview as many farmers as would be equal to 0.1% of the figures for the acreage of that state. E.g. in a state with a crop acreage of 2,21,000 ha the minimum number of farmers required to be interviewed would be 221. A pre-set questionnaire was used for interviewing farmers at their farms/villages. Estimation of average yield of the districts and the states: The mathematical average of the expected/realized yields as reported by the farmers in a district was considered to be average yield of that district. 4


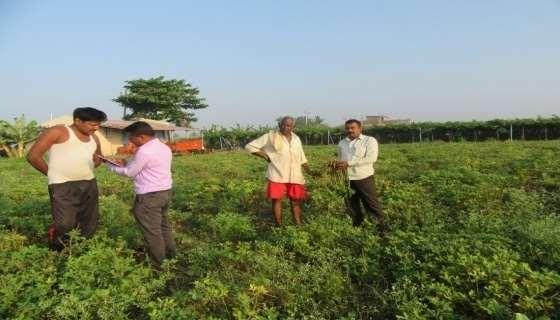
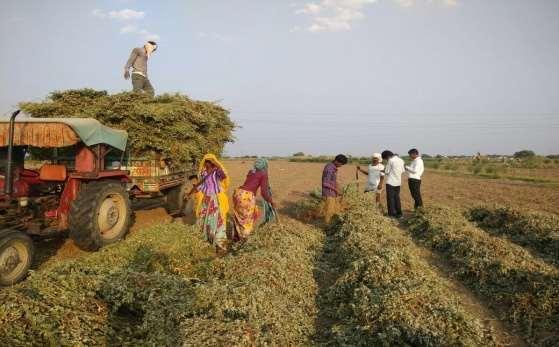
5 Andhra Pradesh Gujarat Karnataka Maharashtra Rajasthan Interaction with groundnut farmers 5
6 For each district, the anticipated production was calculated by multiplying the figures for acreage of that district (given by the state govt. concerned) with the figures for its average yield. The anticipated production from non-surveyed districts (often referred to as others ) was calculated by multiplying the figures of the collective acreage of non-surveyed districts with the figures of weighted average yield of the surveyed districts in that state. The total anticipated production in the state was calculated by summing up the figures for anticipated production in the surveyed and non-surveyed (others) districts. Estimation of average yield of non surveyed states: The average yield of the non-surveyed states was assumed to be equal to that of the weighted average yield of the surveyed states. The all India production was accordingly calculated by summing up the anticipated production of the surveyed states and the non-surveyed states. RESULTS Kharif 2017: State wise net acreage In kharif-2017, the all-india acreage was 41,52,500 hectares. Eight states viz., Gujarat, Andhra Pradesh, Rajasthan, Karnataka, Madhya Pradesh, Maharashtra and Tamil Nadu and Uttar Pradesh were identified to have acreages greater than one lakh hectares and these states jointly accounted for 95.5% of the national acreage. The crop acreages of various Indian states are given in table 2. Only five states viz., Andhra Pradesh, Gujarat, Karnataka, Rajasthan and Maharashtra which jointly accounted for 34,74,100 hectares i.e. 83.7% of the national acreage (41,52,500 ha) were selected as the target states for survey. Due to some practical considerations Maharashtra (at sixth rank) was opted in place of Madhya Pradesh (at fifth rank). 6
7 Table 2. Kharif-2017 groundnut acreage in various states of India State Acreage (ha) State Acreage (ha) 1. Gujarat Haryana Andhra Pradesh West Bengal Rajasthan Bihar Karnataka Punjab Madhya Pradesh Uttarakahnd Maharashtra Others Tamil Nadu Arunachal Pradesh Uttar Pradesh Jammu & Kashmir Odisha Assam Chattisgarh Himachal Pradesh Jharkhand Kerala Telangana All India As on ; Source DES, GOI Weekly progress of crop coverage An analysis of data revealed that across the target states, the sowing operations began in the week ending 14 June and concluded up to the week ending 20 September. In Rajasthan, peak period of sowing was 15 June to 29 June, which accounted for 56% of the state acreage. In both Gujarat and Maharashtra, the peak sowing period was 29 June to 13 July during which 57% and 42% of the state acreage, respectively, was covered. Although in Andhra Pradesh and Karnataka, there was not any distinct peak period of sowing yet in Karnataka, 50% of the state acreage was sown between 13 July and 9 August. In Andhra Pradesh, the sowing operations were highly staggered and nearly evenly distributed between 22 June and 6 September. The weekly progress of sowing in the five states surveyed is graphically depicted in Figure 1. 7
8 14-Jun 22-Jun 29-Jun 6-Jul 13-Jul 20-Jul 27-Jul 1-Aug 9-Aug 16-Aug 23-Aug 30-Aug 6-Sep 13-Sep 20-Sep 10% 8% 9% 2% 1% 1% 3% 9% 8% Peak sowing period Highly staggered 10% 5% 3% 13% 8% 10% 55 AP-Groundnut 14-Jun 22-Jun 29-Jun 6-Jul 13-Jul 20-Jul 27-Jul 1-Aug 9-Aug 16-Aug 23-Aug 13% 33% 0% 0% 0% 1% 6% 3% 13% Peak sowing period 29 Jun 13 Jul 7% 24% 60 Gujarat-Groundnut 14-Jun 22-Jun 29-Jun 6-Jul 13-Jul 20-Jul 27-Jul 1-Aug 9-Aug 16-Aug 23-Aug 30-Aug 6-Sep 5% 3% 6% 10% 11% Peak sowing period Staggered 3% 7% 5% 8% 6% 7% 15% 14% 65 Karnataka-Groundnut 14-Jun 22-Jun 29-Jun 6-Jul 13-Jul 20-Jul 27-Jul 1-Aug 9-Aug 16-Aug 23-Aug 30-Aug 6-Sep 13-Sep 20-Sep 4% 18% 1% 1% 1% 1% 2% 0% 9% 11% 8% 0% 2% 23% Peak sowing period 29 Jun 13 Jul 19% 71 Maharashtra-Groundnut 22-Jun 29-Jun 6-Jul 13-Jul 20-Jul 27-Jul 1-Aug 9-Aug 16-Aug 23-Aug 30-Aug 6-Sep 13-Sep 0% 0% 0% 0% 0% 0% 5% 4% 7% 9% 19% 22% 34% Peak sowing period 15 Jun 29 Jun 77 Rajasthan-Groundnut Figure 1. Weekly progress of sowing (dates indicate week-endings) 8
9 Change in acreage of major growing states with respect to kharif-2016: Considerable changes were observed in the extent of crop coverage at state as well as national level. At national level, with respect to kharif-2016, a decrease by 11.8% was observed in kharif Among the five states selected for survey, the maximum decrease was observed in Karnataka (28.9%) and almost to the same extent in Andhra Pradesh (28.5%). In Gujarat and Maharashtra the change in area was only nominal and numerically nearly equal but with opposite signs i.e. 1.1% and +1.2%, respectively. A decrease in acreage by 4.2% was observed in Rajasthan. In Kahrif 2017, Gujarat alone accounted for 39.1% of the national acreage- a lion s share, and was distantly followed by Andhra Pradesh and Rajasthan with their respective shares of 16.0% and 14.2%. The acreages of Karnataka and Maharashtra accounted for only 9.1% and 5.1% respectively. The total national kharif-2017 acreage was 41,52,500 hectares. Five states viz., Andhra Pradesh, Gujarat, Karnataka, Maharashtra and Rajasthan jointly accounted for 34,74,100 hectares, i.e. 83.7% of the national acreage. The kharif 2017 crop acreages of these five states, their shares in the national acreage and change in acreage with respect to kharif 2016 are given in table 3. Table 3. Kharif-2017 vis-à-vis kharif-2016 acreage in major growing states Kharif 2016 Kharif 2017 State Acreage (ha) Share (%) Acreage (ha) Share (%) over 2016 (%) Andhra Pradesh Gujarat Karnataka Maharashtra Rajasthan Sub-total Others All India Source of data on acreage: Directorate of Economics and Statistics, Govt. of India 9
10 Districts identified for survey: On the basis of district-wise acreage in the target states vis-à-vis proximity of the districts with the head quarters of the State Survey Coordinators and also the availability of human resource for the purpose, an appropriate number of districts were identified for each state for survey. Four districts viz., Anantapuram, Chittoor, Kurnool and YSR Kadapa were selected in Andhra Pradesh. In Gujarat nine districts viz., Rajkot, Junagadh, Dawarka, Amreli, Jamnagar, Banaskantha, Gir Somnath, Bhavanagar and Kutch were identified. As many as 11 districts viz., Chitradurga, Bellary, Tumkur, Belgaum, Vijayapura, Gadag, Koppal, Haveri, Chikkaballapura, Dharwad and Davanagere were selected in Karnataka and in Maharashtra seven districts viz., Kolhapur, Satara, Sangli, Nashik, Pune, Dhule and Ahmednagar were selected. In Rajasthan nine districts viz., Bikaner, Jodhpur, Churu, Jaipur, Hanumangarh, Sikar, Dausa, Nagaur and Tonk were identified. Of the total groundnut acreages of the states, the aforementioned districts collectively comprised 97.0% in Andhra Pradesh, 81.9% in Gujarat, 93% in Karnataka, 76.9% in Maharashtra and 84% in Rajasthan. The state wise information on the number of districts covered, teams engaged and the farmers interviewed along with the peak period of sowing and timings of survey is summarized in table 4. Table 4. Number of districts covered, teams engaged and farmers interviewed State Districts covered Teams Farmers consulted 10 Peak period of sowing Period of survey (no.) (no.) (no.) From To From To Andhra Pradesh Highly staggered 25 Oct 30 Oct Gujarat Jun 13 Jul 01 Oct 09 Oct Karnataka Staggered 30 Sep 30 Oct Maharashtra Jun 13 Jul 27 Oct 04 Nov Rajasthan Jun 29 Jun 09 Oct 30 Oct Total The districts covered by survey are indicated in the district boundary maps of the state concerned (figure 2a to 2e).

11 A perusal of these maps indicates that the identified districts were located in Rayalaseema of Andhra Pradesh, Suarashtra and Kutch region of Gujarat, Madhya Maharashtra in Maharashtra, distributed nearly evenly in North Interior and South Interior Karnataka, and distributed across West and East Rajasthan meteorological subdivisions of India. Figure 2a. Districts (colour shaded) surveyed in Andhra Pradesh Figure 2b. Districts (colour shaded) surveyed in Gujarat 11
")

12 Figure 2c. Districts (colour shaded) surveyed in Karnataka Figure 2d. Districts (colour shaded) surveyed in Maharashtra 12

13 Figure 2e. Districts (colour shaded) surveyed in Rajasthan ESTIMATES OF PRODUCTION The figures for state wise and all India production were estimated according to the procedure outlined earlier. The share of the estimated production of each district in the total estimated production of the respective state is described below. Andhra Pradesh All the four districts covered under survey are in Rayalaseema region and jointly accounted for 97% of the state acreage implying that groundnut is grown only for name sake in Coastal Andhra Pradesh. The highest yield (1,703 kg/ha) was estimated for Kurnool district and the lowest (1,121 kg/ha) for Anantapur. The highest and half of the estimated state production (53.9%) could be attributed to Anantapur district, which also accounted for the largest acreage (61.1%). The total production of in shell groundnut in Andhra Pradesh was estimated at 8,35,084 MT with an average yield of 1,272 kg/ha (table 5). 13
14 Table 5. Production of groundnut (in shell) in Andhra Pradesh Acreage Share Farmers Yield Production Share Districts (ha) (%) (no.) (kg/ha) (MT) (%) 1. Anantapur Chittoor Kurnool YSR Kadapa Sub-total Others State total Gujarat In Gujarat, among the nine districts surveyed, the highest yield (2,377 kg/ha) was estimated for Jamnagar and the lowest (1,374 kg/ha) for Amreli. The highest production (18.1%) was estimated for Rajkot which accounted for the largest acreage too. The total production of in shell groundnut in Gujarat was estimated at 30,54,671 MT with an average yield of 1,879 kg/ha (table 6). Table 6. Production of groundnut (in shell) in Gujarat Districts Acreage (ha) Share (%) 14 Farmers (no.) Yield (kg/ha) Production (MT) Share (%) 1. Rajkot Junagadh Dawarka Amreli Jamnagar Banaskantha Gir Somnath Bhavanagar Kutch Sub total Others State total Karnataka In Karnataka, the highest yield of 1,894 kg/ha was estimated for Haveri and the lowest of 500 kg/ha for Chikkaballapura. Among the 11 districts surveyed, the
15 highest production of 51,385 MT was estimated for Chitradurga the district having the largest acreage in the state but the estimated yield was quite low (561 kg/ha). Table 7. Production of groundnut (in-shell) in Karnataka Districts Acreage Share Farmers Yield Production Share (ha) (%) (no.) (kg/ha) (MT) (%) 1. Chitradurga Bellary Tumkur Belgaum Vijayapura Gadag Koppal Haveri Chikkaballapura Dharwad Davanagere Sub-total Others State total The total production of in shell groundnut in Karnataka was estimated at 3,30,463 MT with an average yield of 874 kg/ha (table 7). Maharashtra In all, seven districts were surveyed in Maharashtra. The highest yield (2,885 kg/ha) was estimated for Pune and the lowest (900 kg/ha) for Kolhapur a district which ironically accounted for the largest share (21.3%) in the state acreage. The maximum production (53,926 MT) was estimated for Sangli with a yield of 2,000 kg/ha. The total estimated production of in shell groundnut in Maharashtra was estimated at 2,95,404 MT with an average yield of 1,382 kg/ha (Table 8). Rajasthan In Rajasthan, the highest yield (2,862 kg/ha) was estimated for Sikar and the lowest (869 kg/ha) for Dausa. The highest production was estimated for Bikaner, the district with the largest acreage (35.4%) in the state. Bikaner alone, accounted 15
16 for two-fifths (39.4%) of the estimated production of Rajasthan. The production of in shell groundnut in Rajasthan was estimated at 14,05,781 MT with an average yield of 2,380 kg/ha (Table 9). Table 8. Production of groundnut (in shell) in Maharashtra Districts Acreage (ha) Share (%) Farmers (no.) Yield (kg/ha) Production (MT) Share (%) 1. Kolhapur Satara Sangli Nashik Pune Dhule Ahmednagar Sub total Others State total Table 9. Production of groundnut (in shell) in Rajasthan Districts Acreage (ha) Share (%) Farmers (no.) Yield (kg/ha) Production (MT) Share (%) 1. Bikaner Jodhpur Churu Jaipur H garh Sikar Dausa Nagaur Tonk Sub total Others State total
17 All-India production The all India production was estimated at 70,77,397 MT with an average yield of 1,704 kg/ha (table 10). The five states covered by survey collectively contributed 83.7% of the national production. All figures pertain to production of in-shell groundnut. Table 10. State wise and all-india production of kahrif-2017 groundnut (in shell) State Acreage* (ha) Share (%) Farmers (no.) Yield (kg/ha) Production (MT) Share (%) 1. Andhra Pradesh Gujarat Karnataka Maharashtra Rajasthan Sub-total Others All India As on 21 st September 2017; Source: Directorate of Oilseeds Development, Hyderabad With an estimated production of 30,54,671 MT, Gujarat accounted for twofifths (43.2%) of the national production. Gujarat was followed by Rajasthan (14,05,781 MT) with a share of 19.9%, Andhra Pradesh (8,35,084 MT) with 11.8%, Karnataka (3,30,463 MT) with 4.7% and Maharashtra (2,95,404 MT) with 4.2%. The highest state average yield of 2,380 kg/ha was estimated for Rajasthan which was followed by 1,879 kg/ha for Gujarat, 1,382 kg/ha for Maharashtra, 1,272 kg/ha for Andhra Pradesh and the lowest of 874 kg/ha for Karnataka. Concurrence between estimated yields and seasonal rainfall pattern: The groundnut crop requires about 700 mm rainfall and an optimum temperature range of C. The crop is susceptible to several diseases and insect pests. Exposure to protracted drought adversely affects the crop yield. End-of-the-season drought severely affects pod filling and lowers yield as well as quality. Adequate care is required while harvesting the crop and post-harvest curing of the produce to conserve the organoleptic quality and safeguard the produce from infestation of aflatoxin 17
18 producing fungi and storage pests. Excessive rain enhances the susceptibility to fungal diseases besides causing erosion in quality. The yield of groundnut crop in the preceding five years ( to ) and its average (often referred to as normal yield) and the yield estimated for through the survey are given in the table 11. Table 11. Normal yield (kg/ha) of kharif groundnut in states surveyed State GOI estimates for kharif groundnut Normal Survey (five-year average) Andhra Pradesh Gujarat Karnataka Maharashtra Rajasthan All India Source: DES, GOI; Final estimates for to and fourth advance estimate for The data on cumulative rainfall in various meteorological sub-divisions of India during 2017 monsoon season (1 June 27 September) along with its departure from the normal and the post-september rains (1 October 1 November) are given in table 12. Table 12. Actual and normal rainfall in the target states From to From to Meteorological Actual Normal Departure Actual Normal Departure sub divisions (mm) (mm) (%) (mm) (mm) (%) West Rajasthan East Rajasthan Gujarat region Saurashtra and Kutch Madhya Maharashtra Rayalaseema N.I. Karnataka S.I. Karnataka Source: India Meteorological Department, Govt. of India 18
19 The all India real time data maps for the months of June, July, August and September, cumulative south west monsoon rainfall from June to September, and rainfall in October are given as appendices II to VII. On the basis of rainfall data maps for June, July, August, September and October 2017, the following interpretations have been made for the areas of groundnut crop in the five states covered under survey. June: Both East and West Gujarat received normal rains while Rayalaseema, North Interior Karnataka, Madhya Maharashtra and both West and East Rajasthan received excess rains. It was only South Interior Karnataka that received deficient rains. July: Madhya Maharashtra received normal rains. In entire Gujarat and entire Rajasthan there were excess rains while in Rayalaseema and both North and South Interior Karnataka there were deficient rains. August: Entire Karnataka and Madhya Maharashtra received normal rains. The Rayalaseema region and West Gujarat received excess rains while the rains were deficient in East Gujarat and entire Rajasthan September: Rayalaseema, entire Karnataka and Madhya Maharashtra received excess rains. The rains were deficient in entire Gujarat and entire Rajasthan. October: Entire Rajasthan was completely dry (no rains). In West Gujarat there was a large deficiency while in east Gujarat there was deficiency. In Madhya Maharashtra and both South Interior Karnataka and North Interior Karnataka there were excessive rains while in Rayalaseema there was a large-excess of rains. The graphic representation of rainfall pattern in the target areas of the surveyed states is given in figure 3. 19
20 Month Rayalseema (AP) West Gujarat East Gujarat NI Karnataka SI Karnataka Madhya Maharashtra West Rajasthan East Rajasthan June July August September October Large excess (60% or more) Excess (20% to 59%) Normal ( 19% to + 19%) Deficient ( 20% to 59%) Large deficient ( 60% to 99%) No rain Figure 3. Departure from the normal monthly rainfall in meteorological subdivisions of the states covered by survey In the following discussion attempts at validating the estimated yields on the basis of rainfall pattern of kharif 2017 season in the meteorological subdivisions of the targeted states. A cluster of four districts in Rayalasema region accounts for entire (97%) groundnut acreage of in Andhra Pradesh. It is a low bimodal rainfall area with normal south west monsoon rainfall of 383 mm from June to September and subsequently 133 mm in October from the north east monsoon. Compared to Gujarat, Rajasthan, and Maharashtra, the sowing season of groundnut in Rayalaseema is generally staggered and in Kharif-2017 it stretched for nearly two and a half months (June to mid August). In the first four months (June to September) a total of 482 mm rainfall was received and in October another 225 mm was received. Thus there was a total of 707 mm rainfall against the normal rainfall of 515 mm. Hence the yield of the crop in Andhra Pradesh was unusually high. In Gujarat, groundnut cultivation is most extensive in west Gujarat (Saurashtra and Kutch meteorological region). The normal June to September rainfall for this region is 473 mm and just 19 mm in October. In Kharif-2017, this region received 20
21 646 mm June to September rainfall and only 5 mm in October. Thus in this season a good rainfall in June and July helped in timely sowing of crop with a peak period during 29 June ad 13 July and this coverage coupled with excess rains in August (with its residual affect partly compensating for the deficient rains in September) resulted in realization of a good yield in Gujarat. The total quantum of south west monsoon rainfall in North Interior Karnataka (481.8 mm) and South Interior Karnataka (626.1 mm) has been near normal (487.8 mm and mm, respectively) but its distribution across the months showed considerable departures. In South Interior Karnataka, rains were deficient in June and July while in North Interior Karnataka rains were deficient only in July. In both the sub-divisions rainfall was normal in August and excess in September and also in October. Quite like Andhra Pradesh, the sowing period in Karnataka was also protracted and given the scenario of sufficient post July rains, the late sown crop appears to have performed well, evidenced by its yield estimation. Hence in spite of initial adverse effects of deficient rains early in the season, the overall realization of yield was rather satisfactory. Realization of very high yield in Haveri districts can be attributed to Integrated Micro- Irrigation Scheme which facilitates farmers to use water through sprinklers. Both West and East Rajasthan had identical rainfall pattern i.e. excess rains in June and July, deficient rains of August and September, and no rains in October. In Rajasthan, groundnut cultivation is characterized by early sowing, use of longduration varieties and widespread adoption of sprinkler irrigation. In keeping with this characterization, 22% of the total acreage was accomplished by the week ending 22 June, 56% by the week ending 29 June and 75% by the week ending 6 July and during this period there were sufficient rains. Subsequently, availability of irrigation water in the command area of Indira Gandhi Canal and also recharging of ground water (due to good rains in June and July) facilitated availability of water for sprinkler irrigation resulting in realization of quite high yield as usual for Rajasthan. Although there are a host of soil and environmental yield determining factors in rain-fed areas, the pattern and extent of rainfall assumes a crucial position for realizing good yields. Among the five states surveyed, the reasons for realization of 21
22 unusually high yields in Andhra Pradesh; moderate yields in Karnataka and Maharashtra have already been explained in terms of June to September and post- September rainfall patterns of these states. Rajasthan is the only state where a large number of farmers have access to irrigation water to compensate for the deficient rains and thus protect their crop from any short or long spell of drought. In Gujarat too depending on availability of ground water some farmers are able to protect their crops from short spells of drought. A good rainfall in June and July facilitated timely sowing and also recharges the ground water which later becomes available to farmers for providing protective irrigations during the dry spells that prevail due to deficient or absence of rains for weeks together. Use of micro irrigations systems is fast becoming popular in Gujarat too. This explains realization of good yields in Rajasthan and Gujarat even with moderate rains. General comments: The kharif-2017 appears to a very good year for groundnut crop in India. In major groundnut areas other than Rajasthan the June to October rainfall either approached close to or surpassed 700 mm. For Rajasthan widespread use of sprinkler irrigations coupled with use of long duration varieties has been giving vey high yields for the several past years. In the southern states (Andhra Pradesh and Karnataka), the post September rainfall rescued the crop well from the initial periods of deficient rains. Thus, kharif 2017 may turn out to be a year of record groundnut productivity as well as production (in spite of reduction in acreage). ACKNOWLEDGEMENT: The IOPEPC is thankful to the Vice Chancellors and other authorities of the five agricultural universities for allowing their faculty members, technical officers and students to function as State Survey Coordinator, Team Leaders and Team members and conduct the crop survey. Report compiled by: Dr. JB Misra, Technical Advisor, IOPEPC Mr. Gaurav S. Gawande, Sr. Manager, IOPEPC 22
23 Disclaimer The projections made in this report about the yield and production of kharif-2017 groundnut crop have been made on the basis a limited survey conducted by adopting the methodology outlined in the beginning of this report. Due to inherent complexities associated with preparing the production estimates and also the limited resources and sample-size, the figures projected in this book may or may not be in harmony with the figures projected by other private or public agencies. The IOPEPC shall not be responsible for any gains or loss incurred by any individual or institution on account of using the figures given in this report. The IOPEPC therefore advises the readers to use discretion before taking any commercial or policy decision on the basis of projections made in this report. 23
24 Appendix I Particulars of the designated State Survey Coordinators Name, designation and affiliation Contacts State assigned 1. Dr. K John, Principal Scientist (PB&G) Regional Agricultural Research Station, Tirupati johntuney@gmail.com Andhra Pradesh 2. Dr. H. Maheta Assistant Professor PG Institute of ABM Junagadh Agricultural University Junagadh Dr. H.L. Nadaf Principal Scientist, AICRP-Groundnut University of Agricultural Sciences Dharwad Dr. Basavraj S. Yenagi (Associate SSC) Agronomist, AICRP-Groundnut UAS, Dharwad Dr. S. Patil Principal Scientist Oiseeds Research Station Jalgaon Dr. M.M. Sharma Professor (PB&G) SK Rajasthan Agricultural University, Bikaner hiten.maheta@jau.in hlnadaf892@yahoo.com bsyenagi@yahoo.co.in yenagibs@uasd.in sudampatil59@gmail.com mmohanrau@yahoo.com Gujarat Karnataka Maharashtra Rajasthan 24
 Normal (-19% to + 19%) Deficient (-20% to")
25 Appendix II Source: India Meteorological Department Excess (>19%) Normal (-19% to + 19%) Deficient (-20% to -59%) 25
 Normal (-19% to + 19%) Deficient (-20% to")
26 Appendix III Source: India Meteorological Department Excess (>19%) Normal (-19% to + 19%) Deficient (-20% to -59%) 26
 Normal (-19% to + 19%) Deficient (-20% to")
27 Appendix IV Source: India Meteorological Department Excess (>19%) Normal (-19% to + 19%) Deficient (-20% to -59%) 27
28 Appendix V Source: India Meteorological Department Excess (>19%) Normal (-19% to + 19%) Deficient (-20% to -59%) 28
 Normal (-19% to + 19%) Deficient (-20% to")
29 Appendix VI Source: India Meteorological Department Excess (>19%) Normal (-19% to + 19%) Deficient (-20% to -59%) 29
 Normal (-19% to + 19%) Deficient (-20% to -59%) Large deficient (-99% to -60%) No rain 30")
30 Appendix VII Source: India Meteorological Department Large excess (60% or more) Excess (20% to 59%) Normal (-19% to + 19%) Deficient (-20% to -59%) Large deficient (-99% to -60%) No rain 30