Myanmar s Changing Rural Economy: Evidence from the Delta & Dry Zone
|
|
|
- Corey Lester
- 5 years ago
- Views:
Transcription
1 Myanmar s Changing Rural Economy: Evidence from the Delta & Dry Zone Ben Belton (Michigan State University) Food Security Policy Project LIFT Donor Retreat, Yangon October 2, 2017 The brief was supported with financial assistance from the Livelihoods and Food Security Trust Fund (LIFT), and is also made possible by the generous support of the American people through the United States Agency for International Development (USAID) under the Feed the Future initiative. The views expressed herein should in no way be taken to reflect the official opinion of any of the LIFT donors or the views of USAID or the United States Government
2 Introduction FSP Surveys Key findings from Delta and Dry Zone 1. Infrastructure 2. Migration & wages 3. Mechanization 4. Credit 5. Rural non-farm business & off-farm employment 6. Agricultural performance 7. Climate change Implications for policy & programming
3 Food Security Policy Project (FSP) USAID & LIFT funded partnership implemented by MSU, CESD, and IFPRI October Objectives: Generating and disseminating new knowledge to address evidence gaps and inform better agricultural policy Capacity building and strengthening for research and policy Components: Agricultural value chains and livelihoods research Policy advising Training and outreach
4 Surveys 2016: Myanmar Aquaculture-Agriculture Survey (MAAS) 2017: Rural Economy & Agriculture Dry Zone Survey (READZ) 3 survey components: Household; Community; Off-farm enterprise Household: Off-farm employment, migration, agricultural production, mechanization Community: Changes within last decade (infrastructure, business inventory, credit access etc.) Off-farm enterprise (machinery supply & rental, traders, processors)

5 MAAS locations
6
 Pwintbyu (Magway) Magway")
7 READZ locations Budalin (Sagaing) Myittha (Mandalay) Pwintbyu (Magway) Magway (Magway)
8

9 1. Improvements in infrastructure
10 Big improvements, from a low base Extent of infrastructure development regionally varied and generally quite limited Villages not accessible by car in monsoon: Delta 68%, Dry Zone 28% Villages with no electricity: Delta 88%; Dry Zone 66% But, big improvements post /3 of all electricity connections (Dry Zone) Half of all secondary school construction (Dry Zone)
11 Cumulative share of primary, lower secondary and upper secondary schools established, by year ( ) Primary Lower secondary Upper secondary

12 2. Accelerating migration, rising wages
13 Accelerating migration in Delta Urban Rural 90% rural-urban 92% domestic 16% of HH have migrants Average migrant age 21 55:45 male/female split 70% employed in manufacturing Cumulative share of all migrants by year first migrated (%), (MAAS)
14 and Dry Zone Domestic International 86% domestic 19% of HH have long term migrants Average migrant age 24 56:44 male/female split 26% employed in manufacturing 55% low-skilled informal jobs Cumulative share of all migrants by year first migrated (%), (READZ)
15 Migration is driving large rural wage increases Delta Dry Zone Real daily wages (MMK) % +8% % +20% Change in real daily wages for male casual workers (MAAS & READZ)

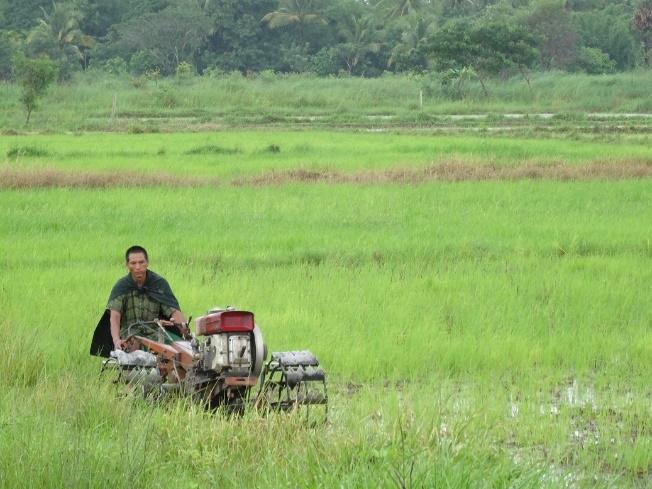
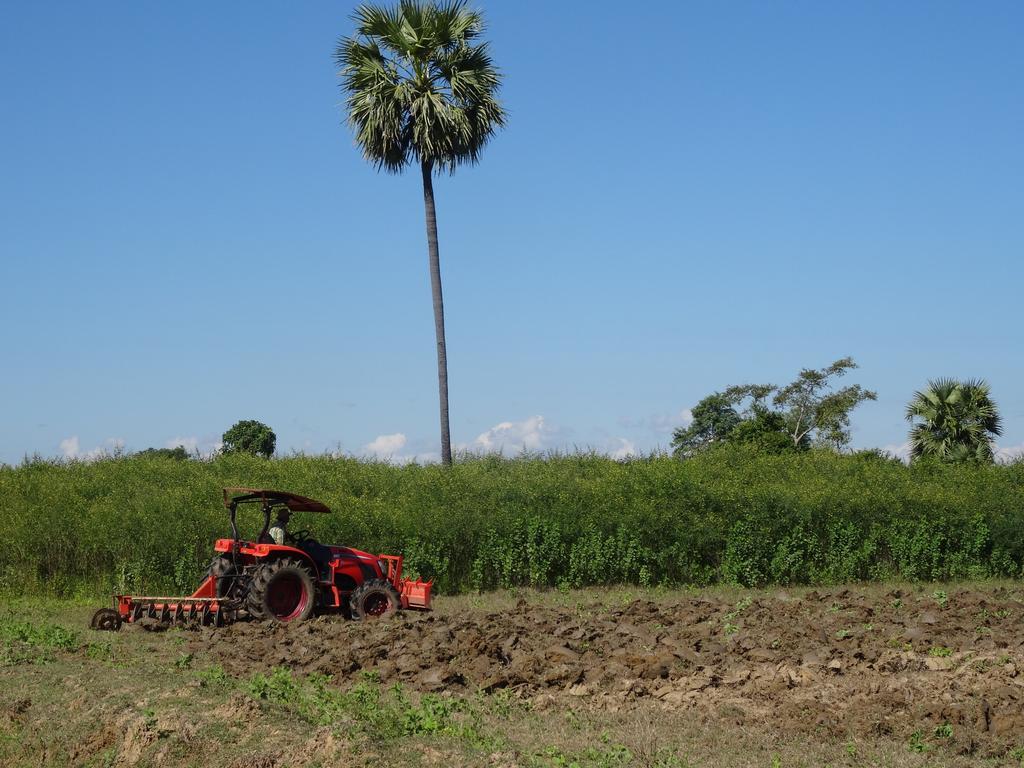
16 3. Agriculture mechanizing rapidly
17 Rental services enabling access to machines 60% +1839% 50% Own Rent Share of farm HHs 40% 30% 20% 10% +216% +1801% +170% 0% 10 years ago 5 years ago Today 10 years ago 5 years ago Today 10 years ago 5 years ago Today 10 years ago 5 years ago Today 2WT 4WT Combine Harvester Thresher Share of farmers using machinery, by machine type, year and ownership status (READZ)
18 Scale-neutral technology % of farm households using <5 acres >5 & <10 acres >10 acres WT (Land Preparation) 4WT (Land Preparation) Combine (Harvesting) Share of households using agricultural machinery, by size of landholding (MAAS)
19 Mechanization reduces labor costs Share of production costs 100% 80% 60% 40% 20% 4% 30% 31% 32% 15% 10% 26% 25% 21% 4% 24% 30% 10% 30% 15% 42% 40% Draft animal Transportation Irrigation Seeds Machinery Inputs Casual labor 0% Monsoon paddy Dry season paddy Green gram Black gram Composition of production costs, by crop (MAAS)

20 4. Access to formal credit is improving
21 Improving access to formal financial services for machine purchases Share of sales (%) Bank Dealer 48 2 Customer Hire purchase agreements with commercial banks began in 2013 Reduced capital constraints for machine suppliers, cost of credit to buyers 2WT 4WT Combine Harvester Source of finance for machinery purchases, 2016 (MAAS)
22 Sources of credit diversifying % of villages with access Share of villages with credit access by source, 2011 & 2016 (MAAS)
23 Most agricultural credit from formal sources, government is biggest loan provider 60 51% TOTAL LOAN VALUE ($ '000) % 10% 0 Total value of agricultural loans taken by sample farms in , by loan provider (READZ)
24 Credit becoming much cheaper as sources diversify Monthly interest rate (%) % 8-1.3% 6-1.7% -1.3% % -0.4% -5.2% 0 Monthly interest rates from informal lenders and microcredit providers, 2012 & 2017 (READZ)

25 5. Rural non-farm economy growing rapidly
26 Numbers of non-farm businesses growing quickly MEAN No. ENTERPRISES/VILLAGE % Motor transport Delta % Retail +44% Personal services +67% Food services % Motor transport Dry Zone +57% Retail % Personal services +56% Food services Mean numbers of non-farm enterprise per village by type, 2011 & 2016/17 (MAAS & READZ)
27 Gender wage gap smaller for non-farm work Men Women Salaried work Non-farm casual labor Farm casual labor Average daily incomes for men and women worker, by type of work, 2017 (READZ)
 Household participation in farm and off-farm employment by expenditure quintile")
28 Off-farm employment important for all Major role in livelihoods for most households, especially poorest, because of: High levels of landlessness (Delta = 58%, Dry Zone = 40%) Concentration of agricultural land (Bottom 1/3 of farms own 3-4% of farmland, top 1/3 own 70-80%) Household participation in farm and off-farm employment by expenditure quintile (MAAS)
29 BUT: Agriculture still the main source of primary employment Non-farm occupations 29% Own farm 42% Agriculture provides >70% of primary employment, plus indirect non-farm employment in value chains Agri-labor 29% Agricultural labor is 80% of off-farm employment in Dry Zone Share of individual primary employment, by type (MAAS)

30 6. Most agriculture performing poorly
31 Agricultural productivity remains low Gross margin/acre (USD) Gross Margin/acre (USD) Green gram Monsoon Paddy Median = $200/acre Median = $100/acre Median agricultural land = 5.5 acres; Typical annual agricultural income = $1650/HH, or $330/capita
32 Returns in the Dry Zone are even lower, especially for upland crops Mean gross margin/acre (USD) Dry season paddy Monsoon paddy Groundnut Sesame Green gram Mean gross margins (USD/acre) for selected crops (READZ)
33 Some adoption of improved seed, but progressing slowly 100% 90% 80% 70% 60% 50% 40% 30% 20% 10% 0% Improved Local 10 years ago 5 years ago years ago 5 years ago years ago 5 years ago years ago 5 years ago Rice Groundnut Sesame Green gram Share of households using improved & local seeds, by crop, (READZ)
34 Only rice yields are improving years ago 5 years ago Rice Groundnut Sesame Greengram Reported average yields for selected crops (baskets/acre) in 2016, 2011, 2007 (READZ)

35 7. Climate change contributing to poor agricultural performance
36 Increasing frequency & intensity of extreme weather 3% Communities reporting change (%) Nature of change (% of communities reporting) 4% 43% 38% 52% 48% Increased a lot Increased a little More erratic Decreased a little Decreased a lot 0 13% Rainfall Temperature Perceptions of change in the intensity or frequency of climate conditions and events over the past 30 years (READZ) Community perceptions of changes in average temperature and rainfall over the past 30 years (READZ)
37 Yields very strongly affected by climatic conditions 2500 Average crop yield (kg/acre) Good year Average year Bad year Average crop yields (kg/acre) in years with good, average and poor climatic conditions (READZ)
38 Implications for policy & programing Sustain investments in infrastructure, and complementary soft infrastructure well trained teachers, health professionals etc. Measures to support safer, less risky, higher quality migration. Overcome emerging spatial inequalities in mechanization (e.g. by improving road access, land levelling). Microcredit widely available but rarely invested in agriculture or non-farm business; Increase MADB payments for non-paddy crops RNFE complements farming but still provides relatively limited employment need options for promoting greater productivity & job growth. Land-poor HH heavily dependent on agricultural labor. Viable farm sector essential for rural incomes & employment. High value labor intensive crops (e.g. fish, melons); R&D to improve pulse, oilseed & paddy varieties and strategies to multiply and distribute. Strategies to mitigate impacts of climate extremes e.g. groundwater irrigation, water storage, stress tolerant varieties.