Supply Chain Management in Tomatoes in Maharashtra
|
|
|
- Aubrie Walton
- 5 years ago
- Views:
Transcription
1 Supply Chain Management in Tomatoes in Maharashtra Dr. Sangita Vishnu Warade Assistant Professor, School of Agri-Business Management, College of Agriculture, Nagpur-01, Maharashtra, India Abstract: The study on the supply chain management is selected with an objective to fine out the modern and traditional supply chains in the tomatoes and their way of the managing it. It is observed that the cost of cultivation is higher in cultivators registered to the modern chain than non-registered to modern chain. The procurement by the modern chain is highly efficient. The price paid by the consumer is lower and price received by the cultivator is higher in modern supply chain as compared to traditional supply chain. Keywords: Supply Chain Management, agricultural market. 1. INTRODUCTION The retail market of the agro-commodities in India is largely unorganized since past time. Now days the agricultural market is gaining organized form such as ITC retail outlet, Reliance Fresh etc, particularly in the metropolitan cities. As the agro-commodities are perishable in nature, those require high level of care to maintain its quality. The supply of such perishable commodities through market chain and functions requires higher efficiency. Very few studies are done on the Supply Chain Management in Tomatoes. From past studies, it is observed that the tomatoes are gaining importance in modern supply chain. Tomato is highly demanding fruit type vegetable. It has multipurpose use in food industry. It has various kinds of the processed product. This project is selected with an aim to identify and evaluate the traditional and modern supply chains for tomatoes. 2. METHODOLOGY The following samples and methods are taken for the present study. 2.1 Sample and Supply chains: The sample of the 90 cultivators is selected and divided it as fallows 1. A sample of 30 cultivators who are registered to modern supply chain(reliance Fresh, Nasik) 2. A sample of 30 cultivators who are not registered to modern supply chain but from the same area. 3. A sample of 30 cultivators who are not registered to modern supply chain but are not from the same area(most of the sample are from Vidarbha region) 2.3 Socio-economic status: The socio economic status is studied with family size, educational status, land use pattern, cropping pattern, fixed capital investment. 2.4 Cost of cultivation: The cost of the cultivation for all the three types of tomatoes cultivators is estimated as per the standard norms of Agricultural Prices Cell which includes Cost A, Cost B and Cost C concept. 2.5 Efficieny of the supply chain: The efficiency of the chain is estimated with quantity lost in the supply chains as follows Page 261
2 Chain Efficiency: (Total quantity procured in the chain Total quantity lost in the chain)/ Total quantity procured in the chain Higher the ratio, higher will be the efficiency. 3. GROWTH IN TOMATOES The tomato is one of the important vegetable crops. It has special nutritive value and widespread production over world. Tomato is said to be the native of tropical America. From tropical America it spread to other parts of the world in the 16th century and it became popular in India within the last six decades. It is the world's largest vegetable crop after potato and sweet potato. World produces around 117 million tons of tomatoes from an area of 43 lakh hectares (average of 2001 to 2005). Tomato is major crop in vegetable production. Area under tomato in the country is about 4.97 lakh hectares and it is about 7.3% of the total cropped land under vegetables. Annual production of tomato in India is 86 lakh tons which is 8.5% of the total vegetable production. There has been a gradual increase in the area under tomato while the production has been fluctuating due to weather related factors. Tomato in Maharashtra is cultivated in hectares with production at about 8 lakh tons. The top five districts viz., Nasik, Pune, Nagpur, Chandpur and Ahmednagar contributes for nearly 75% of state s production. Nasik stands with 35% contribution. Page 262
3 4. SOCIO-ECONOMIC STATUS OF THE TOMATO CULTIVATORS The socio-economic status of the cultivator indicates the ability of the cultivator to run the agricultural enterprise successfully. The parameters of socio-economics status like family size, educational status, land use pattern, cropping pattern, fixed capital investment are explained below. 4.1 Family size of the tomato cultivators: The family size of the tomato cultivators is given the table no.1. It indicate that the family size of the registered cultivators with modern outlet, non-registered with modern outlet and cultivators in non-modern outlet area is 5.81, 5.04 and 4.50 respectively. It observed that the number of female per family are less than the number male per family. The number of children per family are higher in case of the registered cultivators is higher i.e Table.1: Family Size of Tomato Cultivators Registered Cultivators at Modern outlet Non- Registered Cultivators at Modern outlet in same area Tomato Cultivators in nonmodern outlet area Sr. No Members Per family Percentage Per family Percentage Per family Percentage 1 Male Female Children Total Educational Status of the tomato cultivators: The educational status of the tomato growers is presented in table no.2. The results revealed that illiteracy percentage was observed in the non-registered cultivators and cultivators out of the modern area i.e. 10 and 6.67 respectively. Collegiate type of education was highest in the registered cultivators. It indicates the educated cultivators are more affiliated and interested in modern supply system in tomato. Table.2: Educational Status of the Tomato Cultivators (in percent) Registered Non- Registered Tomato Cultivators Cultivators at Cultivators at Modern in non-modern S. No Level of Education Modern outlet outlet in same area outlet area 1 Illiterate Primary School(1 to 4th std) School Level (5th to 7 th std) High School (8th to 12 std) Collegiate education Total Page 263
4 4.3 Land Use Pattern of Tomato Cultivators: The land use pattern presented in table.3 indicates the land holding of the registered cultivators and non-registered cultivators is less as compared tomato cultivators in non-modern outlet area. As the irrigated area is less in vidarbha side and the large cultivators have irrigation facility, on contrary the irrigation percentage in the Nasik area is higher are supported by Godavari Basin. S.No Particulars Table.3: Land Use Pattern of Tomato Cultivators (Area in hectares) Registered Cultivators at Modern outlet Per Percentage Farm share in GCA Non- Registered Cultivators at Modern outlet in same area Per Farm Percentage share in GCA Tomato Cultivators in non-modern outlet area Per Percentage Farm share in GCA 1 Total Land Holding Fallow Land Net operating Land Area sown more than once Gross Cropped Area(GCA) Irrigated Area Cropping Intensity The cropping intensity of the registered and non-registered cultivators is i.e and it is due to higher irrigation in the area, whereas the cropping intensity of the tomato cultivators in non-modern outlet area is The percentage of fallow land is higher in the in case of tomato cultivators in non-modern outlet area (vidarbha) 4.4 Cropping Pattern of Tomato cultivators: The cropping pattern of tomato cultivators is given table.5. The share of vegetables in cropping is specially mentioned here. The share of tomato in gross cropped area is 19.82, 9.06 and 6.56 in registered cultivators, non-registered cultivators and cultivators of the non-modern outlet respectively. In registered and non-registered cultivators the other major contributing crops are sugarcane i.e and respectively and grapes i.e and respectively. Table.4: Cropping Pattern of Tomato Cultivator Registered Cultivators at Non- Registered Cultivators at Tomato Cultivators in nonmodern outlet area Sr. Modern outlet Modern outlet in same area Crops No. Area per Percent share Area per Percent share Area per Percent share farm in GCA farm in GCA farm in GCA 1 Tomato Cabbage Cauliflower Dilleaves Brinjal Coriander Onion Garlic Methi Other vegetables Total Vegetables Cotton Grapes Sugarcane Pulses Cereals Oilseeds Other Crops Other than Vegetables Gross Cropped Area Page 264
5 4.5 Fixed Capital Assets of the tomato cultivators: The fixed capital assets of the tomato cultivators are given below in the table.5. The figures revealed that the assets of the registered and non-registered cultivators are having more valued assets i.e. Rs and Rs respectively than cultivators in non-modern outlet areas (Rs ). The percentage of building is higher in total value of assets ranges between to It is observed that the share of irrigation infrastructure was also on higher side ranges from to percent Sr. No. Particulars Table 5: Fixed Capital Assets of the tomato cultivators (Per farm) Registered Cultivators at Modern outlet Non-Registered Cultivators at Modern outlet in same area Tomato Cultivators in non-modern outlet area Value Percentage Value Percentage Value Percentage 1 Buildings Irrigation infrastructures Animals Machinery Implements Other unit Total ECONOMICS OF THE TOMATOES The economics of the tomatoes includes the cost of cultivation of the tomatoes by registered, non-registered and of nonmodern outlet area and their benefits and costs. 5.1 Cost of cultivation and economics of tomatoes of registered cultivators: The cost of cultivation of the tomatoes of registered cultivators to modern outlet is given the table.6. The total cost of cultivation of tomatoes was Rs The share of rental value in total cost was highest i.e percent. Amongst the direct expenses, the share of the human labourer in total cost was highest percent; it is followed by material cost of transplanting of tomato seedlings i.e percent. As the it follows all standardized practices of cultivation given by modern retail outlet centre, the requirement of labour and capital is more. Seed cost seems more of Rs 3250 for 13 gm. The share of cost-a in total cost was percent and share cost-b was percent. The per quintal cost was Rs and price received per quintal was Rs SR. NO. Table.6. Cost of cultivation of Tomato of Registered Cultivators at Modern retail outlet (Per Hectare) ITEM Unit Input Cost for Unit of Total Cost Per Ha. ( Rs.) Percent Share in Cost 'C' Input ( Rs.) Hired Human Labour Male Days Female Days Bullock Labour Pair Days Machine charges Hours Seed KGS Material for transplanting Manure QTLS Fertilizer KGS Micronutrient Biofertilizer Growth regulator Irrigation charges ( RS. ) Pesticide ( RS. ) Incidental charges ( RS. ) Repairing Charges ( RS. ) Working Capital Page 265
6 15 Interest on working Capital Land Revenue cess & Taxes ( RS. ) Depreciation COST "A" ( RS. ) Rental Value Of Land ( RS. ) Int. On Fixed Capital ( RS. ) COST "B" ( RS. ) Family Human Labour Male days Female days Cost " C " Yield per hectare ( RS. ) Value of un graded Produce Total Per quintal cost of cultivation Cost of cultivation of tomatoes of non-registered cultivators: The cost of cultivation of the tomatoes of non-registered cultivators to modern outlet is given the table.7. The total cost of cultivation of tomatoes was Rs The share of rental value in total cost was highest i.e percent. Amongst the direct expenses, the share of the human labourer in total cost was highest percent; it is followed by material cost of transplanting of tomato seedlings i.e percent. Seed cost seems more of Rs 3680 for 13 gm. The share of cost-a in total cost was percent and share cost-b was percent. The per quintal cost was Rs and price received per quintal was Rs SR. NO. Table.7. Cost of cultivation of Tomato of Non-Registered Cultivators at Modern retail outlet (Per Hectare) ITEM Unit Input/Ha. Cost for Unit of Total Cost Per Ha. ( Rs.) Percent Share in Cost 'C' Input ( Rs.) Hired Human Labour Male Days Female Days Bullock Labour ( Pair Days) Machine charges Hours Seed KGS Material for transplanting Manure QTLS Fertilizer KGS Micronutrient Biofertilizer Growth regulator Irrigation charges ( RS. ) Pesticide ( RS. ) Incidental charges ( RS. ) Repairing Charges ( RS. ) Working Capital Interest on working Capital Land Revenue cess & Taxes ( RS. ) Depreciation COST "A" ( RS. ) Rental Value Of Land ( RS. ) Int. On Fixed Capital ( RS. ) COST "B" ( RS. ) Family Human Labour Male days Female days Cost " C " Yield per hectare ( RS. ) Per quintal cost of cultivation Page 266
7 5.3 Cost of cultivation of tomatoes in non-modern outlet area: The cost of cultivation of the tomatoes of non-registered cultivators to modern outlet is given the table.8. The total cost of cultivation of tomatoes was Rs The share of rental value in total cost was highest i.e percent. Amongst the direct expenses, the share of the human labourer in total cost was highest percent; it is followed by machine charges and seeds 4.97 and 4.62 percent respectively. The share of cost-a in total cost was percent and share cost-b was percent. The per quintal cost was Rs and price received per quintal was Rs SR. NO. Table.8. Cost of Cultivation of Tomatoes s in Non-modern outlet area (Per Hectare) ITEM Unit Input Cost for Unit of Input ( Rs.) Total Cost Per Ha. ( Rs.) 1 Hired Human Labour Male Days Percent Share in Cost 'C' Female Days Bullock Labour Pair Days Machine charges Hours Seed KGS Manure QTLS Fertilizer KGS Micronutrient Biofertilizer Growth regulator Irrigation charges ( RS. ) Pesticide ( RS. ) Incidental charges ( RS. ) Repairing Charges ( RS. ) Working Capital Interest on working Capital Land Revenue cess & Taxes ( RS. ) Depreciation COST "A" ( RS. ) Rental Value Of Land ( RS. ) Int. On Fixed Capital ( RS. ) COST "B" ( RS. ) Family Human Labour Male ( days ) Female (days) Cost " C " Yield per hectare ( RS. ) Per quintal cost of cultivation Economics of tomato cultivation: The economics of tomatoes is given in table no 9. The result revealed that the Net return at cost-c was highest in case of registered cultivators to modern outlet. It was impact of the technical guidance and cropping pattern provided by the modern retail outlet centre. Even the return per rupee in case of the registered cultivators was high i.e. 1.77, whereas it was 1.44 in non-registered and 1.25 in not outlet area. Page 267
8 Table.9 : Economics of Tomato Cultivation Sr. No Particulars Yield Cost A Cost B Cost C Registered Cultivators at Modern outlet Non- Registered Cultivators at Modern outlet in same area Tomato Cultivators in non-modern outlet area Gross Return Net Return Cost A Net Return Cost C B:C ratio Economics of tomatoes Page 268
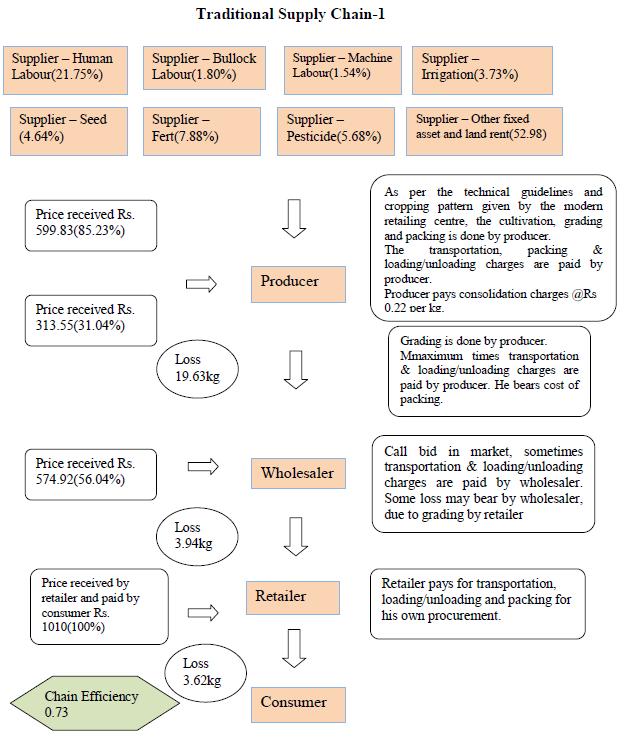
9 6. MARKETING COST OF TOMATOES The marketing cost of the tomatoes born by the cultivator is given in table.10. The results reveals that the marketing cost paid by non-registered cultivators was Rs and Rs in registered and non-registered cultivators respectively, whereas its Rs in non-modern outlet area. The share of packing was observed highest in registered cultivators (37.73 percent) as compared to other two cultivators. The share of commission was seen highest in the non-registered and non-modern outlet area cultivators. The consolidation charges are one part of modern outlet area, which are to be paid to modern outlet centre. It was percent of total marketing cost. S. No Particulars Table 10: Marketing Cost of tomatoes (Per hectare) Registered Cultivators at Modern outlet Non-Registered Cultivators at Modern outlet in same area Tomato Cultivators in non-modern outlet area Cost Percent Cost Percent Cost Percent 1 yield Packing Transportation Octroi Commission Hamali Consolidation charges Other Total Per Quintal PRICE SPREAD OF THE TOMATO OVER THE DIFFERENT SUPPLY CHAINS OF THE TOMATOES In case of modern chain, the tomatoes are pass from producer to consumer through modern chain, the charges of consolidation were paid to consolidation centre by cultivator at the rate Rs.22 per quintal and retailer of the modern outlet take it from processing centre(grading and standardization) of the modern centre at the rate of Rs.28 per quintal(processing charges) in addition to regular price. It was observed that the share of the producers price in consumer price was percent. The modern outlet has taken the net benefit of 3.66 percent. In traditional chains, where the retailers in the vegetable market and hawkers roaming in the colonies and residential area are observed. In these traditional chains, in some cases, the wholesaler procures tomatoes from the producers and in some cases producers themselves procures the tomatoes to the wholesaler in vegetable market. The wholesaler calls bids for tomatoes in the vegetable in the morning session. The two type of chain functionaries buys tomatoes from the wholesaler, those are retailer and hawkers. In the present study, the price spread of retailers hawkers and modern chain are given in the table no11, 12 and 13 respectively. In case of the retailers chain, it is observed that the share of producer in consumer price was percent and the share of the net return of the wholesaler was percent. The selling price of the producers Rs increased to Rs and to by retailer and by hawker respectively, when it reached to consumer. Table.11: Price Spread of the Tomato in Modern Supply Chain Price and Cost Per Pecent share in Sr. No Particulars Quintal Consumer price 1 Price received by producer Price paid by Modern outlet Cost incurred by Modern outlet Price received by Modern outlet Net return of Modern outlet Price paid by Consumer Page 269
10 Table.12: Price Spread of the Tomato Supply Chain with Retailer Price and Cost Per Percent share in Sr. No Particulars Quintal Consumer price 1 Price received by producer Price paid by Wholesaler Cost incurred by wholesaler Price received by wholesaler Net return of wholesaler Price paid by Retailer Cost incurred by Retailer Price received by Retailer Net return of Retailer Price paid by Consumer Table.13.: Price Spread of the Tomato Supply Chain with Hawker Price and Cost Pecent share in Sr. No Particulars Per Quintal Consumer price 1 Price received by producer Price paid by Wholesaler Cost incurred by wholesaler Price received by wholesaler Net return of wholesaler Price paid by Hawker Cost incurred by Hawker Price received by Hawker Net return of Hawker Price paid by Consumer EFFICIENCY IN TOMATOES PROCUREMENT The table.14 & 15 revealed the efficiency of the tomatoes procurement during the process of the procurement from producer to consumer. The different activities are followed during the procurement like packing, loading/unloading, transportation, grading and weighing. The results revealed that the procurement involves the kg tomatoes were lost in the procurement as whole. The highest losses were in the process of transportation i.e percent, it followed by losses in the weighing (5.64 percent). Table.14 : Losses of Tomato in Procurement from Producer to Consumer (Per Quintal) Sr. No Activity Tomato loss (kg) Percent Share 1 Packing Uploading Transportation Grading Downloading Weighing Total Loss Overall Chain Efficiency: ( )/100 = 0.76 Page 270

11 In modern chain the losses were highest when pass from producer to outlet i.e kg per quintal. In modern outlet centre, when tomatoes move from modern outlet to consumer, the losses were 0.70 kg. In case of the different chains, the when tomatoes passed from the producer to wholesaler, the kg per quintal tomatoes were lost. When it passed from wholesaler to retailer/hawker, the 3.94 kg tomatoes were lost. When the tomatoes passed from the retailer to consumer the losses were 3.62kg and when from hawker to consumer the losses were only 0.10 kg. The maximum loss was seen in from producer to wholesaler(72.20 percent). Page 271
12 Page 272
 and hawker chain(0.")
13 The highest efficiency was observed in modern chain i.e as compared to retailer chain(0.73) and hawker chain(0.76) Page 273
14 Table. 15 : Chainwise loss of Tomato in Procurement from Producer to Consumer (per quintal) Modern Chain Suppliers Quantity loss (Kg) Percent Producer Modern Outlet Centre Consumer Total Traditional Chain-1 Chain Efficiency: ( )/100 = 0.80 Suppliers Quantity loss (Kg) Percent Producer Wholesaler Retailer Consumer Total Traditional Chain-2 Chain Efficiency: ( )/100 = 0.73 Suppliers Quantity loss (Kg) Percent Producer Wholesaler Hawker Consumer Total Chain Efficiency: ( )/100 = PRICE TREND OF TOMATOES IN MAHARASHTRA As the daily arrival in the market hits the daily price of the tomatoes, the study of the daily data can give exact relationship between prices and arrivals. The impact of the today s arrivals and last day price on the present day price is estimated by log linear function. The daily data of 311 markets in Maharashtra from the period 01 Jan 2008 to 28 feb 2009 for around 4535 entries of daily recorded time series data is analyzed. The results indicates that if arrivals increase by 1 quintal, the price of the tomatoes significantly declined by Rs The today s price is surely increased by Rs with the increase in price of last day Page 274
15 Table 17. Price trend in tomatoes in Maharashtra Particular Coefficient T value Intercept Today s arrivals Last day price CONCLUSION It is concluded that the tomato cultivators involved in the modern supply chain are more profitable and the consumers also more beneficial from modern supply chain as compared to traditional REFERENCES [1] Anonymous 2008, Tomato Profile. Safal National Exchange of India Limited Bangalore. [2] K. Loknanadan, Supply Chain Management Analysis of tomatoes from farm to modern retail outlet. Indian Journal of Agricultural Marketing. Vol.21 (65-71) [3] Rakesh Singh, 2008, New farm supply chain initiatives in Indian agriculture. Website of institute of management, Chennai. Page 275