UF-IFAS Nitrogen Fertilization and Management Recommendations for Fresh Tomato Production in Florida in the BMP Era
|
|
|
- Giles Burns
- 5 years ago
- Views:
Transcription
1 UF-IFAS Nitrogen Fertilization and Management Recommendations for Fresh Tomato Production in Florida in the BMP Era Monica Ozores-Hampton, Eric Simonne, Eugene McAvoy, Phil Stansly, Sanjay Shukla, Pam Roberts, Fritz Roka, Kent Cushman, Morgan Kelly, Darrin Parmenter, Phyllis Gilreath and Tom Obreza.
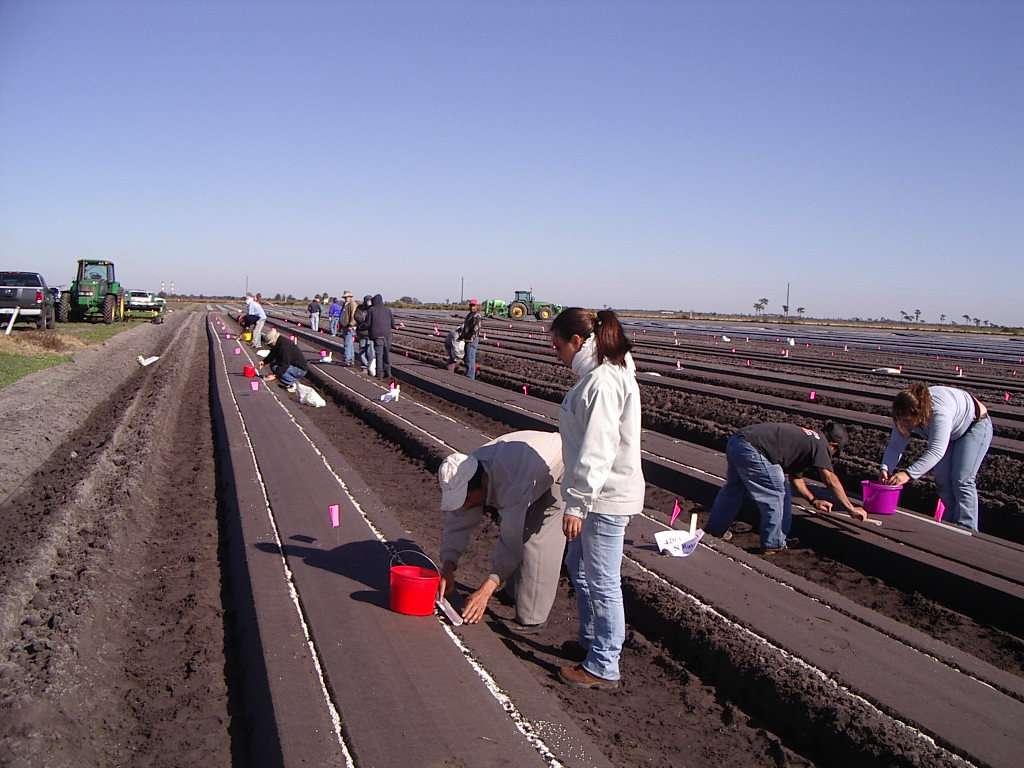
2 Objectives Establish partnerships with selected southwest Florida vegetable growers to evaluate the effects of N nutrient applications under commercial growing conditions; Evaluate the effect of selected N application rates on plant growth, disease incidences, and production; Determine the optimal N rate for tomato production and evaluate the cost effectiveness of selected N application rates; Propose, if needed, a change in N recommendation to PNOC Develop an Extension plan to demonstrate the updated N recommended rate and facilitate the adoption of nutrient BMPs by the industry.

3 Experiment Locations *

4 Experiment Locations *
5 Trial number Location Season Irrigation type 6-7 N rate (lb/acre) Exp size (acres) 1 Collier Fall, Aug 31 Seepage and (CRD) 2 Collier Winter, Oct 16 Drip and Collier Winter, Oct 17 Seepage, 25, +C 1 (CRD) 4 Collier Winter, Oct 26 Seepage and 32 3 (CRD) 5 Collier Winter, Nov 15 Seepage and (CRD) 6 Collier Winter, Nov 27 Drip and Pepper Palm Beach 8 Palm Beach 9 Palm Beach Winter, Nov 23 Seepage and (CRD) Winter, Nov 21 Seepage and (CRD) Winter, Nov 24 Seepage and (CRD) 1 Collier Spring, Feb 12 Seepage and (CRD) 11 Manatee Spring, Feb 15 Seepage 2 to 42.4 (CRD) 12 Manatee Spring, Feb 19 Drip 225 and 33 2 to Manatee Spring, Feb 19 Drip 225 and 33 2 to Manatee Spring, Feb 19 Drip 225 and 33 2 to 12
6 Seep Experiments
7
8
9


10 2-12 plots per treatment with 3 reps 1 plants per plot 3 harvests


11 4-12 plots per treatment 1 plants per plot 3 harvests


12 Weekly report to growers and IFAS Final report to growers and final data set to IFAS
13 Fall Season Aug-Oct 15
 21 acres vs 26 lb")
14 Trial 1 Seep Irrigation Fall, 6 (August 31) 21 acres vs 26 lb N/acre
15 Field History Experimental Design Plot Size Experiment size Irrigation Planting Date CRD (3 Reps) 3.4 acres 21 acres Seepage Aug 31, 6 (Fall) Bed wide 32" Cell Size Fumigation M.B 15/acre (98:2) Linear ft per acre 7,26 Plant population 4,373 Bed Height Plant Spacing Row run 8 in 2 in North to South Monitoring Wells 6 Planting to 3er Harvest 1st 2nd 3rd 14 weeks 13-Nov-6 27-Nov-6 13-Dec-6 Trial 1 SOIL ANALYSIS 15-Aug-6 ph 6.9 Phosphorus (ppm) 152 Potassium (ppm) 1 Magnesium (ppm) 46 Calcium (ppm) 486
16 NO3 (ppm) Nitrogen Sap 2, 1,8 1,6 1,4 1, 1, /26/6 1/1/6 1/24/6 11/7/6 Date First Harvest 11/21/6 12/5/6 26 Sufficiency range
17 K (ppm) Potassium Sap 6, 5, 4, 3, 2, 1, 9/26/6 1/1/6 1/24/6 11/7/6 11/21/6 12/5/6 Date 26 Sufficiency range
18 Pressure (Kpa) Water level (inches) Water Tables /26/6 1/1/6 1/24/6 Date 11/7/6 11/21/6 12/5/6 26 Tensiometer /24/6 11/7/6 Date 11/21/6 12/5/6 26
19 Yield (boxes/acres) Yield (boxes/acres) First Harvest (November 13, 6) 1,6 1,4 1, 1, /6 6/6 6/7 Culls Total Tomato size Second Harvest (November 27, 6) /6 6/6 6/7 Culls Total Tomato size
20 Yield (boxes/acres) Yield (boxes/acres) Third Harvest (December 13, 6) 1, 1, /6 6/6 6/7 Culls Total Tomato size Total Harvest 3,5 3, 2,5 95 boxes/acre 2, 1,5 26 1, 5 5/6 6/6 6/7 Culls Total Tomato size
21 Winter Season Oct 15 - Dec 1
 1 acre, +C and 25 lb")
22 Trial 3 Seep Irrigation Winter, 6 (Oct 17) 1 acre, +C and 25 lb N/acre
23 Field History Trial 3 Trial 4 Experimental Design CRD (3 Reps) Irrigation Seepage Plot size.17 acres Experiment size 1 acres Planting Date Oct 17, 6 (Winter) Cell Size 242 Fumigation M.B. Linear ft per acre 7,26 Plant population 4,84 Bed Height 8 in Plant Spacing 18 in Row run North - South Monitoring Wells 6 2 weeks Planting to 3rd Harvest 1st 24-Jan-7 2nd 16-Feb-7 3rd 7-Mar-7 Experimental Design CRD (3 Reps) Irrigation Seepage Plot size.5 acres Experiment size 3 acres Planting Date Oct 26, 6 (Winter) Cell size Fumigation M.B /Acre (67:33) Linear ft per acre 7,26 Plant population 3,346 Bed Height 8 in Plant Spacing 26 in Row run North-south Monitoring Wells 6 Planting to 3er Harvest 16 weeks 1st 17-Jan-7 2nd 1-Feb-7 3rd 15-Feb-7
24 Trial 4 Seepage Irrigation Winter, 6 (Oct 26) 3 acres vs. 32 lb/acres
25 NO3 (ppm) NO3 (ppm) 2, 1,8 1,6 1,4 1, 1, /7/6 11/21/6 12/5/6 Nitrogen Sap 12/19/6 1/2/7 1/16/7 First Harvest 1/3/7 2/13/7 2/27/7 Date 25 + Compost Sufficiency range 2,5 Nitrogen Sap First Harvest 2, 1,5 1, 5 11/7/6 11/21/6 12/5/6 12/19/6 1/2/7 Date 1/16/7 1/3/7 2/13/7 32 Sufficiency range
26 K (ppm) K (ppm) Potassium Sap 7, 6, 5, 4, 3, 2, 1, 11/7/6 11/21/6 12/5/6 12/19/6 1/2/7 1/16/7 1/3/7 2/13/7 2/27/7 Date 25 + Compost Sufficiency range Potassium Sap 5,5 5, 4,5 4, 3,5 3, 2,5 2, 1,5 1, 11/7/6 11/21/6 12/5/6 12/19/6 1/2/7 Date 1/16/7 1/3/7 2/13/7 32 Sufficiency range
27 Water level (inches) Water level (inches) Water Table /24/6 11/7/6 11/21/6 12/5/6 12/19/6 1/2/7 1/16/7 1/3/7 2/13/7 Date 25 + Compost Water Tables /7/6 11/21/6 12/5/6 12/19/6 1/2/7 1/16/7 1/3/7 2/13/7 Date Avg 32
28 Yield (boxes/acres) Yield (boxes/acre) First Harvest (January 24, 7) 1, 1, c a ab b 5/6 6/6 6/7 Culls TOTAL a Tomato size b 25 +Compost a First Harvest (January 17, 7) /6 6/6 6/7 Culls Total Tomato size
29 Yield (boxes/acres) Yield (Boxes/acre) Second Harvest (February 16, 7) 2, 1,5 1, 5 5/6 6/6 6/7 Culls TOTAL Tomato size 25 +Compost Second Harvest (February 1, 7) 1, /6 6/6 6/7 Culls Total Tomato size 32
30 Yield (boxes/acres) Yield (Boxes/acre) Third Harvest (March 7, 7) 1, /6 6/6 6/7 Culls TOTAL Tomato size 25 +Compost Third Harvest (February 15, 7) 1,6 1,4 1, 1, /6 6/6 6/7 Culls Total Tomato size 32
31 Yield (boxes/acre) Yield (boxes/acre) Total Harvest 3,5 3, 2,5 2, 1,5 1, 5 91 boxes/acre 5/6 6/6 6/7 Culls Total Tomato Size 25 +Compost Total Harvest 3, 2,5 2, 197 boxes/acre 1,5 1, /6 6/6 6/7 Culls Total Tomato size
32 Trial 5 Seepage Irrigation Winter, 6 (Nov 15) 21 acres vs 26 lb N/acre
 5.5 acres vs 3 lb N/acre 2% CRF hot mix")
33 Trial 8-9 Seepage Irrigation Winter, 6 (Nov 22) 5.5 acres vs 3 lb N/acre 2% CRF hot mix
34 Trial 5 Field History Trial 8-9 (21 % CRF) Hot Mix Experimental Design CRD (3 Reps) Irrigation Seepage Plot size 3.4 acres Experiment size 21 acres Planting Date Nov 15, 6 (Winter) Bed wide 32 in Cell Size Fumigation M.B 15/acre (98:2) Linear ft per acre 7,26 Plant population 4,373 Bed Height 8 in Plant Spacing 2 in Row run North to South Monitoring Wells 6 Planting to 3er Harvest 18 weeks 1st 26-Feb-7 2nd 14-Mar-7 3rd 22-Mar-7 Experimental Design CRD (3 Reps) Irrigation Seepage Plot size.9 acres Experiment size 5.5 acres Plant Date Nov 22, 6 (Winter) Cell Size Fumigation M.B Linear ft per acre 7,26 Plant population 3,63 Bed Height 9 in Plant Spacing 24 in Row run North to South Monitoring Wells 3 Planting to 3er Harvest 17 weeks 1st 19-Feb-7 2nd 9-Mar-7 3rd 23-Mar-7
35 N3 (ppm) NO3 (ppm) Trial 5 2,5 2, Nitrogen- Sap First Harvest 1,5 1, 5 12/19/6 1/2/7 1/16/7 1/3/7 Date 2/13/7 2/27/7 3/13/7 26 Sufficiency range 3, 2,5 2, 1,5 1, 5 Trial 8-9 Nitrogen Sap First Harvest Nitrogen (%) N Rates (Lb/acre) 12/15/6 12/29/6 1/13/7 1/27/7 2/9/7 FB FF 1-inch 2-inch 2>inch 12/15/6 12/29/6 1/12/7 1/26/7 2/9/7 Date 2/23/7 3/9/7 3/23/ Sufficiency range Adequate range
36 K (ppm) K (ppm) Trial 5 7, K- Sap 6, 5, 4, 3, 2, 1, 12/19/6 1/2/7 1/16/7 1/3/7 Date 2/13/7 2/27/7 3/13/7 26 Sufficiency range N Rates (Lb/acre) Potassium (%) 12/15/6 12/29/6 1/13/7 1/27/7 2/9/7 FB FF 1-inch 2-inch 2>inch Adequate range , 7, 6, 5, 4, 3, 2, 1, - Trial 8-9 K Sap Date 12/15/6 12/29/6 1/12/7 1/26/7 2/9/7 2/23/7 3/9/7 3/23/7 3 Sufficiency range
37 Water level (inches) Water level (inches) Pressure (kpa) Trial 5 25 Water Tables Trial 5 Tensimeter /19/6 1/2/7 1/16/7 1/3/7 2/13/7 2/27/7 3/13/7 1/15/7 1/29/7 2/12/7 Date 2/26/7 3/12/7 Date lb N/acre 26 lb N/acre lb N/acre 26 lb N/acre Trial 8-9 Water Tables /13/7 1/27/7 2/1/7 Date 2/24/7 3/1/7
38 Yield (boxes/acre) Yield (boxes/acre) Yield (boxes/acre) First Harvest (Feb 26, 7) 1,6 1,4 1, 1, Trial 5 Virus 5/6 6/6 6/7 Culls Total Tomato size 26 Var Trial 8-9 First Harvest (February 19, 7) 5/6 6/6 6/7 Culls Total 3 Tomato size Var 2 First Harvest (February 19, 7) /6 6/6 6/7 Culls Total 3 Tomato size
39 Yield (boxes/acre) Yield (boxes/acre) Yield (boxes/acre) Second Harvest (March 14, 7) 1,8 1,6 1,4 1, 1, Trial 5 5/6 6/6 6/7 Culls Total Tomato size 26 Var Trial 8-9 Second Harvest (March 9, 7) 5/6 6/6 6/7 Culls Total 3 Tomato size Var Second Harvest (March 9, 7) 5/6 6/6 6/7 Culls Total Tomato size 3
40 Yield (boxes/acre) Yield (boxes/acre) Yield (boxes/acre) Third Harvest (March 22, 7) Trial 5 Virus 5/6 6/6 6/7 Culls Total Tomato size 26 Var 1 1, 8 6 Trial 8-9 Third Harvest (March 23, 7) 4 3 5/6 6/6 6/7 Culls Total Tomato size Var 2 Third Harvest (March 23, 7) 1, 1, /6 6/6 6/7 Culls Total Tomato size
41 Yield (boxes/acre) Yield (boxes/acre) Yield (boxes/acre) Total Harvest 4, 3,5 512 boxes/acre 3, 2,5 2, 1,5 1, 5 Trial 5 Virus 5/6 6/6 6/7 Culls Total Tomato size 26 Var 1 2,5 2, 1,5 Trial 8-9 Total Harvest 73 boxes/acre 1, 3 5 5/6 6/6 6/7 Culls Total Tomato size Var 2 Total Harvest 3, 2,5 197 boxes/acre 2, 1,5 1, 3 5 5/6 6/6 6/7 Culls Total Tomato size
42 Trial 2 Drip Irrigation Winter 7 (Oct 16) 35 acres vs 3 lb N/acre
 5 acres vs 3 lb")
43 Trial 6 Drip Irrigation Winter, 6 (Nov 27) 5 acres vs 3 lb N/acre
44 Field History Trial 2 Trial 6 Irrigation Drip Irrigation Drip Plot size (acres) 19.8 (1E/Grower)/15.4 (1W/BMP) Plot size (acres) 25 Plant Date Oct 16, 6 (Winter) Plant Date Nov 27, 6 (Winter) Cell Size Fumigation M.B Fumigation M.B Linear ft per acre 7,26 Linear ft per acre 7,26 Plant population 4,356 Plant population 4,356 Bed Height 9 in Bed Height 9 in Plant Spacing 2 in Plant Spacing 2 in Row run North to South Row run North to South Monitoring Wells 2 Monitoring Wells 2 Planting to 3er Harvest 19 weeks Planting to 3er Harvest 2 weeks 1st 6-Mar-7 1st 18-Jan-7 2nd 8-Feb-7 2nd 26-Mar-7 3rd 1-Mar-7 3rd 11-Apr-7
45 N3 (ppm) N3 (ppm) Trial 2 2,5 Nitrogen Sap First Harvest 2, 1,5 1, 5 11/8/6 11/22/6 12/6/6 12/2/6 1/3/7 Date 1/17/7 1/31/7 2/14/7 2/28/7 3 Sufficiency range N Rates (Lb/acre) Nitrogen (%) FB FF 1-inch 1>inch 2>inch 1st Harv 1st Harv 2 nd Harv 11/8/6 11/23/6 12/6/6 12/2/6 1/3/7 1/18/7 1/3/7 2/14/ Adequate range , 2,5 2, 1,5 1, 5 Trial 6 Nitrogen Sap First Harvest 12/2/6 1/5/7 1/21/7 2/6/7 2/22/7 Date 3/1/7 3/26/7 4/11/7 3 Sufficiency range
46 K (ppm) K (ppm) Trial 2 Potassium Sap 7, 6, 5, 4, 3, 2, 1, 11/8/6 11/22/6 12/6/6 12/2/6 1/3/7 1/17/7 1/31/7 Date 3 Sufficiency range 2/14/7 2/28/7 N Rates (Lb/acre) Potassium (%) 11/8/6 11/23/6 12/6/6 12/2/6 1/3/7 1/18/7 1/3/7 2/14/7 FB FF 1-inch 1>inch 2>inch 1st Harv 1st Harv 2 nd Harv Adequate range Trial 6 Potassium Sap 7, 6, 5, 4, 3, 2, 1, 12/2/6 1/3/7 1/17/7 1/31/7 2/14/7 Date 2/28/7 3/14/7 3/28/7 4/11/7 3 Sufficiency range
47 Water level (inches) Water level (inches) Trial 2 Water Tables /8/6 11/22/6 12/6/6 12/2/6 1/3/7 Date 1/17/7 1/31/7 2/14/7 2/28/7 3/14/7 3 Dry Trial 6 Water Tables /3/7 1/17/7 1/31/7 2/14/7 Date 2/28/7 3/14/7 3/28/7 3
48 Pressure (kpa) Pressure (kpa) Trial 2 12 Tensiometer '' A 3 12'' B 3 12'' C 6'' A 12'' B 12'' C - 11/8/6 11/22/6 12/6/6 12/2/6 1/3/7 1/17/7 1/31/7 2/14/7 2/28/7 Date Trial 6 12 Tensiometer '' A 3 12'' B 3 12'' C 6'' A 12'' B 12'' C 1/3/7 1/17/7 1/31/7 2/14/7 2/28/7 3/14/7 3/28/7 Date
49 Yield (Boxes/acre) Yield (Boxes/acre) Trial 2 8 First Harvest (January 18, 7) /6 6/6 6/7 Culls Total Tomato size Trial 6 First Harvest (March 6, 7) /6 6/6 6/7 Culls Total Tomato size 3
50 Yield (boxes/acre) Yield (boxes/acre) Trial Second Harvest (February 8, 7) 5/6 6/6 6/7 Culls Total Tomato size 3 Trial 6 1, 1, Second Harvest (March 26, 7) /6 6/6 6/7 Culls Total Tomato size
51 Yield (boxes/acre) Yield (boxes/acre) Trial 2 7 Third Harvest (March 1, 7) /6 6/6 6/7 Culls Total Tomato size Trial 6 Third Harvest (April 11, 7) /6 6/6 6/7 Culls Total Tomato size 3
52 Yiekld (Boxes/acre) Yiekld (Boxes/acre) Trial 2 2,5 2, Total Harvest 179 boxes/acre 1,5 1, 3 5 5/6 6/6 6/7 Culls Total Tomato size Trial 6 3, Total Harvest 2,5 2, 1,5 1, 5 69 boxes/acre 3 5/6 6/6 6/7 Culls Total Tomato size

53 Damage Index Foliar damage 1 to 5 Fruit Damage 6 5-2% 7 2-5% 8 5-1% Late Blight Trial IFAS Grower 1/14/7 1/21/7 1/28/7 2/4/7 2/11/7 2/18/7 2/25/7 Date

54 Trial 7 Seepage Irrigation Winter, acres vs 3 lb N/acre
55 Field History Experimental Design CRD (3 Reps) Irrigation Seepage Plot size.9 acres Experiment size 5.5 acres Plant Date Nov 23, 6 (Winter) Cell Size 242 Fumigation M.B Linear ft per acre 7,26 Plant population 17,424 Bed Height 9 in Plant Spacing 1 in x 2 rows Row run North to South Monitoring Wells 3 Planting to 5th Harvest 22 weeks 1st 5-Feb-7 2nd 23-Feb-7 3rd 9-Mar-7 4th 23-Mar-7 5th 13-Apr-7 6th 3-Apr-7
56 N3 (ppm) Nitrogen Sap 3,5 3, 2,5 2, 1,5 1, 5 12/15/6 12/29/6 1/12/7 1/26/7 2/9/7 Date 2/23/7 3/9/7 3/23/7 3 Sufficiency range N Rates (Lb/acre) Nitrogen (%) 12/15/6 12/29/6 1/13/7 1/27/7 2/9/7 FB FOF FHG FHG 1 st Harv Adequate range
57 K (ppm) Potassium Sap 8, 7, 6, 5, 4, 3, 2, 1, 12/15/6 12/29/6 1/12/7 1/26/7 2/9/7 Date 2/23/7 3/9/7 3/23/7 3 Sufficiency range N Rates (Lb/acre) Potassium (%) 12/15/6 12/29/6 1/13/7 1/27/7 2/9/7 FB FOF FHG FHG 1 st Harv Adequate range
58 Water level (inches) Water Tables /13/7 1/27/7 Date 2/1/7 2/24/7
59 Yield (bu/acre) Yield (bu/acre) First Harvest (February 5, 7) XL L M S Total Pepper size 3 Second Harvest (February 23, 7) XL L M S Total Pepper size 3
60 Yield (bu/acre) Yield (bu/acre) Third Harvest (March 9, 7) XL L M S Total Pepper size 3 Fourth Harvest (March 23, 7) XL L M S Total Pepper size 3
61 Yield (bu/acre) Yield (bu/acre) Fifth Harvest (April 13, 7) XL L M S Total Pepper size Sixth Harvest (April 3, 7) XL L M S Total Pepper size 3
62 Yield (bu/acre) Total Harvest 2, 1,5 77 bu/acre 1, 5 3 XL L M S Total Pepper size


63 Spring Experiments Seep Irrigation vs. 26 lb N/acre Seep Irrigation 2 to 42 lb N/acre 3 Experiments Drip Irrigation 225 vs. 33 lb N/acre
64


65 March 21, 3 days after transplant Grower
66 April 2, 45 days after transplant Grower

67 April 14, 6 days after transplant Grower
68 Yield (boxes/acre) 3,5 3, 2,5 2, 1,5 1, N rate (lb/acre) Csizinszky et al., 1998 Csizinszky et al., 1988 Csizinszky et al., 1988 Clark et al., 1989 Clark et al., 1989 Clark et al., 1989 Hochmuth et al., 1989 Hochmuth et al., 1989 Hochmuth et al., 1989 Schuler et al., 1989 Schuler et al., 1991 Schuler et al., 1992 Rhoads et al., 1996 Rhoads et al., 1996 Loscascio et al., 1996 Rhoads et al., 1999 Rhoads et al., 1999
69 Yield (boxes/acre) Yield (boxes/acre) Yields (boxes/acre) Totamo Yields Season 4-5 Tomato Yields Season 5-6 4, 3, 2, 1, 4, 3, Yields 2, 1, Yields N Rates (Lb/acres) N Rate (lb/acre) Tomato Yield Season 6-7 4, 3, 2, Fall Winter 1, N Rate (lb/acre)
70 N Budget (Season 5-6) Experimental Design CRD Irrigation Seepage Plot size.83 acres Experiment Size 5 acres Planting Date 4-Jan-6 Bed wide M.B /Acre (67:33) Fumigation MB Linear ft per acre 7,26 Plant population 3,346 Bed Height 8 in Plant Spacing 26 in Row run North-south Monitoring Wells 6 Planting to 3er Harvest 19 1st 14-Apr-6 2nd 4-May-6 3rd 18-May-6
71 N Rate (lb N/acre) N Budget root Days after Transplant
72 N Rate (lb N/acre) N Budget stems root Days after Transplant
73 N Rate (lb N/acre) N Budget leaves stems root Days after Transplant
74 N Rate (lb N/acre) N Budget % 86% fruit leaves stems root Days after Transplant
75 Where do we go from here? Growers and IFAS inputs: 3 trial IFAS vs. Growers fall tomatoes 1 split N application on fall tomatoes (wheel) 2 trials multiple N rates (fall and spring) 2 trials CRF fertilizer (tomato and pepper) 2 trials N management for drip-irrigated tomato 9 trials total
76 Monica Ozores-Hampton Website: