Is that it for 2018 corn rally? Demand is good, but gains depend on weather By Bryce Knorr, senior grain market analyst
|
|
|
- Lorena Mills
- 5 years ago
- Views:
Transcription
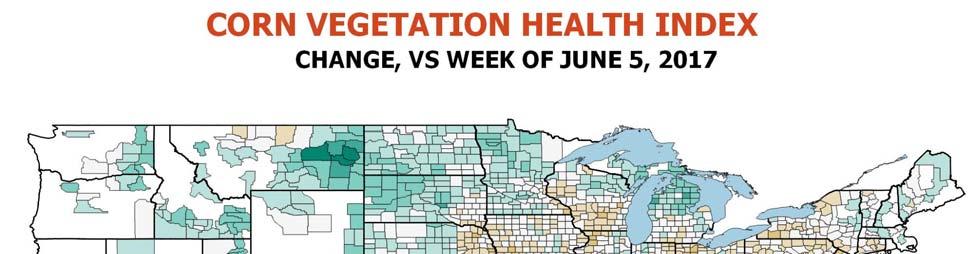
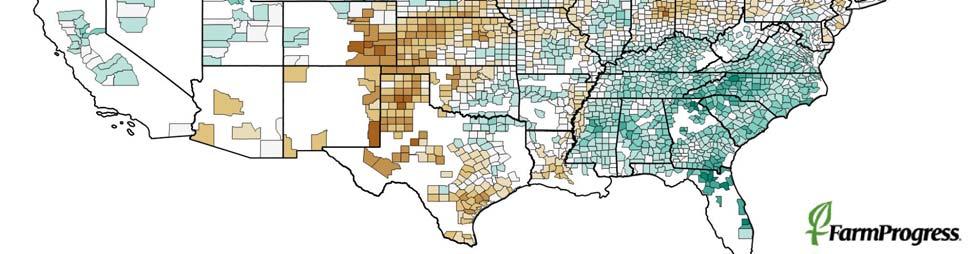
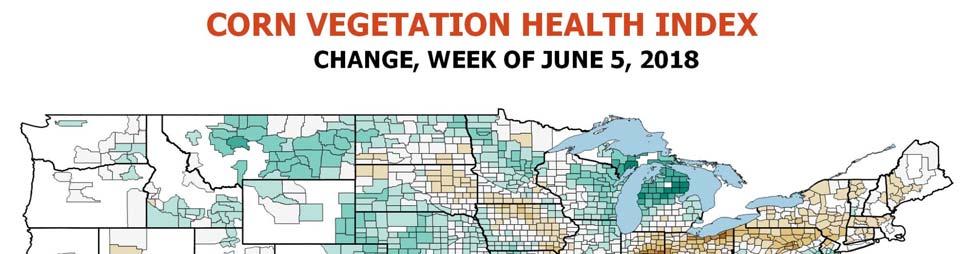
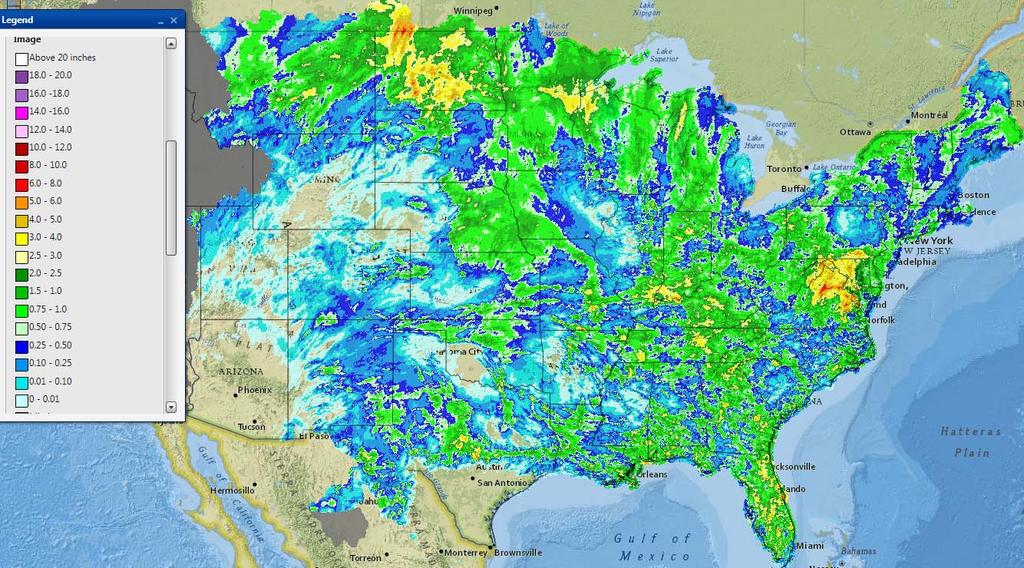
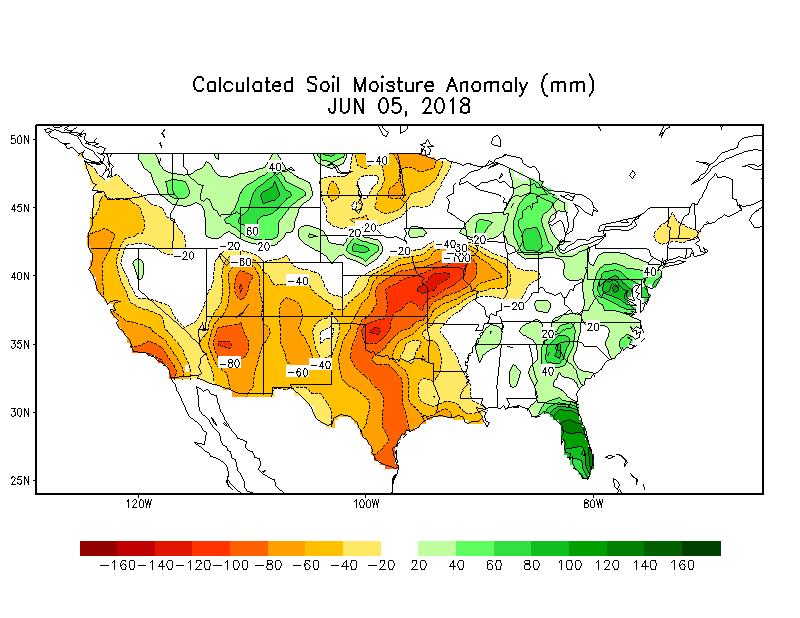
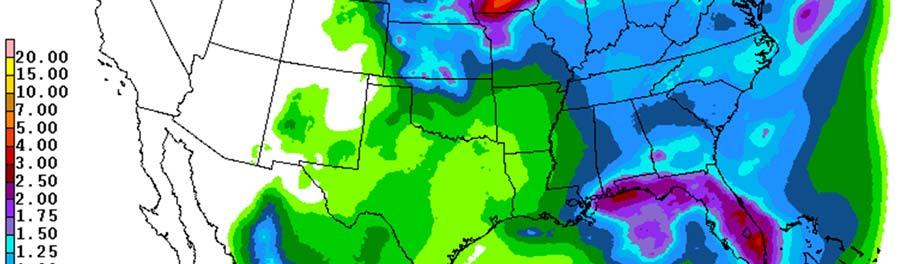
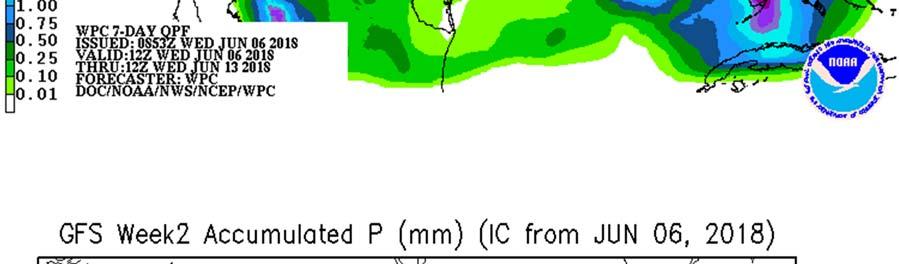
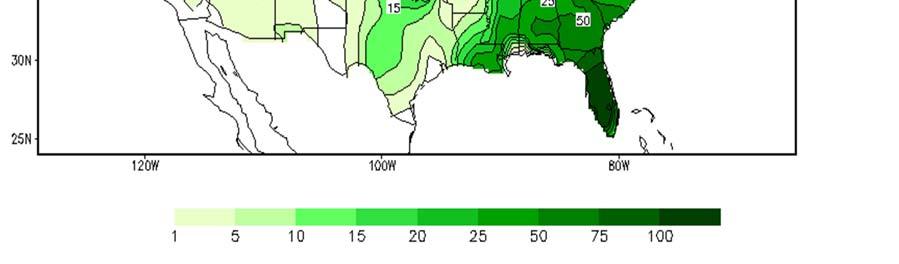
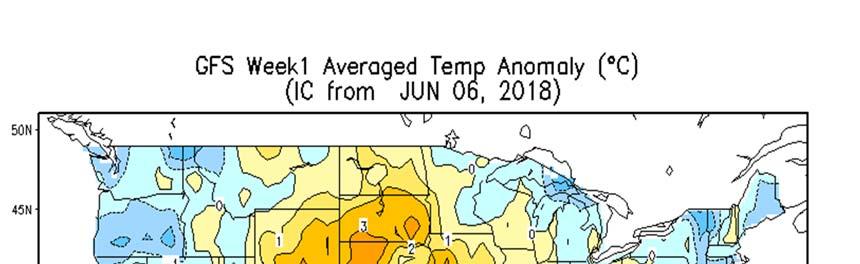
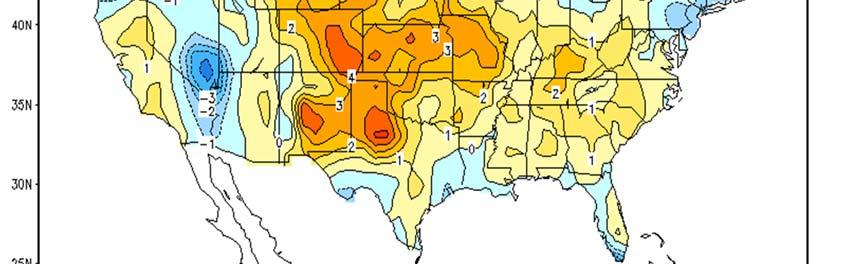
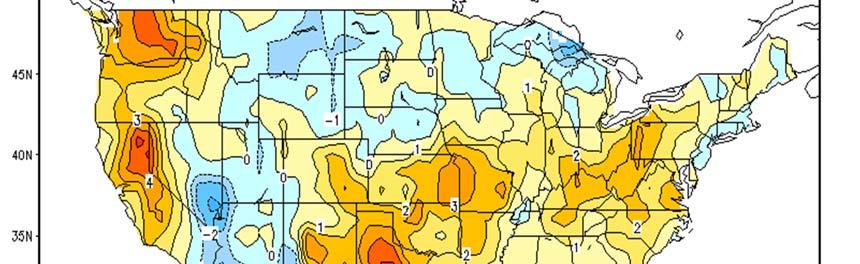
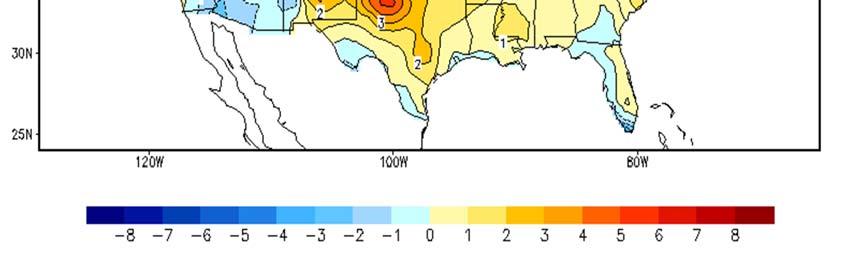
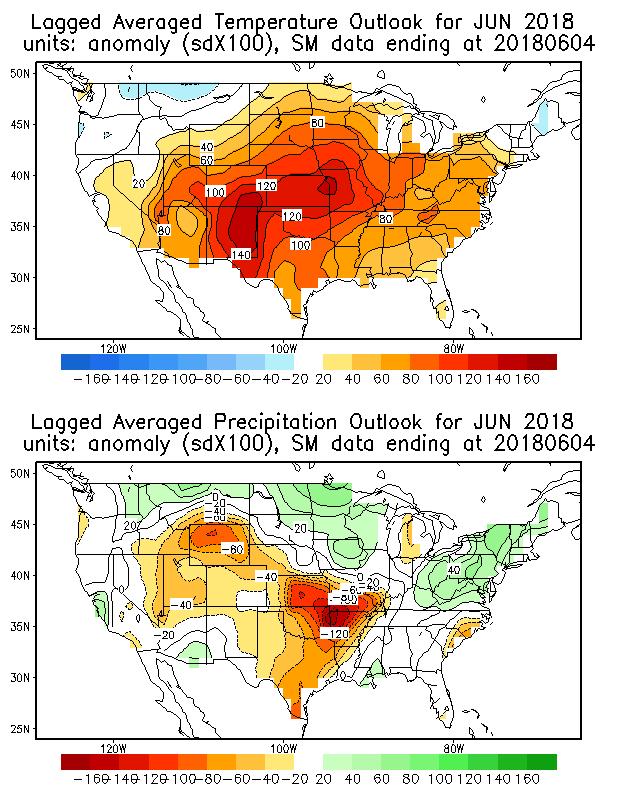
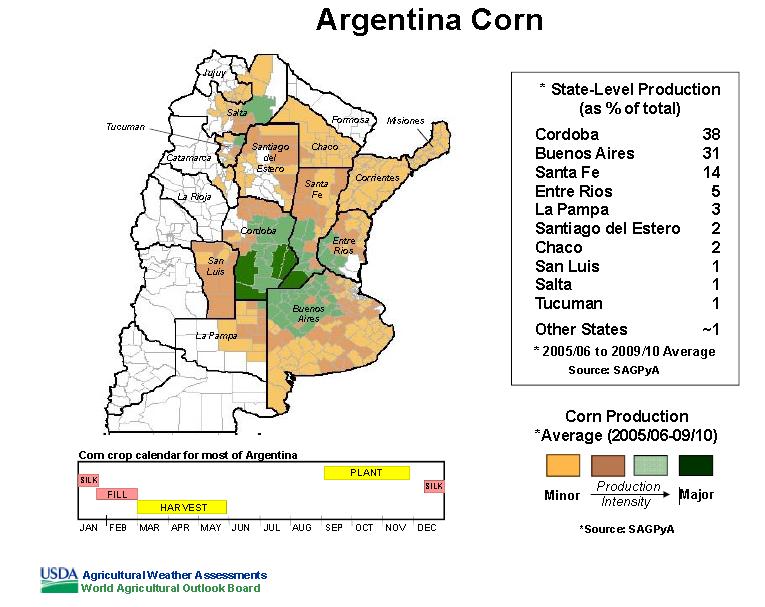
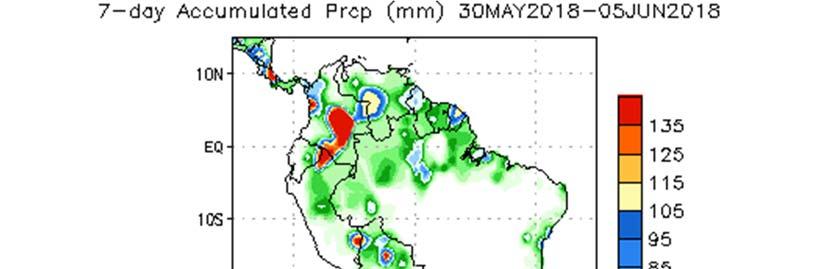
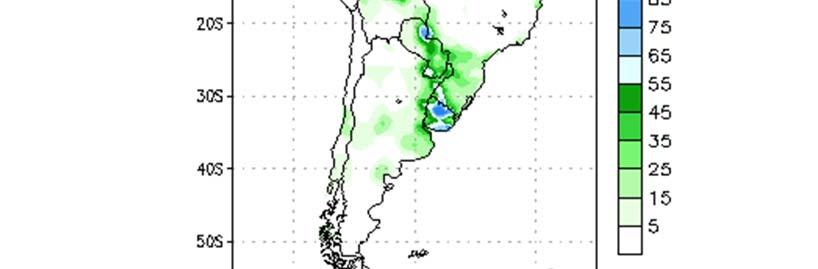
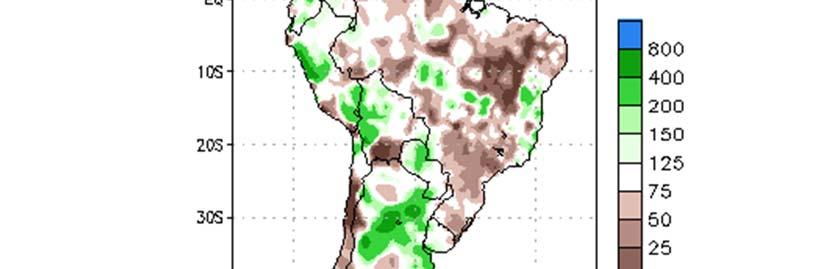
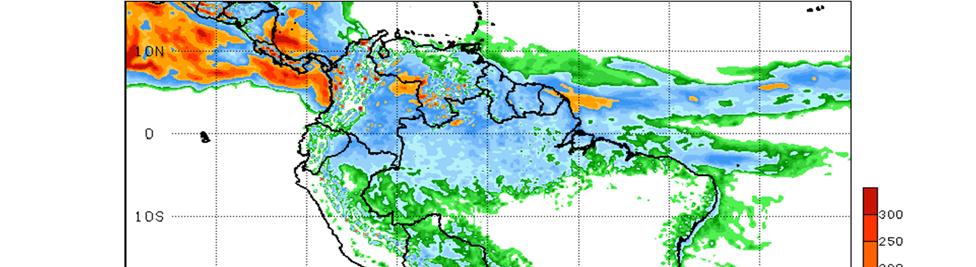
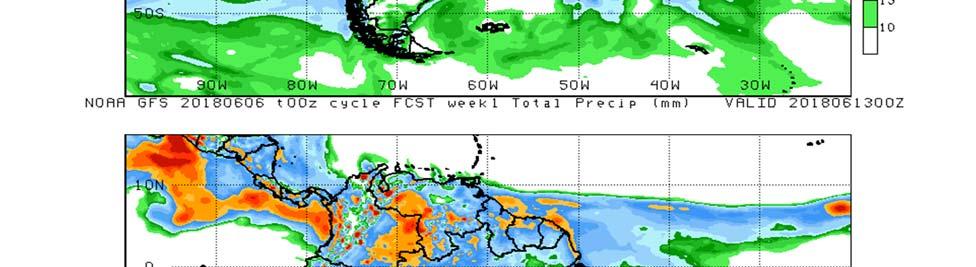
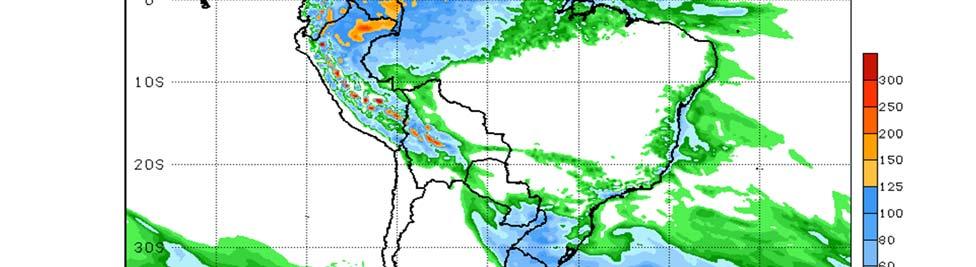
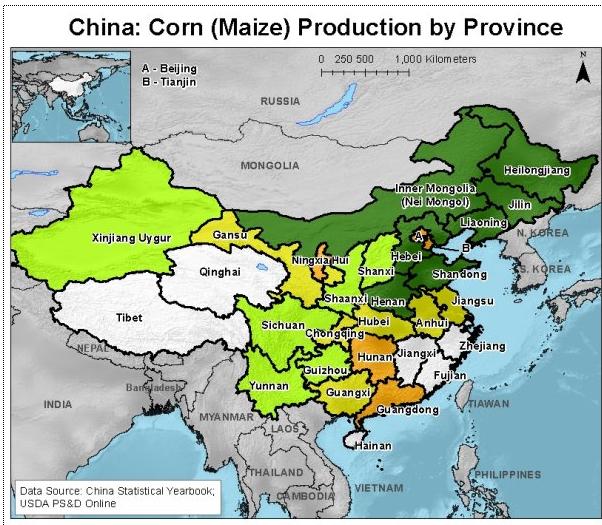
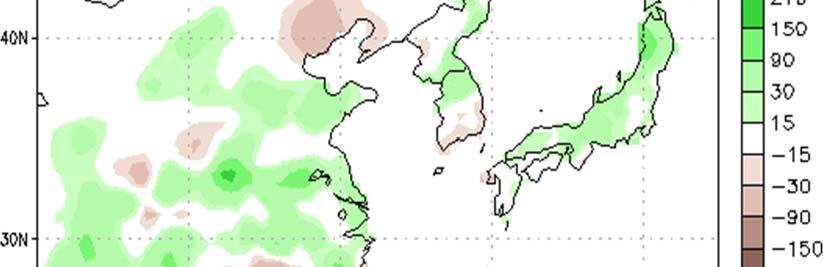
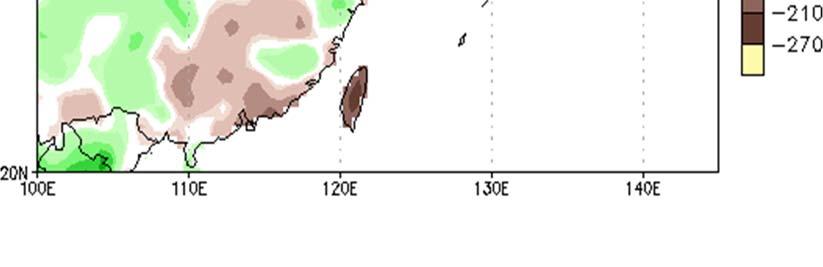
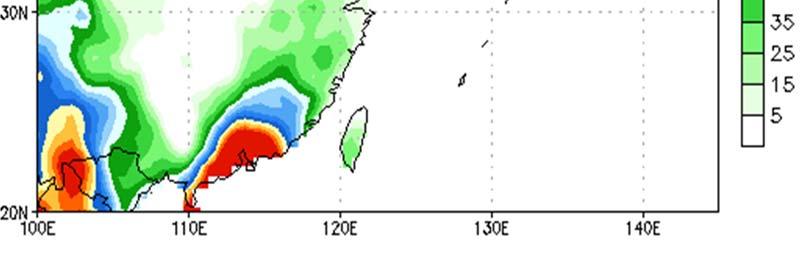
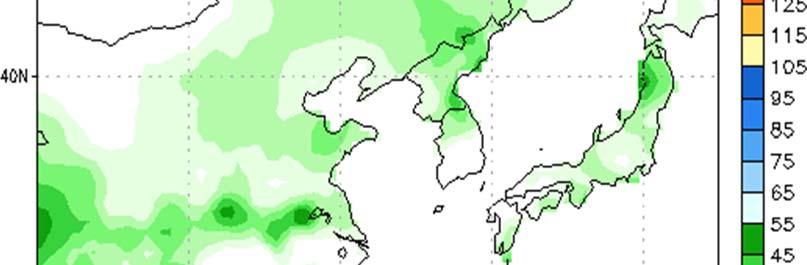
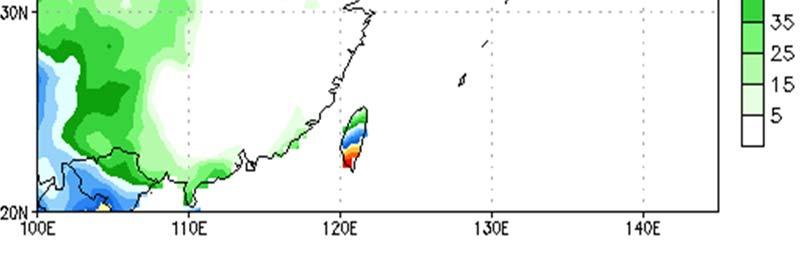
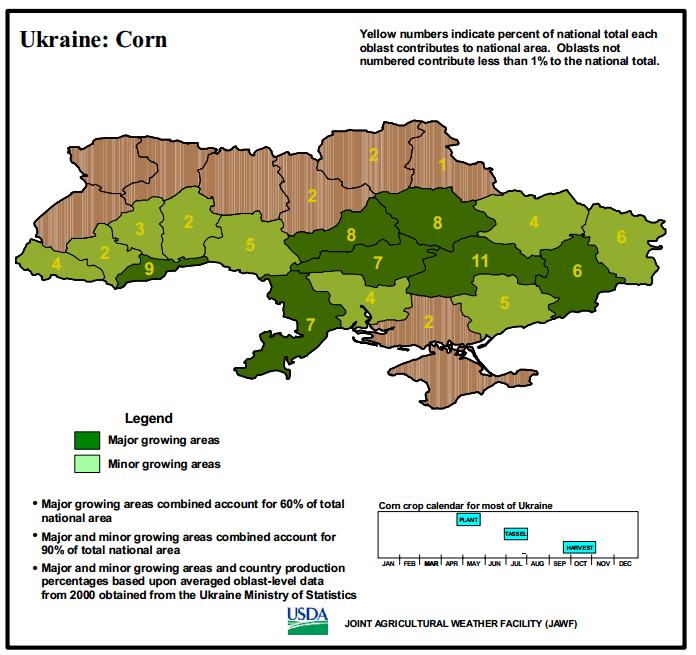
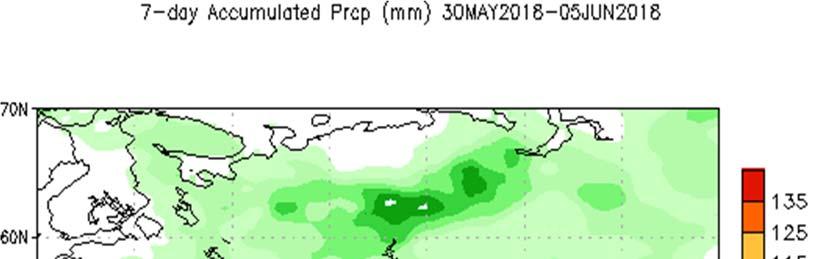
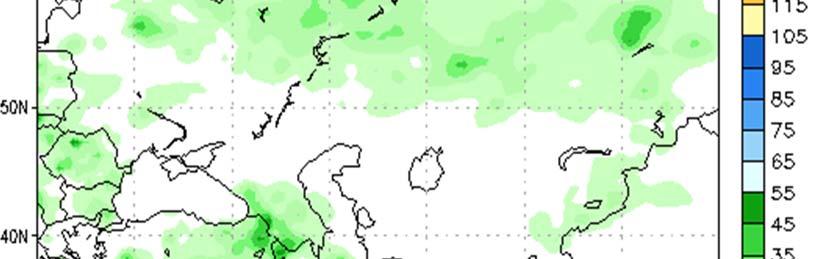
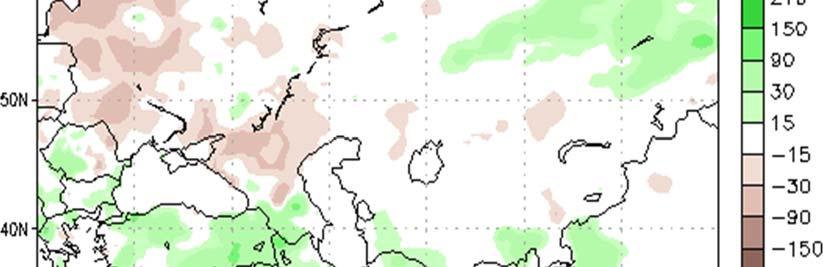
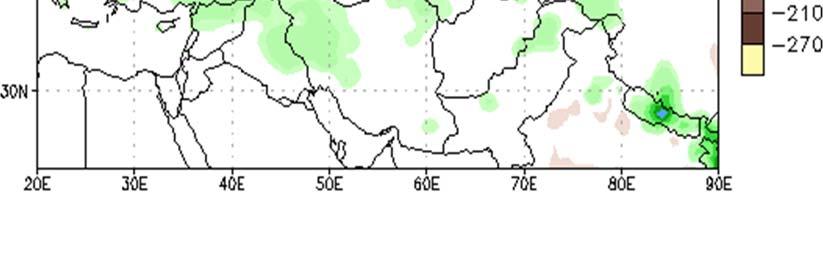
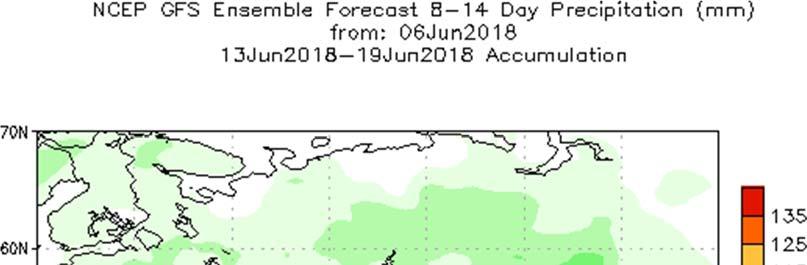
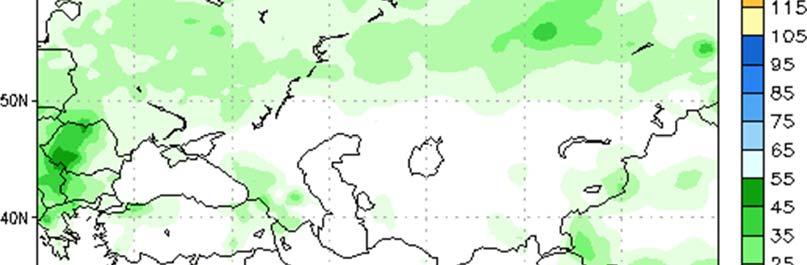
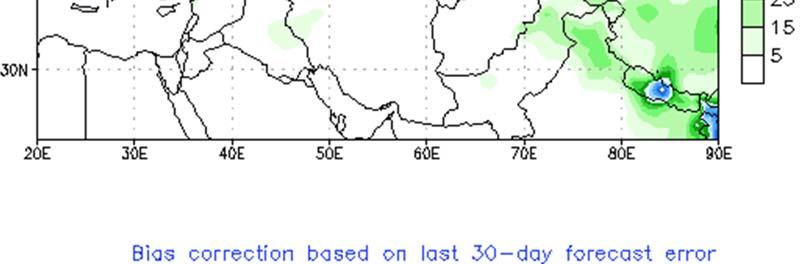
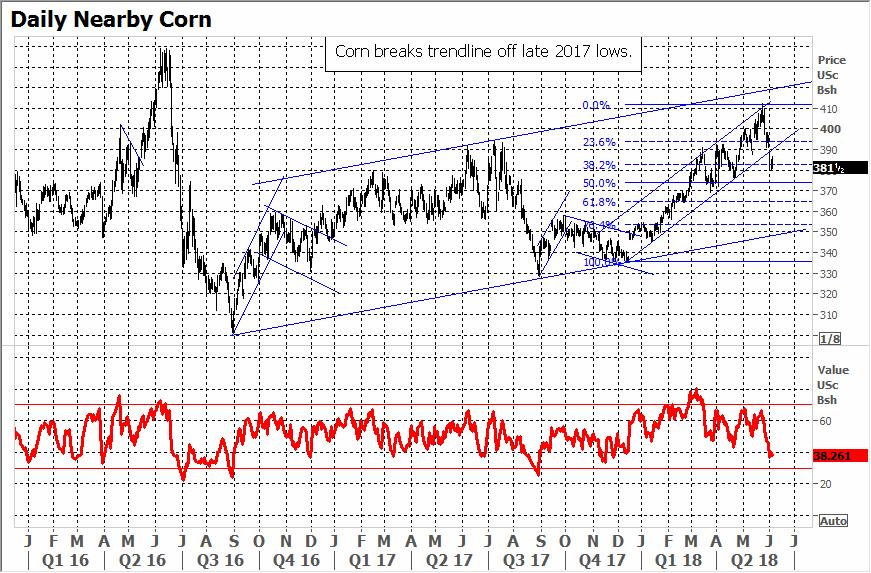
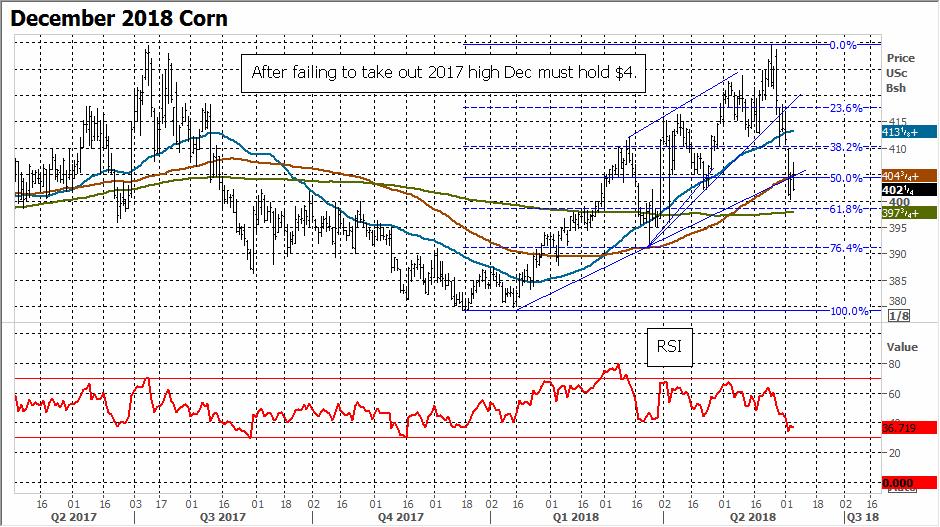
1 Is that it for 2018 corn rally? Demand is good, but gains depend on weather By Bryce Knorr, senior grain market analyst July weather is usually the key metric for determining corn yields, and most years, prices. But without gaining some backbone soon, futures rallies in a month or so may be short, and maybe not all that sweet. In years with rising prices the Memorial Day break doesn t take root. But new crop futures are threatening a break below $4 that could cause bulls to throw in the towel until clear signs of threatening weather emerge. While longer-range forecasts point to potential for June to be warmer, and drier in some places, the latest forecasts show just the opposite into expiration of July options June 22. That s just about the time forecasts start peering into the pollination window. To be sure, pollination isn t the be all and end all for rallies. Damage from heat and dry weather during fill, or too much rain or cool weather into the fall could pose problems. Some fields in Kansas were flooded out last week and heavy totals could pose problems in Iowa over the next week. But damage from those types of events takes months to play out. Tighter supplies, both here and around the world and strong demand could rally the market into Trouble is, that s a long time for a futures trade not known for its patience. Anecdotal reports support good early growing conditions reflected by USDA s first crop ratings, which were among some of the best starting reports on record. Widespread rains over the growing region could continue to support those conditions. Early vegetation index models don t agree with the optimistic assessment yet they look the same as last year, when the percentage of the crop rated good to excellent was 10% lower. But a few fits and starts in 2017 gave way to record yields, so these early analytics are very subject to change if stress is limited. My supply and demand table this week shows the disparity. Those early ratings suggest super yields of nearly 184 bushels per acre, producing a billion-bushel crop. With robust demand supplies could actually tighten a little over the next year, but still stay above 2 billion bushels. If that s the case, the projected selling range of $4.12 to $4.47 suggests only a brief rebound at best. USDA s June 12 update likely won t fiddle with new crop projections much, though old crop ending stocks could drop 50 million bushels or so due to better exports. Production estimates from South America are falling, and conditions in China and Ukraine are also somewhat dry. End users appear to be appreciating this fact, spurring more coverage from Asian buyers. But without some very big problems, don t look for the type of panic buying that triggers big rallies. Still, even average yields could make the market very nervous, jacking up the projected selling range on futures to $4.52 to $4.91. If the market breaks over the next two weeks, a fast pop could allow more pricing of new crop. I ve recommended being 20% covered so far. Watch for a quick surge in volatility if the market makes a move. That will increase the cost of options, but buying short-dated new crop September puts could be a way to step up coverage, rolling these to sales once yields are confirmed. One way to finance these might be to bull spread December 2018-July 2019 if it approaches lows near 22 cents of carry. A rally could yield a dime or so profits to lower the cost of puts. Otherwise, a vertical call spread, buying a December $4 call and selling a $5 call, would be another way to get upside coverage to make selling easier or to cover earlier sales. But take a look at the December chart for a reminder of how quickly rallies fall apart. December lost most of its spring rally when it couldn t take out last summer s $4.295 high. The next break could be even more dramatic.
2 Corn Supply & Demand USDA Bryce's Forecast 2018 Average 2018 Big Crop Area Planted 90,167 88,026 90,703 88,026 88,026 Harvested 82,703 80,700 82,703 80,885 80,885 Yield Beginning stocks 2,294 2,182 2,294 2,134 2,134 Production 14,604 14,040 14,605 13,957 14,875 Imports Supply, total 16,947 16,272 16,936 16,128 17,047 Feed and residual 5,500 5,375 5,427 5,169 5,498 Food, seed and ind. 7,040 7,115 7,062 7,132 7,132 Domestic, total 12,540 12,490 12,489 12,301 12,630 Exports 2,225 2,100 2,313 2,138 2,379 Use, total 14,765 14,590 14,802 14,439 15,008 Ending stocks 2,182 1,682 2,134 1,689 2,038 Ave. cash price $3.40 $3.85 $3.28 $4.01 $3.44 Stocks to use 14.8% 11.5% 14.4% 11.7% 13.6% Ave. nearby futures $3.66 $3.63 $4.36 $3.79 Top Third $3.81 $4.52 $4.12 of Price Range to $4.15 to $4.91 to $4.47


3 Percent Planted 100 CORN PLANTING PROGRESS /31 4/7 4/14 4/21 4/28 5/5 5/12 5/19 5/26 6/2 6/ Yr. Avg.

4

5 Percent Planted 400 CORN CONDITION INDEX /26 6/9 6/23 7/7 7/21 8/4 8/18 9/1 9/15 9/ Yr. Avg.
6

7
8
9

10
11


12
13
14
15

16
17
18
19
20
21
22 70 U.S. Corn Stocks/Use stocks/use Corn Demand million bushels Industrial Feed Exports
23
24 Average Corn Belt Ethanol Plant Margins $2.50 $2.00 $1.50 $1.00 $0.50 $0.00 $0.50 $ ETHANOL PRODUCTION GALLONS FROM EACH BUSHEL USED Sep 14 Jan 15 May 15 Sep 15 Jan 16 May 16 Sep 16 Jan 17 May 17 Sep 17 Jan 18
25 Monthly U.S. ethanol production and stocks 35,000 thousand barrels 30,000 25,000 20,000 15,000 10,000 5, Source: USEIA, Farm Futures Production Stocks Stocks WEEKLY ETHANOL PRODUCTION AND STOCKS Production thousand barrels /1/16 11/1/16 1/1/17 3/1/17 5/1/17 7/1/17 9/1/17 11/1/17 1/1/18 3/1/18 5/1/ thousand barrels/day Ending stocks Daily Production
26 Weekly Export Inspections in million bushels For week of 05/31/18 This Week Last Week Average Trade Guess This Week Last Year Rate Needed to Meet USDA Forecast Year-to- Date Total This Year Year-to- Date Total Last Year WHEAT ,010 CORN ,558 1,745 SOYBEANS ,720 1,879 Source: USDA, Reuters Weekly Export Sales (million bushels) AS OF WEEK ENDING 5/24/18 Wheat Corn Soybeans Old Crop Sales New Crop Sales Total Sales Prior Week (4.9) Trade Estimates Rate to reach USDA Forecast Export Shipments Rate to reach USDA Forecast Commitments % of USDA est. 96% 96% 99% 5-year average for this week 99% 92% 98% Shipments % of USDA est. 90% 66% 82% 5-year average for this week 92% 69% 91% Source: USDA, Re uters
27 Total Corn Sales & Shipments (Year to Date) % 100% 80% 60% 40% 20% 0% Total Commitments % of USDA Forecast Corn Shipments (Year to Date) 90.0% 80.0% 70.0% 60.0% 50.0% 40.0% 30.0% 20.0% 10.0% 0.0% Total Shipments % of USDA Forecast
28 New crop sales Total Next Year's Corn Sales (Year to Date) New Crop Sales Final Exports Final exports Unshipped Corn Sales Million Bushels
29 90,000 Weekly Corn Export Inspections 80,000 Thousand Bushels 70,000 60,000 50,000 40,000 30,000 20,000 10,000 5-Yr. Avg S O N D J F M A M J J A Commitment of Traders - Corn $5.00 net position in contracts $4.50 $4.00 $3.50 nearby futures /15 3/15 5/15 7/15 9/15 11/15 1/16 3/16 5/16 7/16 9/16 11/16 1/17 3/17 5/17 7/17 9/17 11/17 1/18 3/18 5/18 Source: CFTC $3.00 Index funds Hedge funds Futures
30 December Corn Bull vs Bear Years /1 1/1 3/1 5/1 7/1 9/1 11/1 Bull Market 17-Dec Dec-18 Normal Year
31 550 July Corn Bull vs Bear Years Aug Sep Oct Nov Dec Jan Feb Mar Apr May Jun Jul Bull Market Years July 2018 Normal Year
32
33