Plant Nutrients and Plant Nutrient Markets
|
|
|
- Pamela Walker
- 5 years ago
- Views:
Transcription

1 Chemicals for the Non-Chemist Plant Nutrients and Plant Nutrient Markets Citi Basic Materials Symposium New York, NY November 26, 2012 Dr. Michael R. Rahm Vice President Market and Strategic Analysis The Mosaic Company
2 Safe Harbor Statement This presentation contains forward-looking statements within the meaning of the Private Securities Litigation Reform Act of Such statements include, but are not limited to, statements about future financial and operating results. Such statements are based upon the current beliefs and expectations of The Mosaic Company s management and are subject to significant risks and uncertainties. These risks and uncertainties include but are not limited to the predictability and volatility of, and customer expectations about, agriculture, fertilizer, raw material, energy and transportation markets that are subject to competitive and other pressures and economic and credit market conditions; the level of inventories in the distribution channels for crop nutrients; changes in foreign currency and exchange rates; international trade risks; changes in government policy; changes in environmental and other governmental regulation, including greenhouse gas regulation, implementation of the U.S. Environmental Protection Agency s numeric water quality standards for the discharge of nutrients into Florida lakes and streams or possible efforts to reduce the flow of excess nutrients into the Gulf of Mexico; further developments in judicial or administrative proceedings; difficulties or delays in receiving, increased costs of or challenges to necessary governmental permits or approvals or increased financial assurance requirements; resolution of global tax audit activity; the effectiveness of the Company s processes for managing its strategic priorities; adverse weather conditions affecting operations in Central Florida or the Gulf Coast of the United States, including potential hurricanes or excess rainfall; actual costs of various items differing from management s current estimates, including, among others, asset retirement, environmental remediation, reclamation or other environmental regulation, or Canadian resources taxes and royalties; accidents and other disruptions involving Mosaic s operations, including brine inflows at its Esterhazy, Saskatchewan potash mine and other potential mine fires, floods, explosions, seismic events or releases of hazardous or volatile chemicals, as well as other risks and uncertainties reported from time to time in The Mosaic Company s reports filed with the Securities and Exchange Commission. Actual results may differ from those set forth in the forward-looking statements. 2
3 Plant Nutrients


4 Plant Nutrients Overview Plant nutrients are plant food (and common chemical elements) 17 chemical elements are required for plant growth Justus von Liebig and the Law of the Minimum N-P-K: the carbohydrates, protein and fat of a plant s diet Liebig s Barrel Growing importance of secondary nutrients and micronutrients especially in high yield systems 4


 18-46-0")
5 Plant nutrients are contained in a variety of products Much like nutrients for animals are contained in a variety of feed ingredients Each plant nutrient product is identified by three numbers Referred to as its analysis Percentage of each primary nutrient contained in a unit of the product Plant Nutrient Analysis Lawn Fertilizer Liquid Fertilizer ## - ## - ## N P K Starter Fertilizer 5 Urea Diammonium Phosphate (DAP) Muriate of Potash (MOP)


6 Maintaining Soil Fertility and Safeguarding the Environment 6 Soil fertility is maintained by replenishing the nutrients removed by crops each year Farmers maintain soil fertility and safeguard the environment by following the 4-Rs of nutrient stewardship The 4-Rs of nutrient stewardship Right source Right rate Right place Right time Best practices Soil testing Plant nutrient accounting Variable rate technology Multiple applications Nitrogen inhibitors and slow release products 4-Rs of Nutrient Stewardship The Right Nutrient Removal by Crop lbs Acre N P 2 O 5 K 2 O S Corn Bu Acre Yield Grain Stalks Total Soybeans - 70 Bu Acre Yield Grain Stover Total Wheat - 80 Bu Acre Yield Grain Straw Total Source: IPNI for U.S. Northcentral Region
7 Increasing efficacy of plant nutrient use in the United States U.S. Plant Nutrient Use on Corn The efficacy of plant nutrient use has increased significantly in the United States during the last few decades. U.S. Department of Agriculture data show that the three-year average U.S. corn yield nearly doubled from 79 bushels per acre in 1970 to 157 bushels per acre in Yet primary nutrient application rates remained flat at 230 pounds per acre during the same period. Nitrogen use per bushel of corn harvested declined one-third or from about 1.45 pounds in 1970 to less than 0.9 pounds in Phosphorus use per bushel of corn dropped more than 60% from about 0.7 pounds in 1970 to roughly 0.3 pounds in Potassium use per bushel of corn also dropped more than 60% from about 0.8 pounds in 1970 to 0.3 pounds in Manure usage has increased during this period, but U.S. farmers today are harvesting twice as much corn per acre with the same amount of commercial plant nutrients as used in 1970! 7

8 Critical Role of Plant Nutrients Plant nutrients are responsible for 40% to 60% of crop yields Vital role in meeting the challenge of feeding more than nine billion people in 2050 No one understood this challenge better or communicated it more effectively than Dr. Norman Borlaug. Borlaug, widely acclaimed as the Father of the Green Revolution, developed disease resistant and high yielding wheat varieties that are credited with saving hundreds of millions of people from starvation in the 1960s and 1970s. India s wheat output doubled from 12 million tonnes in 1965 to 24 million tonnes in Veterans of the Green Revolution joyfully recount how the country frequently ran out of jute bags to store and transport the bountiful harvests. Dr. Norman Borlaug Borlaug, the strong farm boy (and accomplished wrestler) from Cresco, Iowa and a proud graduate of the University of Minnesota, won the Nobel Peace Prize in 1970 for the development of these new varieties as well as his tireless efforts to work with farmers to gain their acceptance. Borlaug was driven by his strong conviction that it is impossible to build a peaceful world on empty stomachs. Farmers can feed the world. Better seeds and fertilizer, not romantic myths, will let them do it. Dr. Norman Borlaug Wall Street Journal July 30, 2009 This is a basic problem to feed 6.6 billion people. Without chemical fertilizer, forget it. The game is over. Dr. Norman Borlaug New York Times April 30,
9 Primary Crop Nutrients Overview Nitrogen (N) Production process: highly energy intensive Haber-Bosch process to synthesize ammonia Key input: hydrocarbon feed stock (two-thirds produced from natural gas) Global agricultural use: ~110 million tonnes N in 2012 or more than 300 million tonnes of product Main products Anhydrous ammonia (82% N gas at normal temperatures and pressures) Urea-ammonium nitrate (UAN) solution (28%-32% N liquid) Urea (46% N solid) Ammonium nitrate (34% N solid) Ammonium sulphate (21% N solid) Ammonium phosphate (DAP and MAP) products (10%-18% N solid) Leading producers: China, Russia, India, Mideast, Caribbean, North America, Indonesia N Use by Product N Use by Crop SOURCE: IFA, FERTECON AND MOSAIC 9
10 10 NH 3
11 Primary Crop Nutrients Overview Phosphate (P) The production process - making phosphorus water soluble Key inputs: phosphate rock mineral ore, sulphur and ammonia Global agricultural use: ~41 million tonnes P 2 O 5 in 2012 or more than 120 million tonnes of product Main products Diammonium phosphate (DAP) (46% P 2 O 5 solid) Monoammonium phosphate (MAP) (52% P 2 O 5 solid) Triple superphosphate (TSP) (46% P 2 O 5 solid) Single superphosphate (SSP) (18%-22% P 2 O 5 solid) NPK and NP compounds (% P 2 O 5 varies both solid and liquid) Leading producers: China, USA, Morocco/North Africa, Russia P 2 O 5 Use by Product P 2 O 5 Use by Crop SOURCE: IFA, FERTECON AND MOSAIC 11
12 12
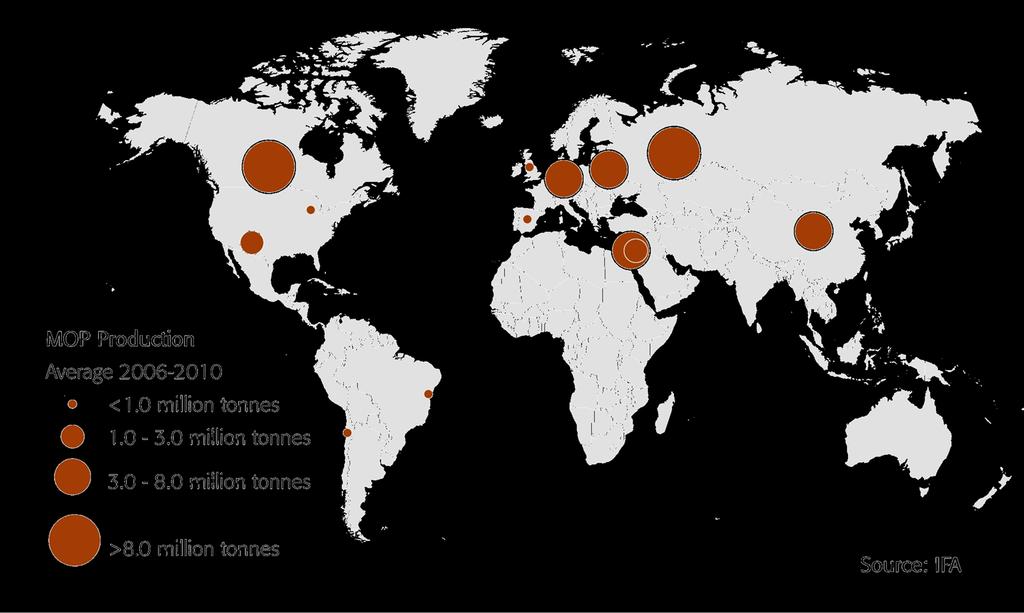
13 Primary Crop Nutrients Overview Potash (K) Production process: simple separation processes Key inputs: potash mineral ore (sylvinite, carnallite and langbeinite) Conventional underground mines (1000+ meters deep) Solution mines Salt lake brines (e.g. Dead Sea, Qinghai and Great Salt Lake) Global agricultural use: ~28 million tonnes K 2 O in 2012 or more than 60 million tonnes product Main products Potassium chloride or muriate of potash (MOP) (60-62% K 2 O solid) Potassium sulphate or sulphate of potash (SOP) (50% K 2 O solid) Potassium-magnesium-sulphate (22% K 2 O solid) Leading producers: Canada, Russia, Belarus, Germany, Israel, Jordan K 2 O Use by Product K 2 O Use by Crop SOURCE: IFA, FERTECON AND MOSAIC 13
14 14
15 Crop Nutrients Markets

16 Crop nutrient markets A separate and unique market for each nutrient Common demand drivers Different supply drivers Natural resources required Other raw materials Location of resources Technological processes Market characteristics Global Commodity based Cyclical Long and large supply chain
17 Market Characteristics Global Highly traded commodities By a large number of successful trading companies World Fertilizer and Grain Trade (million tonnes) International Trade as a World Use Trade Percent of Use Coarse Grain 1, % Wheat % Rice % Total Grain 2, % Nitrogen (N) % Phosphate (P 2 O 5 ) % Potash (K 2 O) % Total Nutrients % Source: USDA, IFA, Fertecon, Mosaic Five Year Averages 2006/ /12 Note: Nitrogen includes ammonia, urea, ammonium nitrate, ammonium sulphate and calcium ammonium nitrate. Phosphate includes rock, phosphoric acid, DAP, MAP, TSP, SSP. NPKs are not included. 17
18 Market Characteristics Cyclical But the cycle has shifted up Price Price Required for New Capacity When demand exceeds supply price increases above this level to attract capital into this sector Higher operating and capital costs are pushing up this ceiling Market prices determined by supply and demand Marginal Cost of Efficient Producers When supply exceeds demand price drops to or below this floor to force high cost capacity to shut down Increases in raw materials and energy costs are pushing up this floor 18 Old Scenario $2.00-$2.50 bu Corn $10-$20 bbl Oil $2.00 MM Btu Gas $30-$40 MT Rock $1000 MT K Capacity Change New Scenario $5-$7 bu Corn $ bbl Oil $3-$5 MM Btu Gas $100-$200 MT Rock $2000+ MT K Capacity Time
19 Market Characteristics Long and large supply chain Production Typically located near the source of the natural resource (i.e. long pipeline) Operates Farm application One or two short application windows (i.e. large pipeline) Pipeline flow Regular flow required to Have product in place when farmers want to apply it Keep mines and plants running Flow impacted by Weather Price expectations Supply/demand changes 19
20 The Phosphate Market and Industry
21 Global phosphate product shipments Mil Tonnes DAP/MAP/MES/TSP Global Phosphate Product Shipments Source: Fertecon and Mosaic Source: Fertecon, IFA and Mosaic F 13F 21
22 Global phosphate product production (DAP/MAP/TSP) Top 10 Producing Countries
23 Phosphate product trade Top 10 Exporting Countries 2011 Top 10 Importing Countries
24 Transition of the Chinese phosphate industry Mil Tonnes China Net Processed Phosphate Exports 8.0 Source: Fertecon, IFA, China Customs and Mosaic
25 Phosphate rock reserves and resources Billion Tonnes USGS (2011) Reserves 65 Reserve Estimates More than 350 years of production at current rates IFDC Preliminary Reserve Estimate (Product) 60 Reserve and Resource Estimates More than 1,750 years of production at current rates IFDC Preliminary Resource Estimate Source: USGS and IFDC 25
26 Global phosphate rock production Top 10 Producing Countries
27 Phosphate rock trade Top 10 Exporting Countries 2011 Phosphate Rock Trade Top 10 Importing Countries
28 Global phosphoric acid production Top 10 Producing Countries
29 Phosphoric acid trade Top 10 Exporting Countries 2011 Phosphoric Acid Trade Top 10 Importing Countries
30 The Potash Market and Industry

31 Global potash reserves UNIT: MIL TONNES K 2 O SOURCE: USGS 31
32 Global potash shipments (MOP) Mil Tonnes World Muriate of Potash Shipments KCl 70 Source: Fertecon and Mosaic F 13F 32
33 Global potash production 33
34 Potash trade Top 10 Exporting Countries 2011 Top 10 Importing Countries
35 Impact of break-up of the former Soviet Union 1000 Tonne KCl 14,000 12,000 10,000 8,000 6,000 4,000 2, Source: Fertecon Data File August 2012 Former Soviet Union Potash Domestic Shipments 1000 Tonne KCl 18,000 16,000 14,000 12,000 10,000 8,000 6,000 4,000 2, Source: Fertecon Data File August 2012 Former Soviet Union Potash Exports 35
36 The Nitrogen Market and Industry
37 Global urea production Source: IFA Source: IFA 37
38 Urea trade Top 10 Exporting Countries 2010 Mil Tonnes Urea 40 Percent of Total 20% 30 15% % 5% Top 10 Importing Countries Rest of the World China China % of World 0% Source: IFA 38 Source: IFA
39 U.S. nitrogen industry revival $ MM Btu Source: Fertecon September 2012 Natural Gas Costs in Key Nitrogen Producing Regions Estimated Annual Average Price Mil Tons N 15.0 Source: USDC, AAPFCO and Mosaic 12.0 U.S. Nitrogen Use Percent 100% 80% % % % Mideast Russia Ukraine United States Europe (formula) Fertilizer Year Ending June 30 0% US Nitrogen Use Net Nitrogen Imports Imports % of Use 39

40 Comments on Forecasting
41 Game Changers Forecasting = Developing and handicapping plausible scenarios Uncontrollable and Unpredictable Variables Macroeconomic Environment Political Change Government Policies Technical Change Corporate Strategies Social Change Key Crop Nutrient Market Drivers Income Growth Exchange Rates Ag Commodity Prices Farm Profitability Energy Costs Raw Materials Costs New Project Development Natural Disasters New Industry Entrants 41 Consumer Tastes/Preferences Strategic initiatives = Placing bets on highest-handicapped scenarios
42 What are the game changers today? Top 5 Game Changers Government Policy: China develops its own N&P industries 2. Political Change: The break-up of the former Soviet Union 3. Government Policy: USA builds a large ethanol industry 4. Government Policy: Indian fertilizer subsidy underpins demand growth 5. Technical Change: Hydraulic fracturing lowers U.S. natural gas prices Potential Game Changers Today 1. Macroeconomic Environment: Slower growth in China and India 2. Political Change: Political unrest in key producing or consuming countries 3. Government Policies: Political support for biofuels 4. Government Policies: New NPK capacity to diversify economies 5. Technical Change: Fracking ushers in a new era of cheap energy 6. Technical Change: New seed varieties require innovative products 7. Corporate Strategies: Leading mining companies enter the P&K industries 42
43 THANK YOU! Chemicals for the Non-Chemist Plant Nutrients and Plant Nutrient Markets Citi Basic Materials Symposium New York, NY November 26, 2012 Dr. Michael R. Rahm Vice President Market and Strategic Analysis The Mosaic Company