Addressing socio-ecological problems in the coastal zone of Southeast Asia using system dynamics
|
|
|
- Justin Greer
- 5 years ago
- Views:
Transcription

1 Addressing socioecological problems in the coastal zone of Southeast Asia using system dynamics
2 Background Coastal ecosystems provide many services to coastal communities These include: provisioning (e.g. food and fuel), regulating (e.g. assimilation of pollutants), supporting (e.g. nutrient cycling) and cultural (e.g. recreational and tourism services)
3 Background The integrity of coastal ecosystems and their services are in decline in SE Asia This is mainly due to rapid population growth and development, which has caused increased demand on local resources, changed catchment landuse and increasing waste production
4 Background The decline in coastal ecosystems has caused a number of problems and traps that threaten the wellbeing and livelihoods of coastal communities These are the result of interactions between ecosystems, economies and societies, making them socioecological problems
5 What are we doing? We are applying systems thinking and system dynamics to understand how communities currently interact with coastal ecosystems and how these interactions have led to socioecological problems We are working in El Nido, The Philippines, and Selayar, Indonesia

6 El Nido, Palawan, The Philippines

7

8 Selayar, South West Sulawesi, Indonesia

9
10 Methods Steps Activities El Nido Selayar Problem identification & articulation Scoping visit Planning workshop System specification (dynamic hypothesis) Creation of core modelling teams FGD training FGD round 1 FGD round 2 Simulation modelling Model specification Underway Underway Data collation Underway Underway Model testing To be done To be done Policy design and evaluation FGD round 3 To be done To be done Decision support tool delivery Tool design To be done To be done Tool development To be done To be done
11 Problem Articulation
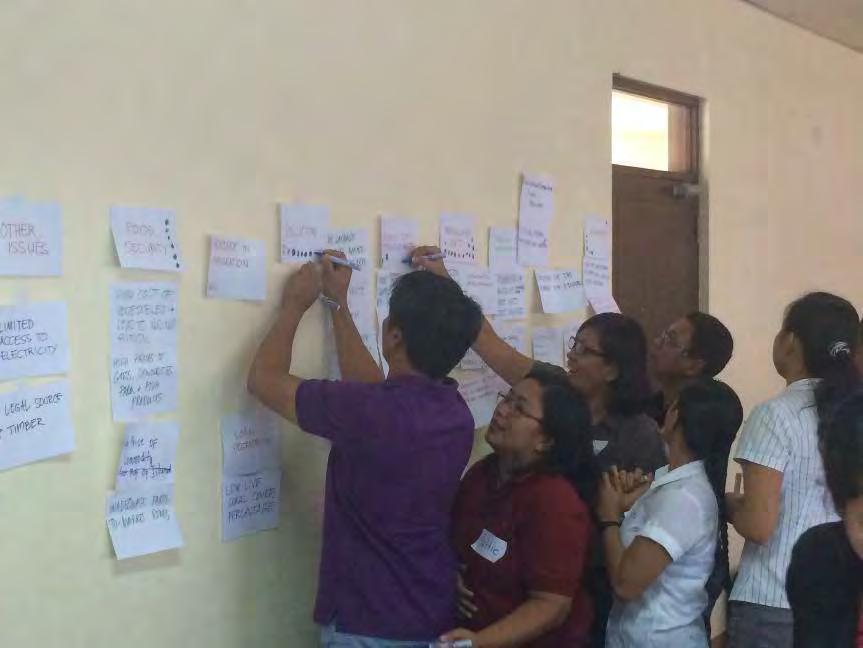
12 Problem Articulation
13 Focus Problems El Nido, The Philippines Fish catch decline Food insecurity Mangrove loss Water pollution Core Modelling Team Palawan State University (PSU) The El Nido Foundation (ENF) Palawan Council for Sustainable Development (PCSD) Palawan State University (PSU) Selayar, Indonesia Coral reef fisheries decline Core Modelling Team Bogor Agricultural University (IPB)
14 Examples of the Problems El Nido Fish Catch: The Municipal Agriculturist s Office (MAO) of El Nido reported a 58% decrease in fish catch from 2010 to The greatest decrease was in 2014 when the fish catch was only 60% of that in 2013.

15 Water Pollution: A former mangrove area in Cabigsing, Buena Suerta, El Nido

16 El Nido beach tests positive for coliform: Philippines Inquirer ( Water Pollution: Raw waste water drainage to estuary, El Nido. In 2014 laboratory analysis of water samples taken from Bacuit Bay found that biochemical oxygen demand was at levels 3,000 percent higher than what the Clean Air Act allows. The water was also found to be contaminated with faecal coliforms, indicating contamination from human and animal waste.

17 Charcoal kiln within the mangrove forest at New Ibajay, El Nido: 60 to 70% of the El Nido community is dependent on charcoal for fuel m 2 of mangroves are cleared per month to feed one charcoal kiln. Other causes of mangrove loss include land reclamation for residential and industrial buildings and the harvesting of mangroves for timber.

18 Local produce market, El Nido: A survey undertaken by the Palawan State University in 2013 found that approximately 10 percent of the sampled households in El Nido experienced hunger

19 Local fish market, Selayar
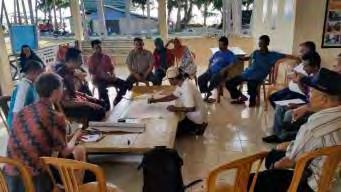
20 System Specification FGD Round One: The purpose is to capture the mental models of participants FGD Round Two: The purpose is mental model update, review and learning from the mental models of others SESAMME App and a script was used to capture information in these FGDs
")
21 IPB (Coral Reef Fisheries Decline) September 2015


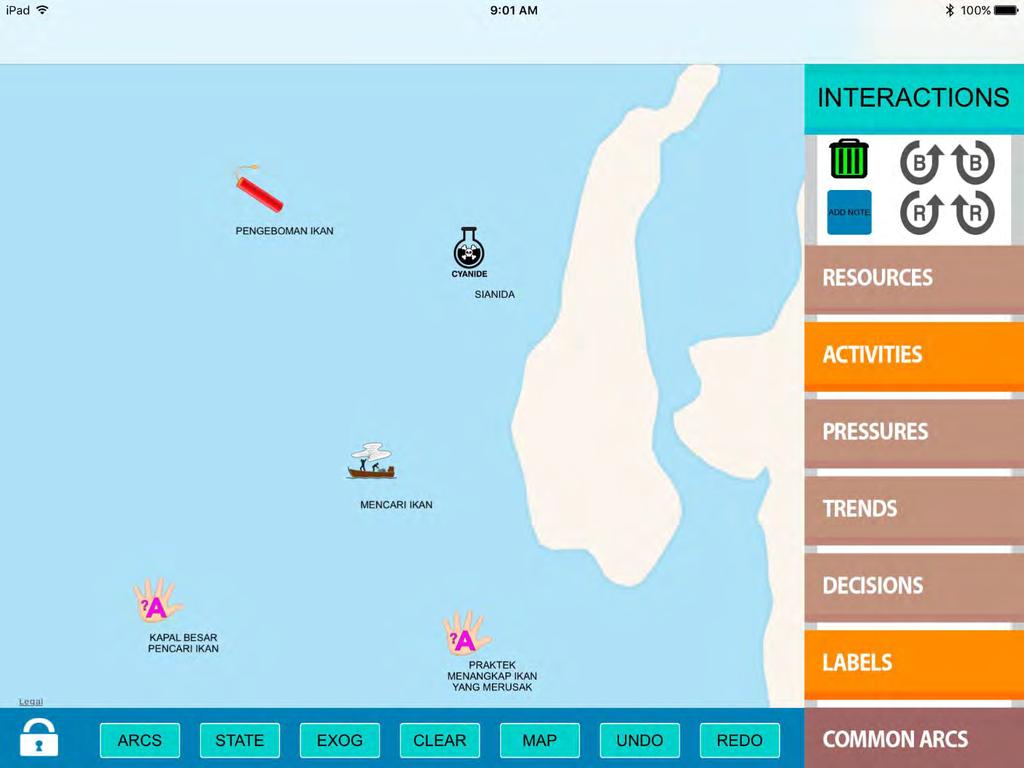
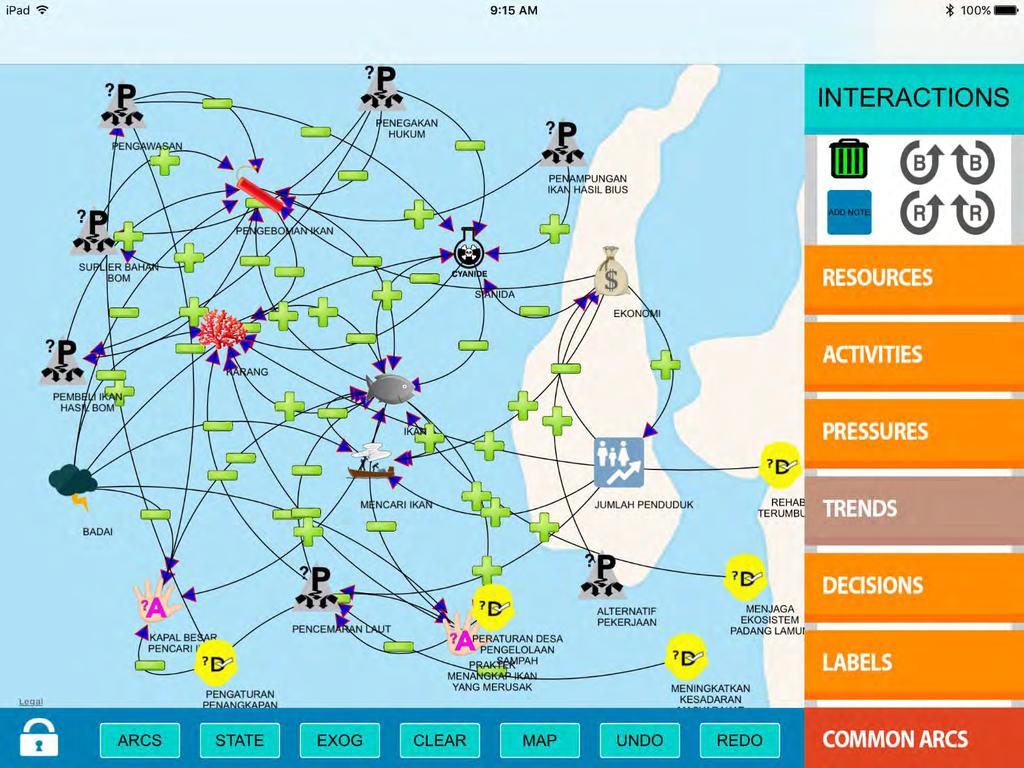
22 SESAMME Drag and Drop icons (satellite view) Icons for current component (Activities)


23


24

25

26


27
28

29

30
31 How many FGDs did we do? El Nido, The Philippines Number of FGDs FGD Round One 88 FGD Round Two 44 Participants 1000 Selayar, Indonesia Number of FGDs FGD Round One 17 FGD Round Two 17 Participants 300

32
33
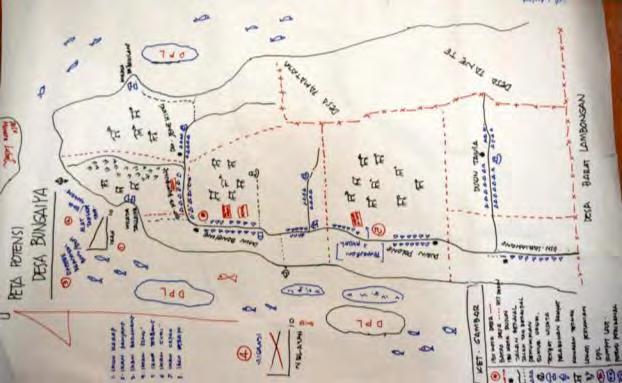
34 SESAMME map analysis used to inform dynamic hypothesis Simplified dynamic hypothesis for reef fisheries decline in Selayar human population demand of fish buyer for bombed fish <alternative livelihood> <fish price> education level income traditional fishing fish bombing <income> bomb supplier alternative livelihood coral fish sea grass coral poison fishing big vessel fishing surveillance <traditional fishing> law enforcement <education level> compressor fishing <education level> fish price fish caught buyer for poisoned fish poison supplier <education level> <income> <income> <alternative livelihood> <fish price> <big vessel fishing> <fish bombing> <poison fishing> <traditional fishing>
35 Loops perpetuating destructive fishing buyer for bombed fish R fish bombing R bomb supplier buyer for poisoned fish R poison fishing R poison supplier Destructive fishing is supported by a poison and bomb fish market and supply chain
36 Loops perpetuating destructive fishing fish bombing coral education level R2 R1 alternative livelihood fish price R3 coral fish income fish caught Destructive fishing reduces fish habitat and fish caught, leading to a debt and education trap
37 Loops perpetuating overfishing traditional fishing education level B3 B2 alternative livelihood fish price fish caught B1 coral fish income Balancing loops form a figure of 8 reinforcing loop, meaning that overfishing can lead to a debt and education trap
38 Ecosystem service impacts coral fish bombing R1 coral fish B1 sea grass fish caught traditional fishing poison fishing Destructive fishing reduces fish and fish habitat, overfishing reduces fish and indirectly reduces fish habitat because herbivorous fish maintain coral health by grazing algae
39 Important pressures alternative livelihood traditional fishing fish bombing demand of fish fish price law enforcement surveillance human population poison fishing Population growth is driving the increasing demand for fish for subsistence and sale to market. Lack of law enforcement and surveillance allows destructive fishing to continue. Lack of alternative livelihoods means that poor households have no alternative but to fish.
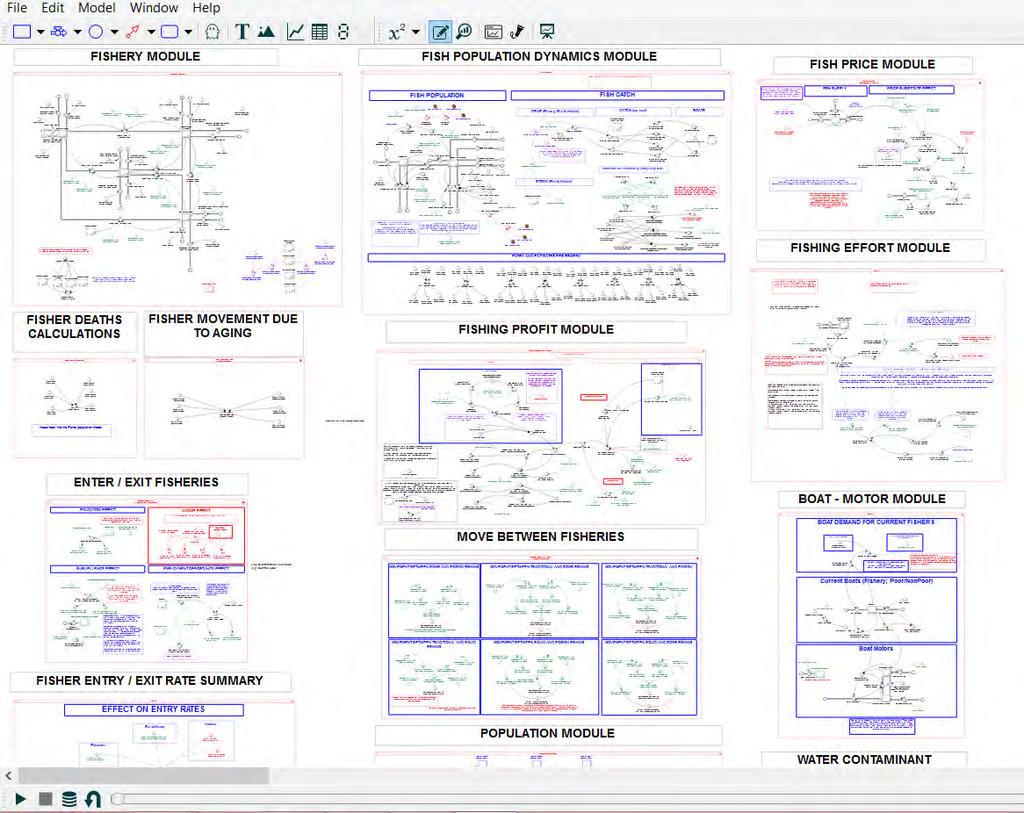
40 Simulation Modelling The purpose is to capture the main themes (resources, activities, pressures) within the dynamic hypotheses for each socioecological problem and the interactions between them Simulation models are built in Stella FGD Round Three: The purpose is scenario analysis and policy testing using the simulation model
41 Simulation Modelling Models cover: a. Catchment runoff (sediment, nutrients) b. Crop and livestock production c. Fish populations (herbivores, predators, squid) d. Fishing (legal and illegal, entry, exit and effort) e. Coastal habitats (reefs, mangroves, sea grass) f. Land use (crops, livestock and urban) g. Population (domestic, tourists) h. Supply, demand and price (fish, crops, livestock) i. Household net income (from fishing, cropping and livestock production) j. Waste production (septic tanks, stormwater) k. Water use (domestic, crops, livestock) l. Water quality (phytoplankton [algal blooms], suspended sediment, nutrients)
42
43 Decision Support Tool Delivery Smart phones are more affordable and accessible than computers in most developing countries Managers and policy makers do not use system dynamics modelling software and are not trained in stock and flow modelling Managers and policy makers are often not experienced or trained in what they are managing
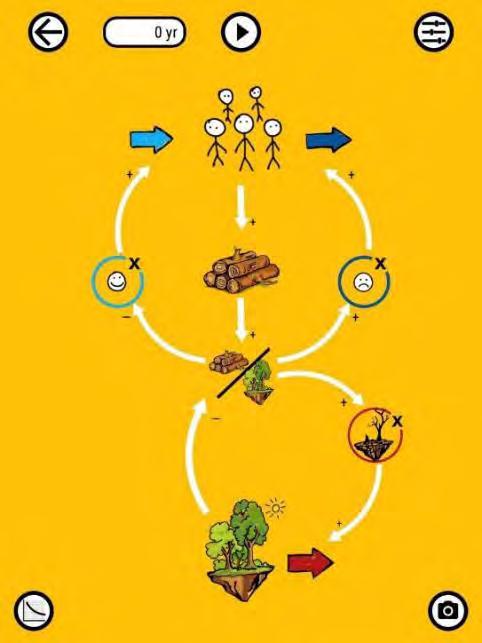
44 Decision Support Tool Delivery We will develop our decision support tool as an App for smart phones and tablets, called SYSTORY (system storytelling tool) It will have storytelling and scenario analysis capability The storytelling will support learning The scenario analysis will support decision making
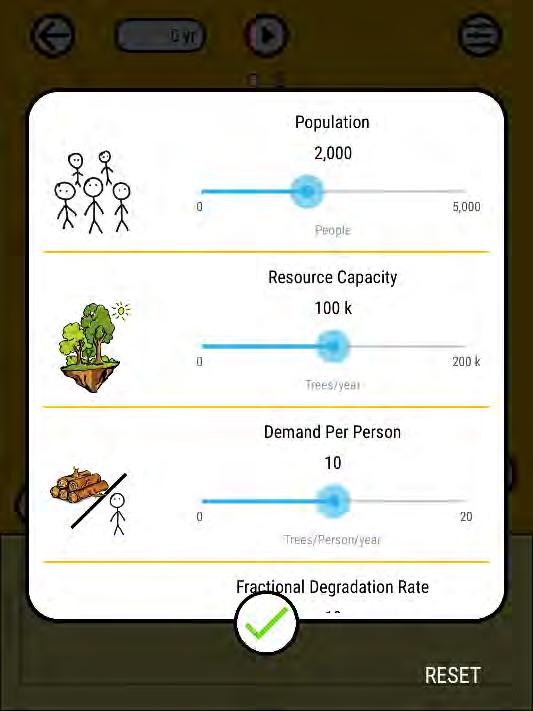
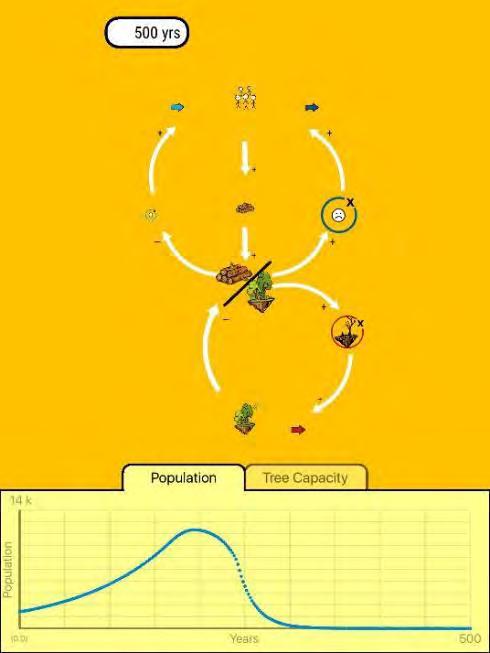
45 Decision Support Tool Delivery The storytelling interface will be split into chapters (one chapter for each focus problem) and each chapter will guide users through a cartoon style description of the system The scenario analysis interface will allow users to open a set of controls for scenario specification and view the results of any scenario as graphs over time

46
47
48
49

50 Thank You