Regional Food Systems
|
|
|
- Allison Woods
- 5 years ago
- Views:
Transcription

1 Regional Food Systems Becca Jablonski Assistant Professor and Food Systems Extension Economist Dept. of Agricultural and Resource Economics, Colorado State University 2017 Policy Summit on Housing, Human Capital, and Inequality June 23, 2017 Credit: Urban Design Lab, Columbia University

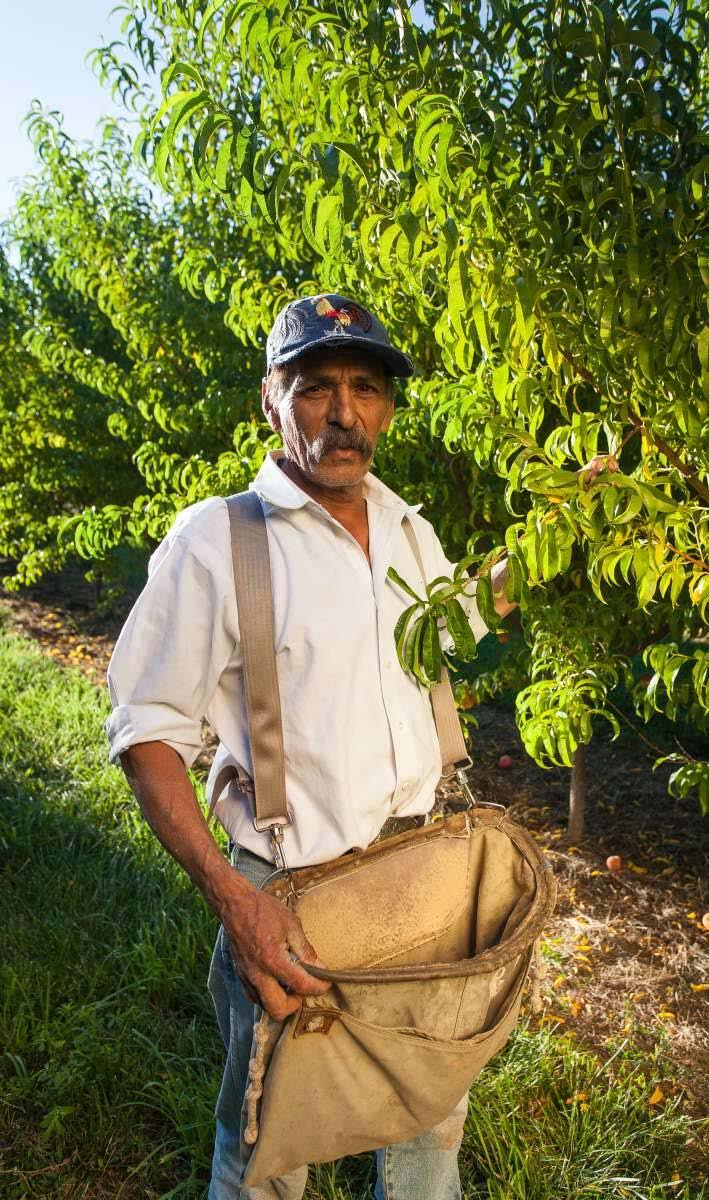
2 FARM VIABILITY

3 Principle Operators on Farm Less than 10 Years, Percent Change 2007 to 2012 (USDA NASS)


4 New pricing reports Led by Martha Sullins, Partner with Glenda Mostek Newly funded by USDA AMS
5 Ground beef prices at farmers markets not impacted Price/lb $14.00 by commodity market prices $12.00 $10.00 $8.00 $6.00 $4.00 $2.00 Retail ground beef Boulder Old Town Golden $0.00 5/1/2015 6/1/2015 7/1/2015 8/1/2015 9/1/ /1/ /1/2015 Non-significant, but negative relationship between USDA retail ground beef prices and Larimer (Old Town) market prices; r (20) = -.415, p<.05 Note: Weekly average retail ground beef prices from Sullins et al. 2016
6 Evidence that small scale operations benefit from local food sales Source: Vogel, Jablonski, and Schmit 2016
7 Local food farms at all scales with positive return on assets *Quartile 4 is the most profitable 1.0 By Sales Class $1K to $75 K $75K to $350K $350K to $1M $1M and higher Quartile 1 Quartile 2 Quartile 3 Quartile 4 Source: USDA ARMS 2013; analysis by Thilmany McFadden, Bauman and Jablonski
8 Farm using local markets dedicate a larger share of expenses to labor Nonlocalfood* 14% Alllocalfood* 28% 0% 10% 20% 30% 40% 50% 60% 70% 80% 90% 100% Purchased livestock Purchased feed Other variable expense Seeds and plants Fertilizer and Chemical Labor Fuel and oil Maintenance and repair Machine hire and custom work Utilities Other livestock related Source: USDA ARMS 2013; analysis by Jablonski, Bauman, and Thilmany McFadden


9 Regional Economic Development


10 Changes in Agriculture Change in ag over the last 30 years marked by innovation, diversification and new market opportunities but as ag practices are modernized to increase efficiencies, we require fewer and fewer farmers (USDA).


11 Brother s Custom Meats Craig, Colorado

12 Food Systems economic development is an opportunity to strengthen rural-urban linkages Denver Mayor Michael Hancock set the city s 2020 sustainability goals: Acquiring at least 25 percent of food purchases through Denver s municipal government supply chain from sources produced entirely within Colorado.

13 Economic Impacts of Local Foods When locally produced foods are substituted for imported items, stronger regional linkages are forged. If local foods production and consumption increase, there are economy-wide consequences. Money that previously left the economy stays and is allowed to multiply through. Module 5
14 Module 5
15 Direct Effect Module 5
16 Direct Effect Module 5
17 Direct Effect Indirect Effects Module 5

18 Direct Effect Indirect Effects Module 5
19 Direct Effect Indirect Effects Induced Effects Module 5


20 Direct Effect Indirect Effects Total Value of Local Economic Impact = direct + indirect + induced Induced Effects Module 5 Copyright Walt Unks/Journal


 *USDA ERS report http://www.ers.usda.")
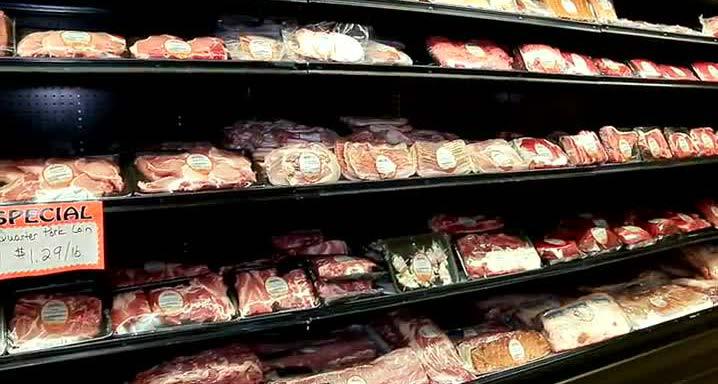
21 Farm Share of Local Food In mainstream supply chains, farmers retain ~17 cents of the consumer food dollar on average. Different story in local food systems In short supply chains, local producers received up to seven times the share of the retail price compared to mainstream chains. Food hubs often return between 75 to 85 percent of their wholesale sales revenues to their producers. Farm Share of U.S. Consumer Food Dollar (2012) *USDA ERS report **USDA AMS report
22 Words of caution in thinking about economic impacts Finite resources (e.g., land, consumers dollars, public dollars) so every decision involves a choice. Incorporated into economic impact assessments by estimating the net rather than the gross impact of changes in a local/regional food system. Can be on supply (production) or demand (consumer) side, or both. Module 6 & 7

23 Competition for Vendors at Farmers Markets Module 6 & 7 Source: Lohr and Diamond 2011
. Corn and soybean are the dominant crops in these states, and net impacts would occur from shifts to fruit and vegetable.")
24 Example: Fruit & Vegetable Production in Midwest Study estimates county-level fresh fruit and vegetable production potentials (supply side) and expected sales based on current population (demand side). Corn and soybean are the dominant crops in these states, and net impacts would occur from shifts to fruit and vegetable. Land needed to satisfy regional fruit and vegetable demand is small, production consequences would be nominal. Module 6 & 7 Source: Swenson, D The Regional Economic Development Potential and Constraints to Local Foods Development in the Midwest. Iowa State University

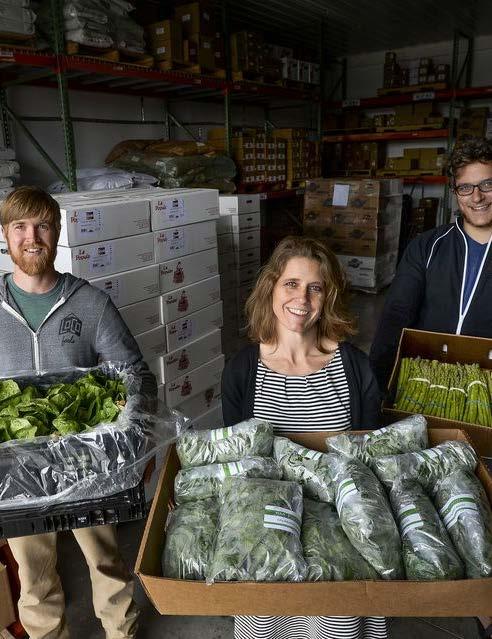
25 Example Economic Impact Assessment Food Hub Established in 1989, LLC Over $6 million in sales, 32 employees Delivery (mostly) throughout NYS 9 vehicles (10 soon) Over 3,400 product listings Regional Access 25,000 sq ft warehouse, Trumansburg, NY Beverages, breads, cereals, flour, meats, produce, prepared foods, grains, fruits & vegetables, etc. Purchases from over 100 NYS farmers & 65 specialty processors Over 600 customers Individual households, freight, restaurants, institutions, distributors, buying clubs, retailers, manufacturers, bakery

26 Food Hubs may increase market access for mid-scale farms $3,000,000 $2,500,000 $2,000,000 RA-facilitated Sales $1,500,000 $1,000,000 Non-RA Sales $500,000 $0 Farm sales facilitated by food hub, as a proportion of total farm sales

27 Example Economic Impact Assessment Food Hub Surveyed 305 of Regional Access customers 49% purchased less from other sources due to purchases from RA Average reduction >23% Opportunity Cost associated with $1 increase in final demand for food hub sector ~ $0.11 Reduced Total Output Multiplier from 1.82 to 1.63 (>10%) Module 6 & 7 Source: Jablonski, Schmit, and Kay 2016
28 Example Economic Impact Assessment Food Hub Impacted Industry Sectors $0.20 (indirect and induced impacts only) Indirect and Induced Effects per $1 increase in final demand $0.15 $0.10 $0.05 $- $(0.05) $(0.10) $(0.15) food hub farm food sold-nonfarm real estate and rental retail storesgasoline stations health and social services insurance carriers retail trade automotive equipment rental Industry Sectors finance and insurance other farm utilities nondepository credit wholesale trade Module 5 indirect effects (Total = $0.42) induced effects (Total = $0.22) Source: Jablonski, Schmit, and Kay 2016
29 Other Economic Impacts Businesses near farmers markets reported higher sales on market days Additional sales found to directly support the businesses themselves, but also generated extra tax revenue for the communities in which the markets were located. Farmers markets increase property values in the market district
30 Evaluating long-term economic impacts more difficult, but potentially where more important impacts lie! Farmers markets as business incubators by providing the infrastructure necessary to build skills and gain business experience. Regular interactions can generate and circulate knowledge that vendors might use to develop new products and creative ways of marketing them. Sales income may be less important than the skills and business experience developed through participation in farmers markets.
31 Farm got idea(s) for new product and/or marketing technique directly through Greenmarket 40% 35% 30% 25% 20% 15% 10% 5% 0% None Some A lot Summary results of Greenmarket farm vendors (1 to 5, 1= none, 3= some, 5= a lot)

32 Human Capital 75% of farms made (or intend to make) changes to their farm business (ideas for a new product and/or marketing technique) based on these ideas. 45% of farms made these changes to product sold in both rural and urban markets. 82% reported that they shared ideas (or intend to) that they got through Greenmarkets with farmers in their home communities.
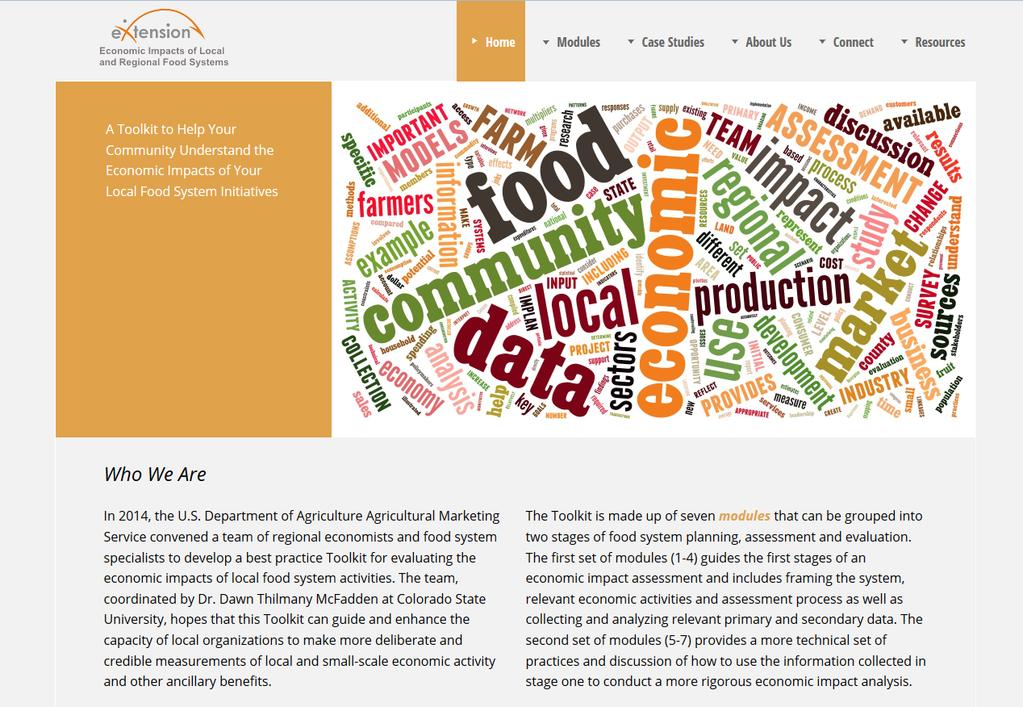
33 localfoodeconomics.com

34 Becca Jablonski Assistant Professor and Food Systems Extension Economist Department of Agricultural and Resource Economics Colorado State University B337 Clark Hall