THE REGION OF PEEL & TOWN OF CALEDON LAND EVALUATION AREA REVIEW (LEAR) STUDY. PUBLIC INFORMATION OPEN HOUSE April 7, 2015
|
|
|
- Brittney Small
- 5 years ago
- Views:
Transcription
 STUDY PUBLIC INFORMATION OPEN HOUSE April 7,")
1 THE REGION OF PEEL & TOWN OF CALEDON AREA REVIEW () STUDY PUBLIC INFORMATION OPEN HOUSE April 7, 2015
2 one two three four five six
3 Land Evaluation Area Review () Existing Prime Agricultural, Agricultural and Rural Areas in Region of Peel and Town of Caledon Official Plans Confirm accuracy of Prime Agriculture Area mapping as a basis to protect the best agricultural land from impacts of urban and rural non-farm uses Peel and Caledon Official Plans enable study to identify Prime Agricultural Areas 3
4 WHAT IS A? LE = Land Evaluation AR = Area Review is a Regional exercise - a comparative study of Agricultural Lands within the defined Study Area is a technical tool to assist municipalities in identifying Prime Agricultural Areas for protection in policy documents (i.e. Official Plan) Developed by OMAF, a is the Provincial Standard for the identification of Prime Agricultural Areas by Planning Authorities 4
5 WHAT DOES A DO? Ensures Prime Agricultural Area mapping in the Region of Peel and Town of Caledon Official Plans are consistent with Provincial Policy and Guidelines Protects high quality agricultural land for future food production Protects and enhances the agricultural economy Provides technical recommendations on refinement of Prime Agricultural Area in Caledon 5
6 WHAT DOES A NOT DO? does not compare lands within the Region to Agricultural lands outside of the Study Area (other Region) does not amend Official Plan land use designations. This is a separate process under the Planning Act studies are not undertaken to satisfy municipal comprehensive review requirements for settlement boundary expansions 6
7 OF A Evaluation Units Individual parcels are the Evaluation Units Land Evaluation Factor (50% Weighting) Based on CLI for Agriculture Topography considered in LE score Area Review Factors (50% Weighting) Fragmentation (12.5% of total score) % of Agricultural lands in production in the Evaluation Unit (12.5% of total score) % of land in agricultural production within one kilometre of the agricultural unit (12.5% of total score) Conflicting Land Uses (12.5% of total score) 7
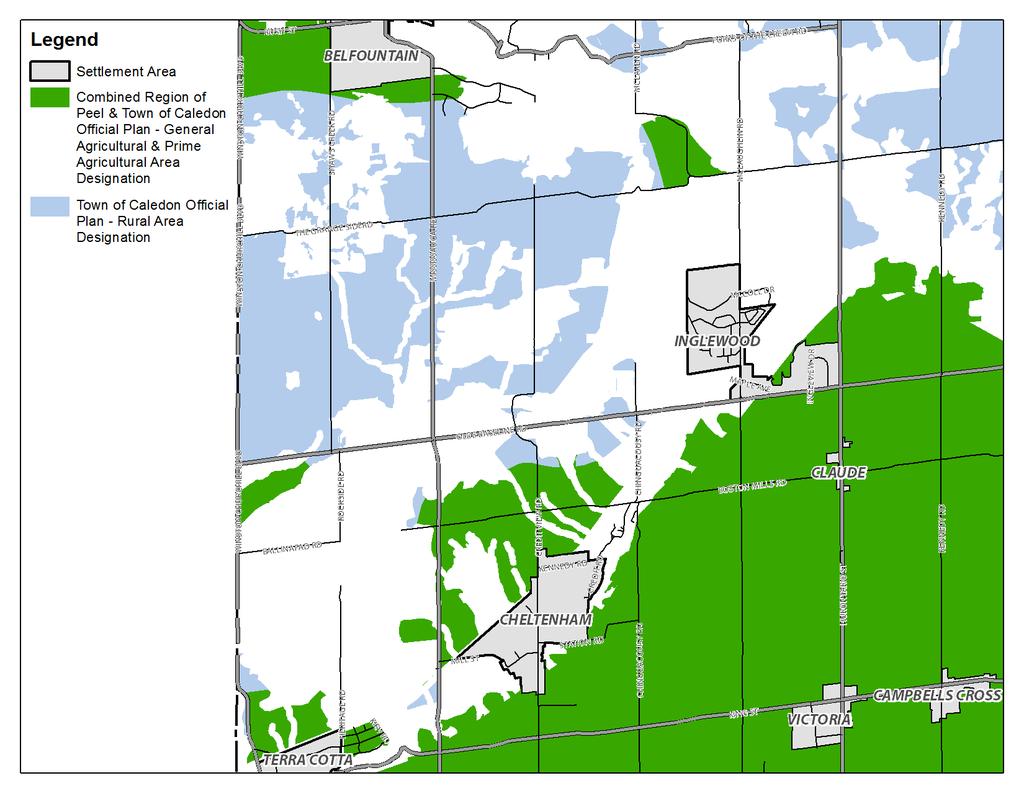
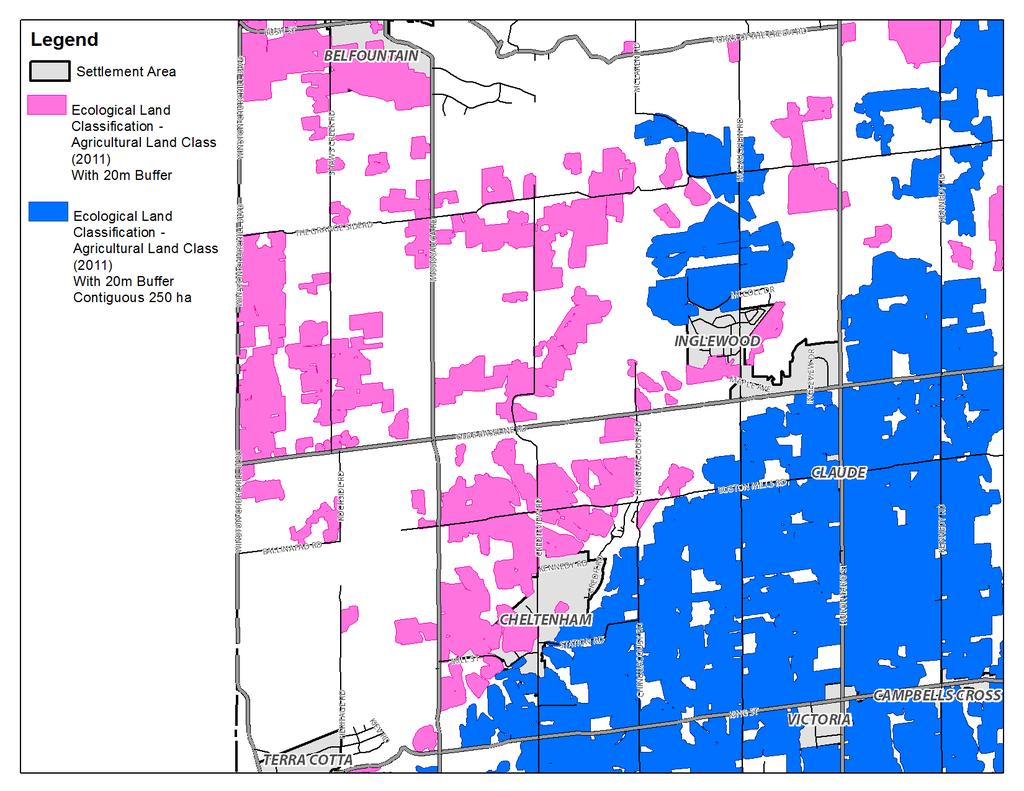
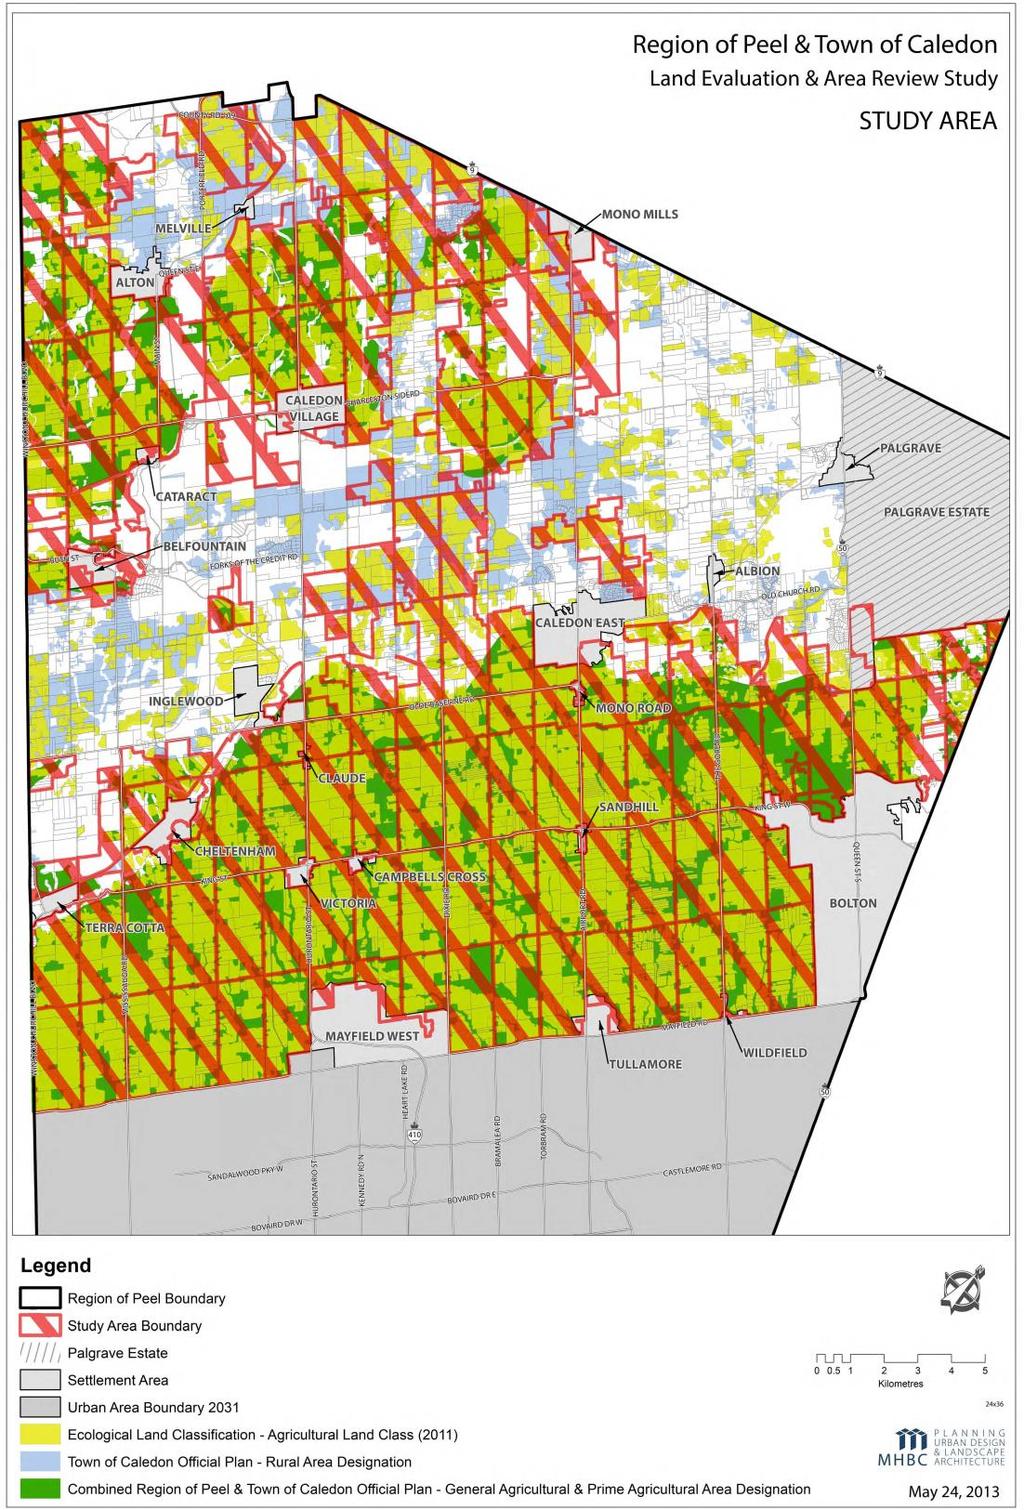
8 DETERMINATION OF The initial Study Area included all of those lands within the Town of Caledon that are designated Rural, General Agriculture and Prime Agriculture Area in the Town s Official Plan. It also included all of the lands designated as Prime Agricultural Area in the Region of Peel Official Plan. SCREENING FACTORS WERE THEN APPLIED WHICH INCLUDED: Lands in the Rural designation which do not comprise 250 contiguous hectares (618 acres) or greater and that were not classified Farmed by Ecological Land Classification (ELC) data were excluded from the final Study Area. Lands designated Rural which were classified as being farmed under the ELC and comprised 250 ha or larger of contiguous area were included in the Study Area. 8
9 DETERMINATION OF Lands currently designated Prime Agriculture or General Agriculture by the Region and/or Town Official Plans that are less than 20 ha (50 acres) of contiguous lands were excluded as they were considered small pockets of agricultural lands as opposed to part of a larger agricultural area. Lands within settlement areas and urban boundaries were excluded; and, Properties within the Study Area that had been previously evaluated and received site-specific planning approval to be removed from the Prime Agricultural Area were excluded. These properties will continue to retain their approved land use designation. 9

10
11 11
12 REVIEW COMMITTEE The guidelines directs the establishment of an agricultural advisory committee to guide the process. In 2013, the Peel Agricultural Advisory Working Group (PAAWG) was selected by the study team to be part of the Review Committee. The Review Committee also includes staff representatives from the Ontario Ministry of Agriculture & Food, Credit Valley Conservation and Toronto Region Conservation. The Review Committee provided input into the process as it refined the Study Area and selected and weighted the factors. The Review Committee assessed the scores and selected a recommended Threshold score and range. 12
13 FACTOR 50% of Total Score The Ontario Ministry of Agriculture and Food (OMAF) soils data set was applied to the Evaluation Units OMAF data was cross referenced with slope data to confirm Canada Land Inventory (CLI) rating The area and percent occurrence of each soil type inside each soil polygon within each Evaluation Unit was calculated and a score was assigned 13
14 FACTOR Evaluation Units based on existing property boundaries 14
15 FACTOR OMAF CLI information overlay for the same area Illustrates primary and secondary CLI for each soil polygon Illustrates percent occurrence of primary and secondary CLI 15
16 FACTOR Intersection of CLI and Evaluation Unit data 16


17 FACTOR Example of one Evaluation Unit intersected with OMAF CLI data Illustrates primary and secondary CLI data (with percent occurrence) 17
18 FACTOR 18
19 FACTORS 50% of Total Score Four Area Review (AR) Factors were selected by the Review Committee: o Fragmentation (12.5% of total score) o Percentage of Evaluation Unit in Agricultural Use (12.5% of total score) o Agricultural Uses within One Kilometre of Evaluation Unit (12.5% of total score) o Conflicting Land Uses (12.5% of total score) 19
20 AR FACTOR - FRAGMENTATION Each parcel was evaluated using a 300 metre buffer from the parcel. Using GIS the number of additional parcels within that 300 metre buffer excluding the evaluation unit itself was determined. The fragmentation number was then ranked according to the following table. # of Lots Score # of Lots Score < = 10 additional lots = lots = lots = lots = lots = lots = lots = lots = lots = lots = lots = lots = lots = lots = lots = lots = lots = lots = lots = 50 > = 29 lots = 0 20

21 FRAGMENTATION FACTOR SCORE & 21

22 AR FACTOR - % OF AGRICULTURAL S IN PRODUCTION IN THE UNIT Using ELC data that shows land in agricultural production (2010) each Evaluation Unit was provided a score based on the percentage of land within that Evaluation Unit that was being used for agriculture That percentage was then applied to a simple scale using the percentage as the score 1 Evaluation Unit 50% of Evaluation Unit not in agricultural production EXAMPLE: If 50% of the lot was used for agricultural purposes the score would be 50 50% of Evaluation Unit in agricultural production Score = 50 22
23 % OF AGRICULTURAL S IN PRODUCTION IN THE UNIT FACTOR SCORE & 23
24 AR FACTOR - % of Land in Agricultural Production Within One Kilometre of the Evaluation Unit Utilizing the same data as the previous factor, the GIS program was able to calculate the total area of land within one kilometre of the Evaluation Unit and then determine what proportion of that land was used for agriculture purposes The percentage of lands within one kilometre of the evaluation units was then applied to a perfect score of 100 resulting in the score for the individual Evaluation Unit Non Farmed land Evaluation Unit Farmed land 1 KM 24
25 % OF IN AGRICULTURAL PRODUCTION WITHIN ONE KILOMETRE OF THE UNIT FACTOR SCORE & 25
26 AR FACTOR - CONFLICTING USES Three potential conflicting land uses were selected by the Review Committee: Sensitive land uses (schools, places of worship and other institutional uses and parks) (33 % of 12.5% ) Proximity to urban areas (33% of 12.5% ) Proximity to major traffic arteries (33% of 12.5% ) The Evaluation Unit was scored based on its distance from an urban area utilizing a two kilometer radius as having no impact or a 0 score. The scores were then calculated based on the following distances: less than 500 metres metres to 1,000 metres 25% 1,001 metres to 1,500 metres 50% 1,501 to 2,000 metres 75% >2001 metres 100% 26
27 CONFLICTING USES MPAC Codes utilized to identify conflicting land uses were: 100 s represent Vacant Lands 200 s represent Agricultural Lands 300 s represent Residential Lands 400 s represent Commercial Lands 500 s represent Industrial Lands 600&700 s represent Government, Institutional & Recreation Of the MPAC Property codes, these are examples of the conflicting land uses: Cemeteries Municipal/Provincial Parks Bed & Breakfast Establishments Open Space Airports Commercial Uses Industrial Uses Schools 27
28 CONFLICTING USES FACTOR SCORE & 28
29 COMBINED FACTOR SCORE & 29
30 SCORE & 30
31 FORMS OF ANALYSIS Draft Recommended Jenks Natural Breaks Method Determines the best arrangement of values into different classes Seeks to reduce the variance within classes and to maximize the variance between classes. 31
32 FORMS OF ANALYSIS Equal Distribution Method Classification is divided equally (example: a range of 200 score for each class) 32
33 After each Evaluation Unit is given its score, a Threshold score and range is selected to identify a Recommended Prime Agricultural Area. Based on statistical analysis that considers the patterns and distributions of high scoring Evaluation Units. A recommended Threshold score and range of was tested by the study team and the Review Committee selected 535. The Threshold determines which lands may potentially be considered as a Recommended Prime Agricultural Area. Lands that score below the Threshold may retain or be considered for a General Agriculture or Rural Area land use designation. 33
34 SCORE 34
35 RECOMMENDED 35
36 STUDY & MDS REVIEW NEXT Public Comment Public comments are requested by May 10, Peel Agricultural Advisory Working Group and Review Committee will provide final recommendations to Region and Town Staff. Study STEPS Reports on a recommended Prime Agricultural Area will be given to Town and Region Councils. Any proposed changes to the Prime Agricultural Area will require separate and formal amendment process under the Planning Act to amend the Town and Region s Official Plans. Stay informed