WIDE-SCALE MODELLING OF WATER AND WATER AVAILABILITY WITH EARTH OBSERVATION/SATELLITE IMAGERY
|
|
|
- Marjorie Mae Harmon
- 5 years ago
- Views:
Transcription

1 WIDE-SCALE MODELLING OF WATER AND WATER AVAILABILITY WITH EARTH OBSERVATION/SATELLITE IMAGERY Ferreira F 1, Goudriaan R 2, Gibson LA 3, Jarmain C 4, Kemp JN 6, Mashimbye E 5, Münch Z 6, Pauw T 6, Stephenson G 6, Van Niekerk A 6 1 GeoTerra Image 2 eleaf Competence Center 3 CapeNature 4 Independent consultant & Centre for Geographical Analysis, Geography & Environmental Studies, Stellenbosch University (cjarmain@gmail.com) 5 Agricultural Research Council 6 Centre for Geographical Analysis, Geography & Environmental Studies, Stellenbosch University (avn@sun.ac.za) WRC-SA-GEO Workshop, Pretoria, 16 March 2016

2 Wordle.net WRC Project No. K5/2401//4 WIDE-SCALE MODELLING OF WATER AND WATER AVAILABILITY WITH EARTH OBSERVATION/SATELLITE IMAGERY
3 Aims (primary) 1. Update the total area used for irrigated agriculture in South Africa 2. Update the estimated total amount of water used by irrigated agriculture in South Africa 3. Quantify the water used by selected irrigated crops in selected areas 4. Demonstrate how water accounting can be employed to determine water use and water availability over large catchments

4 Aims (secondary) 1. Develop capacity in EO and other geospatial techniques, specifically those relating to water use estimations, land cover and crop type mapping, as well as water accounting 2. Engage with industry to stimulate participation, increase awareness of crop water use and availability and encourage adoption of new technologies and datasets
 Potential irrigable land 1 573 482ha 1994/5 actual irrigable land 1 589 884 ha (Nell&Van der Berg, 2001) Most recent estimates according to WARMS (Van der Stoep and Tylcoat):")
5 Knowledge do exist, but is outdated E.g. Area under irrigated agriculture Best estimate for 1996: 1.6m ha (Backberg, 2003) Potential irrigable land ha 1994/5 actual irrigable land ha (Nell&Van der Berg, 2001) Most recent estimates according to WARMS (Van der Stoep and Tylcoat): 2008: 2014: ha of registered irrigation area ha of annually irrigated area ha of registered irrigation area ha of annually irrigated area New technology and innovative ways exist Additional pressure on resources New developments and allocation Policy changes


6 2014/15 update Reference year Area under irrigated agriculture Water used by irrigated agriculture Water use (evapotranspiration) per main irrigated crop Water available for new developments and allocations


7 Generate new country wide data sets related to ET, land cover / land use and others Vegetation water use Land cover / land use


8 Build on from existing data sets & data basis *where available


9 Remote sensing datasets Use Innovative ways Data, models and frameworks GIS data sets ETLook MODIS / VIIRS ASCAT/MODIS-LST FEWS/TRMM Optical Thermal Active (microwave) Image classification methods MOD16 Available land cover / land use Water accounting +
10 PHASE 1 Existing maps & LANDSAT/SPOT imagery & Ancillary data Land cover map Land use map+ PHASE 2 PHASE 3 MODIS imagery ET dataset+ Irrigated area map+ Crop type maps*+ Rainfall data PHASE 4 Water used by irrigation Water used by specific crops* PHASE 5 * Dataset to be produced for selected areas only + Dataset to be used in water accounting (PHASE 5) Water Accounting Completion date: March 2018
11 Progress Land use & cover mapping Rainfall data collection ET (crop water use) modelling Impact of coarse resolution data ET-based irrigated area mapping

12 Focusing on ET data sets

13 The ETLook Model
 Land use/cover map (LULC) Latitude map Water")
14 ETLook: Static Inputs Digital Elevation Model (DEM) Land use/cover map (LULC) Latitude map Water mask


15 ETLook: SRTM DEM - Roughness - Solar radiation energy


16 ETLook: South African Land Cover Roughness - Stomatal Resistance - Light use efficiency GEOTERRAIMAGE 2015

17 ETLook: Daily Inputs NOAA & ARC Meteorological Station Data Air Temperature Relative Humidity Wind Satellite Based MODIS NDVI, Albedo & LST MSG Transmissivity ASCAT Topsoil moisture GSMaP Precipitation

18 ETLook: Meteorological Inputs 166 NOAA Stations 73 ARC Stations

19 ETLook: Meteorological Inputs Point measurements of Air Temperature and Relative Humidity and Wind interpolated using the Daymet model (Thornton et al., 1997) 27 december december 2014
 - Cloud cover data provided as part of the Cloud Physical Properties (CPP) algorithm from the Koninklijk Nederlands Meteorologisch Instituut")
20 ETLook: Atmospheric Transmissivity - Determines the fraction of solar radiation that reaches the Earth s surface and can be used for evapotranspiration - Gained from the MeteoSat Second Generation (MSG) - Cloud cover data provided as part of the Cloud Physical Properties (CPP) algorithm from the Koninklijk Nederlands Meteorologisch Instituut (KNMI)
 from JAXA - The hourly product was used and summed to daily")
21 ETLook: GSMaP Precipitation - Precipitation input data is used for the calculation of interception evaporation - Global Satellite Mapping of Precipitation in Near-Real- Time (GSMaP_NRT) from JAXA - The hourly product was used and summed to daily values
 between 0 to 100% total saturation - Main driver for evaporation calculation within ETLook - Daily product in global swaths covering the")
22 ETLook: ASCAT Top Soil Moisture - Soil moisture products based on the ASCAT sensor - Relative soil moisute content in the surface layer (~3 cm) between 0 to 100% total saturation - Main driver for evaporation calculation within ETLook - Daily product in global swaths covering the globe


23 ETLook: MODIS Inputs - M*D09GQ product used as NDVI input - M*D09GA product used as Albedo input - Composites are based on a 10-day weighted average
 - Calculate associated soil moisture stress (based on Scott et al.")
24 ETLook: Soil Moisture Stress - Based on MODIS Land Surface Temperature - Determine subsoil moisture content (based on Yang et al., 2015) - Calculate associated soil moisture stress (based on Scott et al., 2003) - Soil moisture stress maps are composited following the same methodology as NDVI and albedo maps - Essential input for calculation actual transpiration and actual biomass production

25 Some preliminary results related to water use FLYSAA

26 Annual PiMapping Data

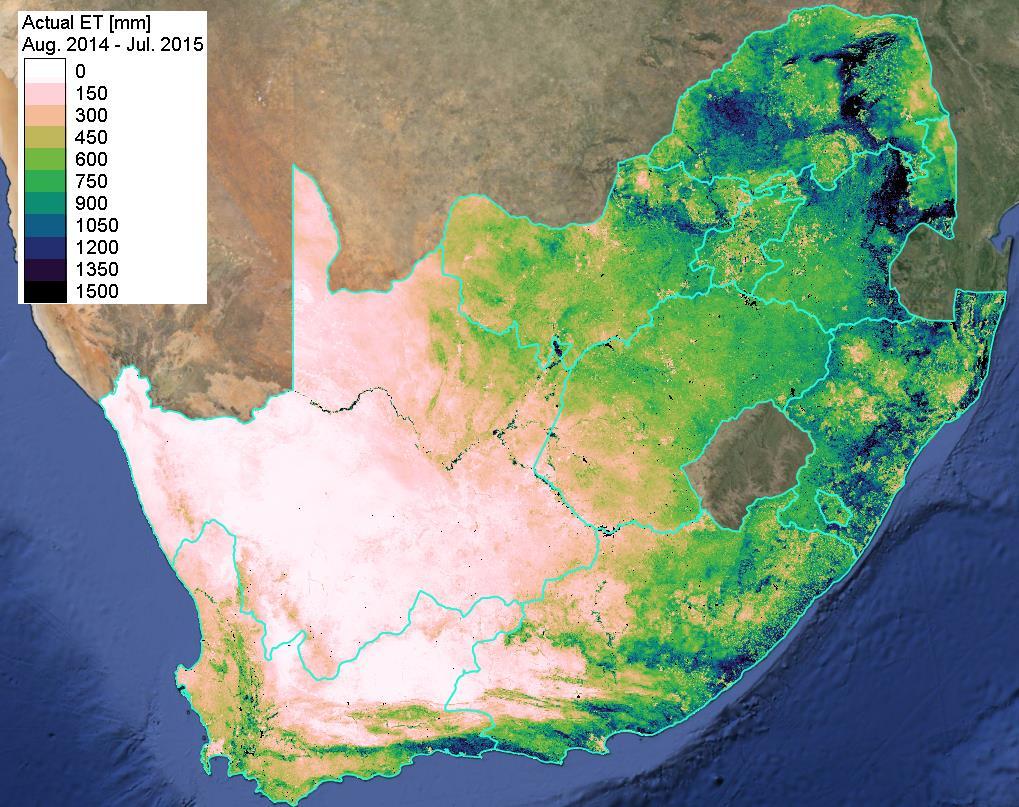
27 Monthly Actual Evapotranspiration (Etact)

28 ETact in the Western Cape


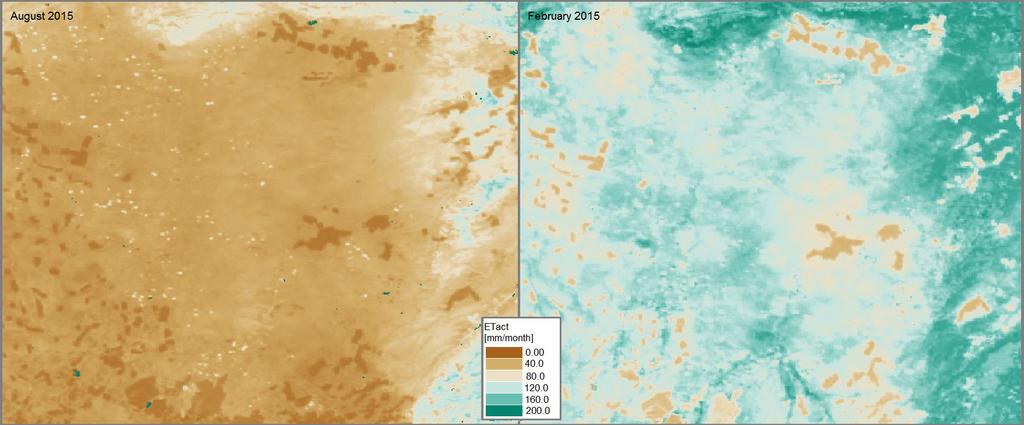
29 ETact: Examples of Irrigated Agriculture Fish river canyon Vaalharts Irrigation Scheme

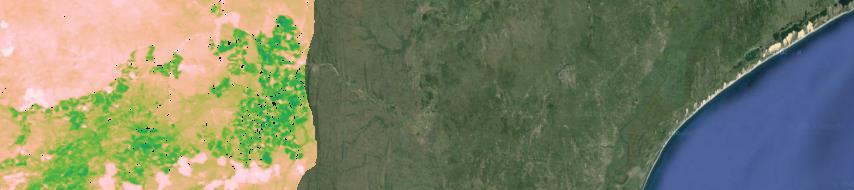

30 ETact: Irrigated Sugarcane Mpumalanga July 2015 January 2015

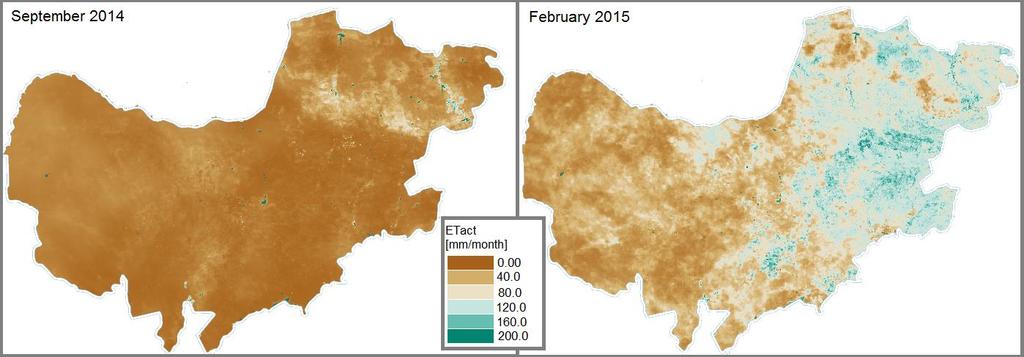
31 ETact: Rainfed Agriculture Limpopo Free State North West

32 Irrigated area map v1

33 Pieces of the puzzle coming together

34 Phase # Component # Year (subdivided into three-month terms) Associated deliverable number 2014 Q Q 3 2& Q Q Q Q 4 6& Q Q Q Q 4 9& Q Q Q Q 4 12& Land cover mapping 2 Land use mapping 2 1 Rainfall data collection 2 ET modelling using ETLook 3 Impact of coarse resolution data products 3 1 ET-based irrigated area mapping 2 Alternative methods for irrigated area mapping 3 Crop type mapping 4 1 Overall water used by irrigated agriculture 2 Estimation of water used by specific crops 5 Water accounting

35 To conclude Earth observation and geospatial data used to generate water related information Innovation New update on irrigated agricultural water use in South Africa for 2014/15 New knowledge Guidelines for repeating process Innovation


36 Thank you! Please contact us at WRC Project No. K5/2401//4 WIDE-SCALE MODELLING OF WATER AND WATER AVAILABILITY WITH EARTH OBSERVATION/SATELLITE IMAGERY