Women in Agriculture Farms, Operations, Demographics Iowa and Counties 2012 Census of Agriculture. Women Farm Operators in the Census of Agriculture
|
|
|
- Merry Foster
- 5 years ago
- Views:
Transcription

1 Community and Economic Development Indicators Program Sandra Charvat Burke Women in Agriculture, Operations, Demographics Iowa and Counties 2012 Census of Agriculture Women in the Census of Agriculture In 2012, women farm operators numbered 32,907 in Iowa. Additional characteristics, including age, primary occupation, work off the farm, and years of farm operation experience were reported for 32,167 of these women. Women were the principal operators for 7,108 farms (Figure 1; Tables 1, 3). This report provides information on women farm operators in Iowa and its counties and is based on the 2012 Census of Agriculture. The Census of Agriculture, conducted every five years by the U.S. Department of Agriculture, asks about the characteristics of farm operators in section 35 of the Census of Agriculture questionnaire (Figures 2, 3). Information on women farm operators is Figure 1. 3 Ways women counted in 2012 Census of Agriculture Total 32,907 Table 45 from Section 35, Question 1; Only know number count and Characteristics 32,167 Table 47 + from Section 35, Question 2b, all 3 columns more characteristics Operator 7,108 Table 46 + from Section 35, Question 2b, column 1 only many more characteristics Different amount and type data for each way counted

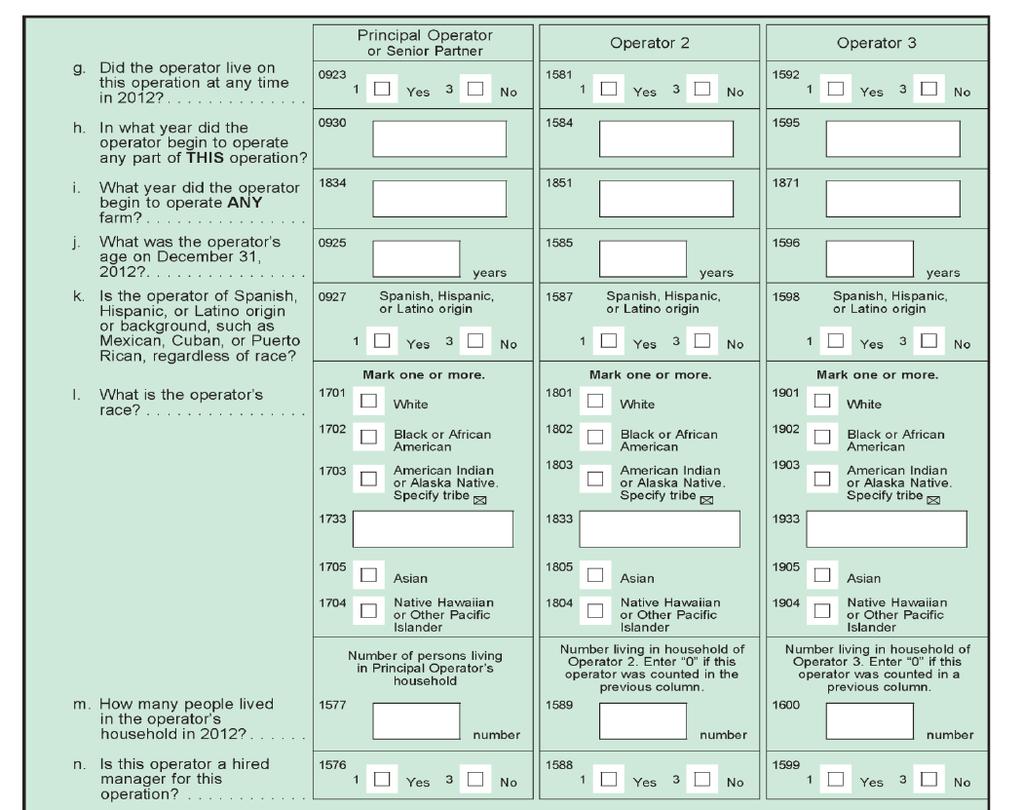
2 Figure 2. Figure 3. page 2
 had fewer than 170 women as farm operators.")
3 Women reported in Census of Agriculture publications as well as being available from online data bases. 1 Among Iowa s counties, four (Adams, Dickinson, Ida, Montgomery) had fewer than 170 women as farm operators. In contrast, Clayton, Delaware, Linn, Warren, and Winneshiek each recorded more than 600 women farm operators (Figure 4, Table 1). Statewide, women made up 25.0 percent of all reported farm operators. Counties in northwest Iowa tended to have the lowest proportions of women farm operators. Thirty percent or more of all farm operators were women in Decatur, Jefferson, Lucas, Polk, Warren, and Winneshiek Counties (Figure 5, Table 1). Among all of Iowa s farms, 35.4 percent reported at least one woman farm operator (Figure 6, Table 1). Figure 4. page 3

4 Figure 5. Figure 6. page 4
5 Table 1., Total Women, Percent of that were Women,, and Percent of with Woman Operator, 2012 Census of Agriculture. 1 Total Women Total % of that were Women % of with Woman Operator Total Women Total % of that were Women % of with Woman Operator Adair Jefferson Adams Johnson Allamakee Jones Appanoose Keokuk Audubon Kossuth Benton Lee Black Hawk Linn Boone Louisa Bremer Lucas Buchanan Lyon Buena Vista Madison Butler Mahaska Calhoun Marion Carroll Marshall Cass Mills Cedar Mitchell Cerro Gordo Monona Cherokee Monroe Chickasaw Montgomery Clarke Muscatine Clay O'Brien Clayton Osceola Clinton Page Crawford Palo Alto Dallas Plymouth Davis Pocahontas Decatur Polk Delaware Pottawattamie Des Moines Poweshiek Dickinson Ringgold Dubuque Sac Emmet Scott Fayette Shelby Floyd Sioux Franklin Story Fremont Tama Greene Taylor Grundy Union Guthrie Van Buren Hamilton Wapello Hancock Warren Hardin Washington Harrison Wayne Henry Webster Howard Winnebago Humboldt Winneshiek Ida Woodbury Iowa Worth Jackson Wright Jasper State of Iowa Census of Agriculture, page 5


6 Many women and men in Iowa are involved in farming. To get an estimate of the participation in agriculture, the number of farm operators can be divided by the number of persons age 21 and older. In Iowa, women farm operators were estimated to be 3.0 percent of Figure 7. females age 21 and older. Iowa s large metropolitan counties had fewer than one percent of women farm operators while several rural counties exceeded 10 percent. Male farm operators were estimated to be 9.3% of males age 21 and older, indicating a greater participation in farm operations for men than for women. In some rural counties, male farm operators were 25 percent or more of the male 21 or older population. Similar to women, metropolitan counties had very low percentages of men as farm operators (Figures 7, 8; Table 2). Figure 8. page 6
7 Table 2. Females and Males 21 Years or Over (2010), 1 and Percent of Females and Males 21 Years or Over that were, 2012 Census of Agriculture. 2 Females 21 Years or Over 1 % of Females 21+ that were Males 21 Years or Over 1 % of Males 21+ that were Females 21 Years or Over 1 % of Females 21+ that were Males 21 Years or Over 1 % of Males 21+ that were Adair Jefferson Adams Johnson Allamakee Jones Appanoose Keokuk Audubon Kossuth Benton Lee Black Hawk Linn Boone Louisa Bremer Lucas Buchanan Lyon Buena Vista Madison Butler Mahaska Calhoun Marion Carroll Marshall Cass Mills Cedar Mitchell Cerro Gordo Monona Cherokee Monroe Chickasaw Montgomery Clarke Muscatine Clay O'Brien Clayton Osceola Clinton Page Crawford Palo Alto Dallas Plymouth Davis Pocahontas Decatur Polk Delaware Pottawattamie Des Moines Poweshiek Dickinson Ringgold Dubuque Sac Emmet Scott Fayette Shelby Floyd Sioux Franklin Story Fremont Tama Greene Taylor Grundy Union Guthrie Van Buren Hamilton Wapello Hancock Warren Hardin Washington Harrison Wayne Henry Webster Howard Winnebago Humboldt Winneshiek Ida Woodbury Iowa Worth Jackson Wright Jasper State of Iowa Decennial Census, Census of Agriculture, page 7
8 Operator Characteristics operator characteristics are reported for a maximum of three farm operators for each farm (Figures 2, 3). From these questionnaire responses, 32,167 women farm operators were counted. Three-fourths of women farm operators, as well as a majority of male farm operators said that their place of residence was on their farm (Figure 9). Women and men had a similar age distribution. Twenty-six percent reported being age 65 or older and fewer than 10 percent were younger than age 35 (Figure 10). Large majorities of both women and men reported at least ten years of experience as a farm operator (Figure 11). Men and women differed, however, in the proportion reporting farming as their primary occupation. Less than a third of the women farm operators said farming was their primary occupation in contrast to nearly 56% of the male operators who said farming was primary (Figure 12). Even though there were differences in primary occupation, women and men had similar profiles in offfarm work. Forty-two percent of women operators and thirty-eight percent of male operators reported at least 200 days of off-farm work (Figure 13). Figure 9. from Section 35, Question 2, all 3 columns reported place of residence of farm operators (of three listed) total women men 129, % 32, % 97, % on farm 91, , , other 38, , , Figure 10. from Section 35, Question 2, all 3 columns reported age of farm operators (of three listed) total women men age 129, % 32, % 97, % , , , , , , , , , page 8
9 Figure 11. from Section 35, Question 2, all 3 columns reported years operating any farm of farm operators (of three listed) total women men years 129, % 32, % 97, % 9 or less 22, , , or more 107, , , Figure 12. from Section 35, Question 2, all 3 columns reported primary occupation of farm operators (of three listed) total women men 129, % 32, % 97, % farming 64, , , other 64, , , Figure 13. from Section 35, Question 2, all 3 columns reported work off farm of farm operators (of three listed) total women men days 129, % 32, % 97, % none 52, , , any 77, , , , , , page 9


10 Each farm has one operator designated as the principal operator (Figure 2). In 2012, 7,108 of the women farm operators were the principal operator for their farm. The counties ranged from 27 Figure 14. (Monona ) to 153 (Johnson ) women principal operators (Figure 14, Table 3). Statewide, 8.0 percent of farms had a woman principal operator. Iowa s counties ranged from 2.9% (Lyon ) of farms with women principal operators to 15.1% in Polk. (Figure 15, Table 3). The farm operations with a woman principal operator were smaller Figure 15. page 10
11 than those with a male principal operator. Statewide, the farms with a woman principal operator averaged 122 acres. This was much smaller than the average (345 acres) for all farms as well as smaller than the average (365 acres) for farms with a male principal operator. For Iowa s counties, the average size for farms with women principal operators was smaller than 60 acres in Bremer, Black Hawk, and Polk Counties. These contrasted with six counties (Audubon, Cherokee, Franklin, Harrison, Kossuth, Plymouth) for which the average size exceeded 220 acres. For male principal operators, the smallest county average was 204 acres (Dubuque ) and ranged upward to 652 acres in Monona (Figure 20, Table 3). Table 3., Women, Percent of who were Women, and Average Size (Acres) with Woman or Male Operator, 2012 Census of Agriculture. 1 () Women % of that were Women Average Size (Acres) with Woman Operator with Male Operator () Women % of that were Women Average Size (Acres) with Woman Operator with Male Operator Adair Jefferson Adams Johnson Allamakee Jones Appanoose Keokuk Audubon Kossuth Benton Lee Black Hawk Linn Boone Louisa Bremer Lucas Buchanan Lyon Buena Vista Madison Butler Mahaska Calhoun Marion Carroll Marshall Cass Mills Cedar Mitchell Cerro Gordo Monona Cherokee Monroe Chickasaw Montgomery Clarke Muscatine Clay O'Brien Clayton Osceola Clinton Page Crawford Palo Alto Dallas Plymouth Davis Pocahontas Decatur Polk Delaware Pottawattamie Des Moines Poweshiek Dickinson Ringgold Dubuque Sac Emmet Scott Fayette Shelby Floyd Sioux Franklin Story Fremont Tama Greene Taylor Grundy Union Guthrie Van Buren Hamilton Wapello Hancock Warren Hardin Washington Harrison Wayne Henry Webster Howard Winnebago Humboldt Winneshiek Ida Woodbury Iowa Worth Jackson Wright Jasper State of Iowa Census of Agriculture, page 11

12 Figure 16. Figure 17. page 12
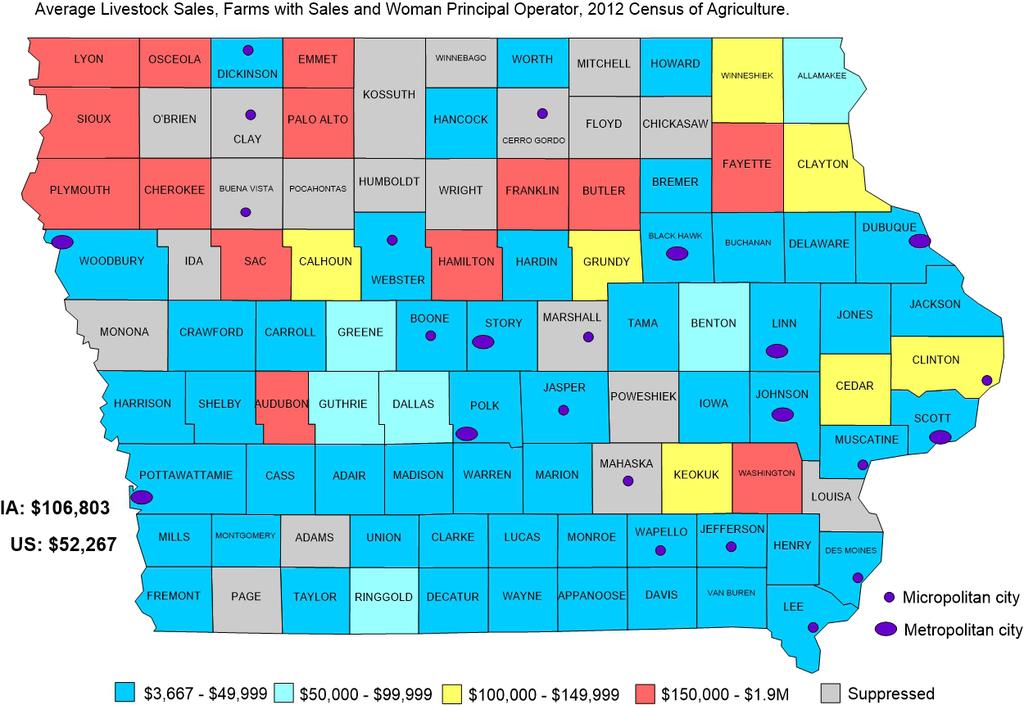
13 of crops and livestock were reported for farms with women principal operators that had sales, although the information is suppressed and not available for 19 counties. These farms statewide averaged nearly $112,000 in crop sales and $107,000 in livestock sales. There were, however, significant variations in these sales across the counties. Average sales ranged from under $50,000 in some counties to more than half a million dollars in others. Counties in northwest Iowa tended to have some of the highest average livestock sales (Figures 16, 17; Table 4). Table 4. with Woman Operator: with Crop and Livestock and Average Crop and Livestock (Dollars), 2012 Census of Agriculture. 1 with Crop Average Crop (Dollars) with Livestock Average Livestock (Dollars) with Crop Average Crop (Dollars) with Livestock Average Livestock (Dollars) Adair 17 $122, $21,538 Jefferson 26 $28, $11,889 Adams 11 * * * Johnson 67 $54, $22,622 Allamakee 23 $32, $59,261 Jones 31 $58, $6,000 Appanoose 25 $23, $28,625 Keokuk 26 $156, $118,000 Audubon 12 $537,333 4 $575,750 Kossuth 31 * 8 * Benton 38 $105, $96,833 Lee 30 $99, $5,056 Black Hawk 18 $43, $5,600 Linn 66 $103, $11,622 Boone 38 $43, $3,727 Louisa 27 * 15 * Bremer 23 $29, $19,211 Lucas 33 $44, $18,931 Buchanan 33 $99, $37,556 Lyon 20 $104, $550,200 Buena Vista 27 * 7 * Madison 33 $65, $15,786 Butler 21 $135, $342,529 Mahaska 21 * 13 * Calhoun 26 $81, $105,933 Marion 34 $43, $29,320 Carroll 24 $136,875 5 $16,400 Marshall 37 * 23 * Cass 14 $182, $8,833 Mills 16 $62, $11,400 Cedar 34 $396, $102,136 Mitchell 29 * 8 * Cerro Gordo 17 * 8 * Monona 20 * * * Cherokee 25 $198, $259,333 Monroe 23 $17, $10,308 Chickasaw 30 * 15 * Montgomery 19 $153, $27,818 Clarke 20 $9, $5,882 Muscatine 25 $77,080 8 $5,125 Clay 20 * 9 * O'Brien 18 * 6 * Clayton 32 $94, $139,657 Osceola 10 $153, $1,924,000 Clinton 29 $54, $107,458 Page 25 * 7 * Crawford 15 $157, $11,381 Palo Alto 19 $406, $334,545 Dallas 41 $104, $57,563 Plymouth 34 $124, $257,583 Davis 21 $14, $29,200 Pocahontas 17 $87,647 * * Decatur 41 $30, $33,800 Polk 55 $42, $9,556 Delaware 34 $55, $29,886 Pottawattamie 38 $100, $6,650 Des Moines 31 $71, $34,143 Poweshiek 14 * 13 * Dickinson 11 $83,727 6 $3,667 Ringgold 19 $41, $98,278 Dubuque 37 $41, $43,583 Sac 30 $72, $231,538 Emmet 10 $255,400 8 $183,125 Scott 33 $100, $10,391 Fayette 30 $221, $239,462 Shelby 22 $134, $33,200 Floyd 17 * 5 * Sioux 21 $140, $535,409 Franklin 25 $285, $152,467 Story 50 $144, $16,385 Fremont 10 $253,200 5 $5,800 Tama 31 $138, $19,125 Greene 23 $286, $65,636 Taylor 18 $69, $22,519 Grundy 14 $241, $123,231 Union 23 $24, $31,700 Guthrie 32 $61, $52,222 Van Buren 28 $50, $15,611 Hamilton 14 $327, $465,462 Wapello 51 $77, $19,500 Hancock 24 $119,417 8 $16,250 Warren 60 $58, $11,867 Hardin 22 $115, $23,214 Washington 30 $104, $353,167 Harrison 37 $198,162 8 $5,875 Wayne 14 $25, $16,955 Henry 20 $32, $12,852 Webster 27 $221, $19,278 Howard 18 $79, $36,810 Winnebago 11 * 1 * Humboldt 19 * 11 * Winneshiek 40 $110, $109,639 Ida 7 * 4 * Woodbury 23 $91, $6,667 Iowa 26 $116, $10,071 Worth 19 $55,053 4 $11,250 Jackson 43 $56, $46,172 Wright 28 * 7 * Jasper 28 $64, $8,143 State of Iowa 2629 $111, $106, Census of Agriculture, *Data not available, suppressed page 13

14 Figure 18. Figure 19. page 14
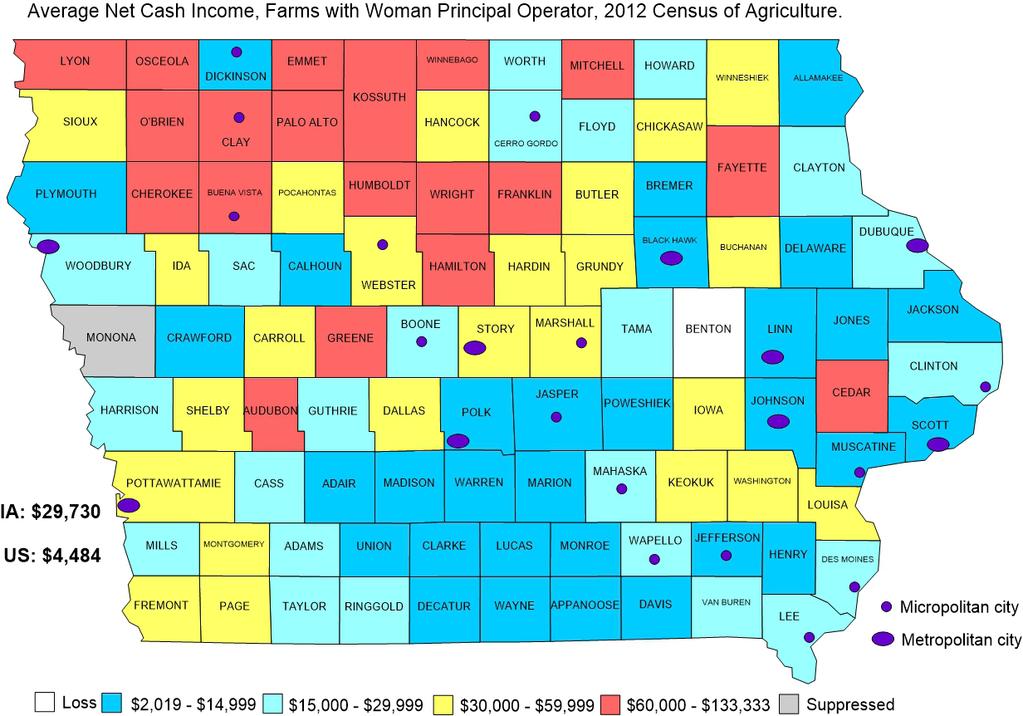
15 When taken together, sales of all agricultural products for farms with a woman principal operator averaged nearly $66,700 in Twenty-three counties averaged less than $25,000, however, and contrasted with another 23 with more than $100,000 in average sales. The highest average sales tended to be in counties in northwest Iowa (Figure 18, Table 5). Net cash income for farms with a woman principal operator averaged $29,700 statewide in Once again, the highest averages were in northwest counties. Benton farms with a woman principal operator had an average net loss (Figure 19, Table 5). Women who are principal operators of their farm tend to have a different ownership pattern than do Table 5. with Woman Operator: Average Total (Dollars), Average Net Cash Income (Dollars), Percent Full Owners; with Male Operator: Percent Full Owners, 2012 Census of Agriculture. 1 Woman Operator Average Total (Dollars) Average Net Cash Income (Dollars) Percent Full Owners Male Operator Percent Full Owners Woman Operator Average Total (Dollars) Average Net Cash Income (Dollars) Percent Full Owners Male Operator Percent Full Owners Adair $49,208 $13, Jefferson $12,474 $11, Adams $26,853 $20, Johnson $29,373 $10, Allamakee $24,149 $11, Jones $24,615 $8, Appanoose $21,100 $4, Keokuk $61,681 $31, Audubon $203,512 $68, Kossuth $157,871 $104, Benton $64,638 -$30, Lee $34,506 $21, Black Hawk $16,529 $11, Linn $57,236 $9, Boone $18,000 $20, Louisa $97,127 $53, Bremer $16,215 $10, Lucas $21,309 $4, Buchanan $67,288 $34, Lyon $313,667 $103, Buena Vista $123,352 $84, Madison $29,281 $12, Butler $111,115 $51, Mahaska $61,000 $24, Calhoun $39,989 $12, Marion $21,311 $10, Carroll $58,034 $34, Marshall $121,238 $36, Cass $61,884 $28, Mills $20,849 $25, Cedar $191,939 $95, Mitchell $153,038 $64, Cerro Gordo $40,000 $27, Monona $105,519 * Cherokee $239,162 $111, Monroe $9,119 $4, Chickasaw $65,847 $30, Montgomery $78,610 $37, Clarke $4,833 $2, Muscatine $24,600 $10, Clay $221,455 $90, O'Brien $193,412 $101, Clayton $67,581 $16, Osceola $667,500 $133, Clinton $55,333 $23, Page $59,774 $43, Crawford $45,702 $11, Palo Alto $139,171 $97, Dallas $57,196 $33, Plymouth $186,250 $13, Davis $16,967 $7, Pocahontas $33,864 $32, Decatur $25,157 $6, Polk $22,906 $2, Delaware $27,829 $13, Pottawattamie $45,529 $40, Des Moines $35,880 $16, Poweshiek $91,092 $6, Dickinson $23,575 $12, Ringgold $38,773 $17, Dubuque $40,803 $15, Sac $89,603 $27, Emmet $93,465 $66, Scott $47,240 $10, Fayette $91,290 $63, Shelby $69,100 $46, Floyd $44,521 $29, Sioux $249,661 $34, Franklin $165,123 $72, Story $81,489 $39, Fremont $67,421 $45, Tama $50,479 $24, Greene $116,159 $68, Taylor $25,917 $20, Grundy $93,981 $46, Union $12,897 $5, Guthrie $28,431 $23, Van Buren $21,304 $16, Hamilton $158,731 $74, Wapello $45,612 $15, Hancock $42,197 $35, Warren $29,447 $5, Hardin $42,279 $31, Washington $92,175 $34, Harrison $110,134 $23, Wayne $11,836 $3, Henry $10,796 $10, Webster $74,376 $45, Howard $24,400 $28, Winnebago $104,442 $60, Humboldt $205,400 $85, Winneshiek $62,932 $33, Ida $21,771 $33, Woodbury $29,449 $19, Iowa $34,681 $31, Worth $21,800 $28, Jackson $43,884 $13, Wright $149,759 $103, Jasper $26,583 $8, State of Iowa $66,683 $29, Census of Agriculture, *Data not available, suppressed page 15
.")
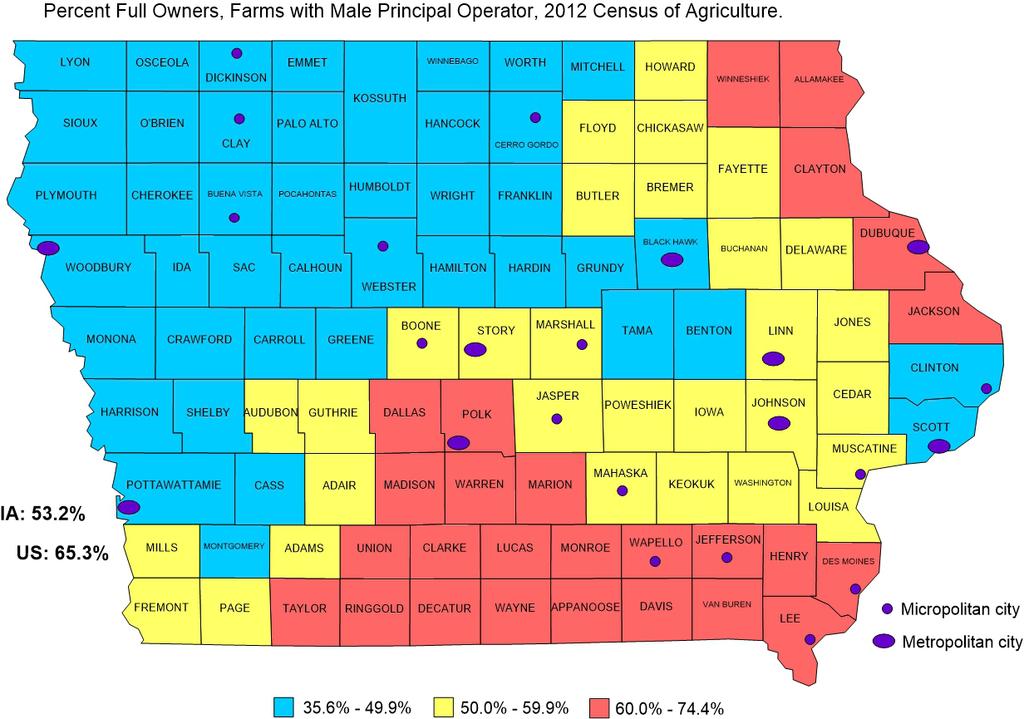
16 male principal operators. In 2012, 86.1% of Iowa s women principal operators said they were full owners of their land. An additional 8.8 % were part owners with the remaining 5.5% as tenants. Male principal operators, in contrast, reported 53.2% full ownership, 36.1% part ownership, along with 10.7% tenants (Figures 21, 22; Table 5). All of the counties had at least 60% full ownership for women principal operators. For male principal operators, there was a broad swath of counties from southwest to northeast where male full ownership was below 50%. Male full ownership was highest in Iowa s southern and northeastern counties (Figure 22, Table 5). The data and information in this report are from the 2012 Census of Agriculture and can be obtained from the USDA s publications and website. 1 An additional resource for many of these data is the Iowa State University Extension and Outreach Indicators Portal. The Indicators Portal is a one-stop shop website for finding, visualizing, and mapping data. The site provides data on many topic and subject areas (including agriculture); tools for designing graphs and maps; Data for Decision Makers county and ISU Extension and Outreach Region profiles; access to city government finance data (Iowa Government Finance Initiative (IGFI)); reports and publications on data trends and topics of interest; and educational materials on data measures and their use. The goal of the Indicators Portal is to make it easier to find, use, visualize, and understand information. The Indicators Portal is funded by Iowa State University Extension and Outreach and is available to Iowa State University faculty, staff, students, and the general public. 2 Figure 20. page 16

17 Figure 21. Figure 22. page 17

18 References and Notes: 1 The Census of Agriculture is carried out by the U.S. Department of Agriculture in the years ending in 2 and Information on the data access, portal, and training project being carried out by Communities and Economic Development Extension and Outreach at Iowa State University can be obtained at: Links to webinars and materials for Women in Agriculture, the American Community Survey, Income Measures, Poverty Measures, and Youth, Race, and Ethnicity can be found at: Thank you Indicators Portal Page: indicators.extension.iastate.edu Information indicators@iastate.edu Tweet Ag Census: Land Ownership Survey: Sandra Charvat Burke 181 Heady Hall Iowa State University Ames, IA scburke@iastate.edu March, and justice for all The U.S. Department of Agriculture (USDA) prohibits discrimination in all its programs and activities on the basis of race, color, national origin, age, disability, and where applicable, sex, marital status, familial status, parental status, religion, sexual orientation, genetic information, political beliefs, reprisal, or because all or part of an individual s income is derived from any public assistance program. (Not all prohibited bases apply to all programs.) Persons with disabilities who require alternative means for communication of program information (Braille, large print, audiotape, etc.) should contact USDA s TARGET Center at (voice and TDD). To file a complaint of discrimination, write to USDA, Director, Office of Civil Rights, 1400 Independence Avenue SW, Washington, DC , or call (voice) or (TDD). USDA is an equal opportunity provider and employer. Issued in furtherance of Cooperative Extension work, Acts of May 8 and June 30, 1914, in cooperation with the U.S. Department of Agriculture. Cathann A. Kress, director, Cooperative Extension Service, Iowa State University of Science and Technology, Ames, Iowa