Overview of ITC s sustainability commitment. Water management approach. Water stewardship performance
|
|
|
- Moses Cobb
- 5 years ago
- Views:
Transcription
1 ITC s Water Management Stewardship Presentation at the Environment & Energy Conclave, BCCI, Kolkata, 31 st August 2012
2 Presentation Plan Overview of ITC s sustainability commitment Water management approach Water stewardship performance Watershed development
3 Commitment to Sustainability
4 Economic Development Vs Sustainable Development Pursuit of economic growth has created enormous material wealth advanced frontiers of knowledge created a globalised world
5 Growth at a huge cost Significant erosion of Natural capital 1/3 rd of global bio-diversity lost in last 35 years 1/3 rd of forest resources, 1/4 th of top soil lost Despite using up much of planet s resources, half the global population in dire poverty UNDP published data reveals : Top 10% adults own 85% of household assets Bottom 50% adults own only 1% of household assets
6 India s challenge is even greater Resource starved 17% of global population 2.4% of land mass 4% of fresh water 1% of forest resources After > 60 years of Independence 42% below income of $1.25 a day 43.5% children under 5 suffer from malnutrition


7 Business cannot succeed in societies that fail
8 Redefining Value Purpose Societal Value Consumer, Social, Ecological Triple Bottom Line Reward Shareholder Value
9 Triple Bottom Line Performance Environment Carbon positive, sequestering 2 times our emissions. i Water positive, generating 3 times freshwater resources than what we consumes. Waste recycling positive for 4 years now. Social Economic ITC s businesses & the Social Investments programme generate livelihoods for over 5 million people. Compound rate of growth in Total Shareholder Returns Shareholder Returns of over 24 % in last 15 years
10 Water Management Approach

11 Racing towards Water Bankruptcy?
12 Less Water for Every Individual ity < Water Stressed In cu meters Per capi ita surfac ce water availabil < Water Scarce Source : Water resources of India, Rakesh Kumar, R. D. Singh, K. D. Sharma, National Institute of Hydrology, India


13 Less Water for Industry Water Use Worldwide Domestic 10% Industry Agri 11% Domestic 18% 30% 82% 59% Agri Industry Developing Countries Developed Countries Source: Ministry of Water Resources, Government of India
14 Moisture stress increasing vulnerability Water demand rising exponentially Groundwater recharge declining dangerously Half of the total districts suffer from severe to extreme moisture stress
15 Water Management Stewardship Water conservation Ahi Achieve lowest possible specific water consumption Zero effluent discharge Recycle all wastewater Water positive footprint Rainwater harvesting Water resources development Stabilise production regime for our farmers
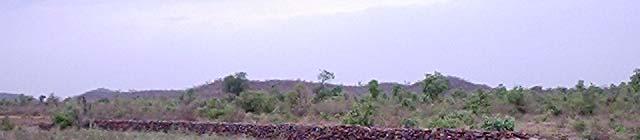
16 Water Conservation
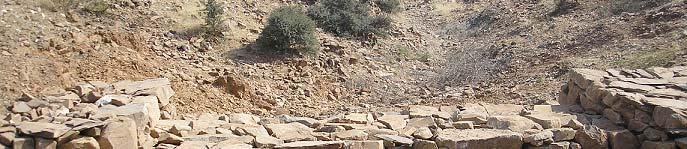
17 Effluent Discharge Zero discharge thru Treating & recycling all wastewater Harvesting all rainwater Of the 39 reporting units 11 units achieved zero effluent discharge in Other units on the way
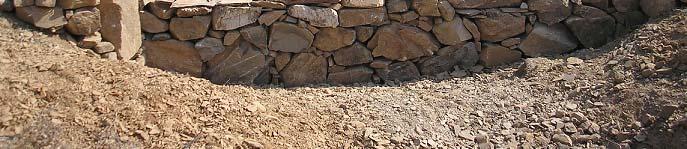
18 Water Positive Footprint
19 Water Resources Development 94,000 ha under soil & moisture conservation 3,780 water harvesting structures 2.9 million KL of potential water storage 92,000 rural households directly impacted 2.9 million person-days days of employment
20 Water Resources Development
21 The Business Context Agri-supply chains at risk because: Agriculture mainly rain-fed Crop production unstable Depletion of bio-mass Aggravating top-soil losses & surface run-off High soil erosion by weathering agents Long term implications for fertility & productivity of land Climate change likely to worsen these conditions Climate extremes, variability & unpredictability Exert enormous pressure on fragile farming systems Threaten food security for the most vulnerable people


22 Preliminary work involves Community based training (leadership, Govt Schemes, micro plans, handling cash, savings, budgeting)


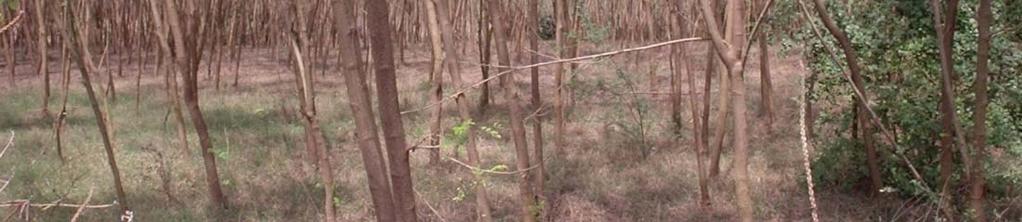
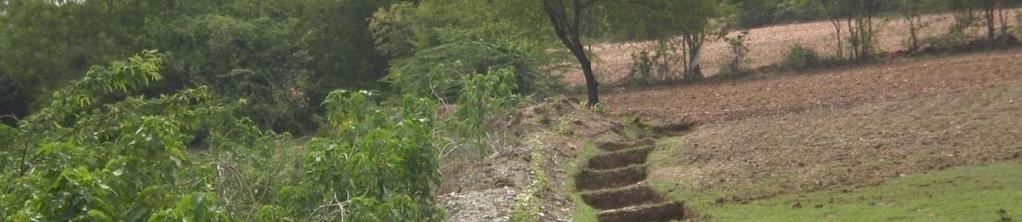
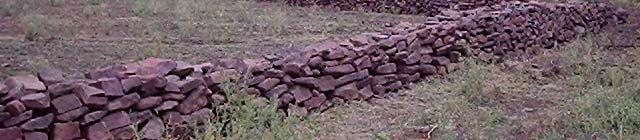
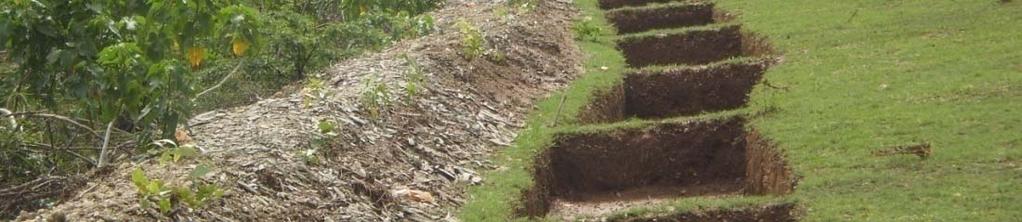


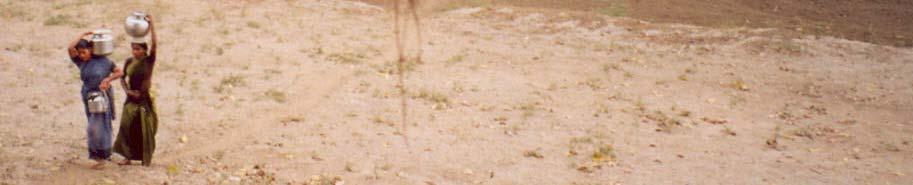
23 Catchment treatment involves Biomass regeneration Drainage age treatment e t RFD, gabions, trenches, etc Trench cum Bunds Boulder bunds
24 Catchment treatment 61,000 ha
25 3,780 water-harvesting structures covering 33,000 ha 40 Gates Stop Dam, Sehore
26 Total freshwater storage created million kilo litres Stop Dam, Narsinghkheda, Sehore
27 92,000 direct beneficiaries have contributed Rs 11 crores towards these activities and created a corpus of Rs 49 lakhs as maintenance fund
28 2.9 million person-days of employment created for the marginal & landless households
29 Life-saving water for animals
30 Water is also a gender issue


31 Water is also a gender issue Tank beds the only source of drinking water in May-June
32 Water Use Efficiency Group Irrigation 500 units
33 Water Use Efficiency Sprinkler sets as demos - 770
34 Watershed Impacts Environment: Ground water recharge Increase in bio-mass cover Farm Economics Increase in area under cultivation Double cropping regime Increase in productivity per hectare Social Decrease in seasonal out-migration
35 Going forward Multi-stakeholder Partnerships
36 Why Partnerships Matter Improve efficiency of project implementation thru convergence of: Government s reach & coverage Project management capabilities of private sector Mobilising skills of NGOs Augment total resource pool for maximum impact Both financial and managerial Enduring value for sustainable ab development e e by Enhancing project management skills of the PRIs
37 For the farmer Bottomline Stable yields at the minimum and higher yield with better quality at best. For the landless On-farm employment decreased seasonal migration For the nation Water-conservation addressing the single most important area of concern For ITC Availability of agricultural produce in the required quantities and of desired d quality A water positive Company for 9 consecutive years


38 A passion for profitable growth...but in a way that is sustainable.. and inclusive
39 Thank you Thank You