Rise of Medium-Scale Farms in Africa: Causes and Consequences of Changing Farm Size Distributions
|
|
|
- Steven Stewart
- 5 years ago
- Views:
Transcription
1 Rise of Medium-Scale Farms in Africa: Causes and Consequences of Changing Farm Size Distributions T.S. Jayne, Milu Muyanga, Kwame Yeboah, Jordan Chamberlin, Ayala Wineman, Ward Anseeuw, Antony Chapoto, and Nicholas Sitko Presentation at University of Western Cape / PLAAS Cape Town, South Africa 7 December 2017


 under the Food")


2 Acknowledgements: The work highlighted here is jointly funded through the generous support of the American people through the United States Agency for International Development (USAID) under the Food Security Policy Innovation Lab and by the Bill and Melinda Gates Foundation under the Guiding Investments in Sustainable Agricultural Intensification Grant to MSU.
3 Outline 1. Evidence of changes in farm structure 2. Causes 3. Consequences 4. Comparison of cropping patterns between SS, MS and LS farms 5. Implications 3
4 Outline 1. Evidence of changes in farm structure 2. Causes 3. Consequences 4. Comparison of cropping patterns between SS, MS and LS farms 5. Implications 4
5 Changes in farm structure in Zambia ( ) Farm size category Number of farms % growth in number of farms % of total cultivated area ha 638, , % 2 5 ha 159, , ha 20, , ha 2,352 53, % ha -- 13,839 na Total 820,341 1,399, Source: Zambia MAL Crop Forecast Surveys, 2001 and 2012
6 Changes in farm structure in Zambia ( ) Farm size category Number of farms % growth in number of farms % of total cultivated area ha 638, , ha 159, , ha 20, , % ha 2,352 53, % ha -- 13,839 na Total 820,341 1,399, Source: Zambia MAL Crop Forecast Surveys, 2001 and 2012
7 Changes in farm structure in Tanzania ( ), LSMS/National Panel Surveys Number of farms (% of total) % growth in number of farms between initial and latest year % of total operated land on farms between ha Farm size ha 5,454,961 (92.8) 6,151,035 (91.4) % 5 10 ha 300,511 (5.1) 406,947 (6.0) ha 77,668 (1.3) 109,960 (1.6) % ha 45,700 (0.7) 64,588 (0.9) Total 5,878,840 (100%) 6,732,530 (100%)
8 Changes in farm structure in Ghana ( ) Ghana Number of farms % growth in number of farms % of total cultivated area ha 1,458,540 1,582, ha 578, , ha 116, , ha 38, , ha 18,980 37, >100 ha -- 1, Total 2,211,900 3,057, % of total farmland Source: Ghana GLSS Surveys, 1992, 2013
9 Medium-scale farms share of total crop value in Tanzania: 14% to 29% in 6 years Proportion of total crop value produced by farm size categories Prportion <= 5 ha 5-20 ha ha Source: NPS 2009, 2011, 2013,
10 Changes in farm size distributions: Summary 1. Number of small farms growing slowly 2. Number of medium-scale farms growing rapidly 3. Share of area under small farms declining 4. Share of area under medium-scale growing, and currently over 40% of farm holdings (over 25% of cultivated area) 10
11 % of National Landholdings held by Urban Households 35% 32.7% 30% 26.8% 25% 22.0% 22.0% 20% 18.3% 16.8% 15% 10% 11.2% 10.9% 11.8% 5% 0% / /2014 Ghana Kenya Malawi Rwanda Tanzania Zambia Source: Demographic and Health Surveys, various years between
12 % of National Landholdings held by Urban Households 35% 32.7% 30% 26.8% 25% 22.0% 22.0% 20% 18.3% 16.8% 15% 10% 11.2% 10.9% 11.8% 5% 0% / Source: 2013/2014 DHS Ghana Kenya Malawi Rwanda Tanzania Zambia
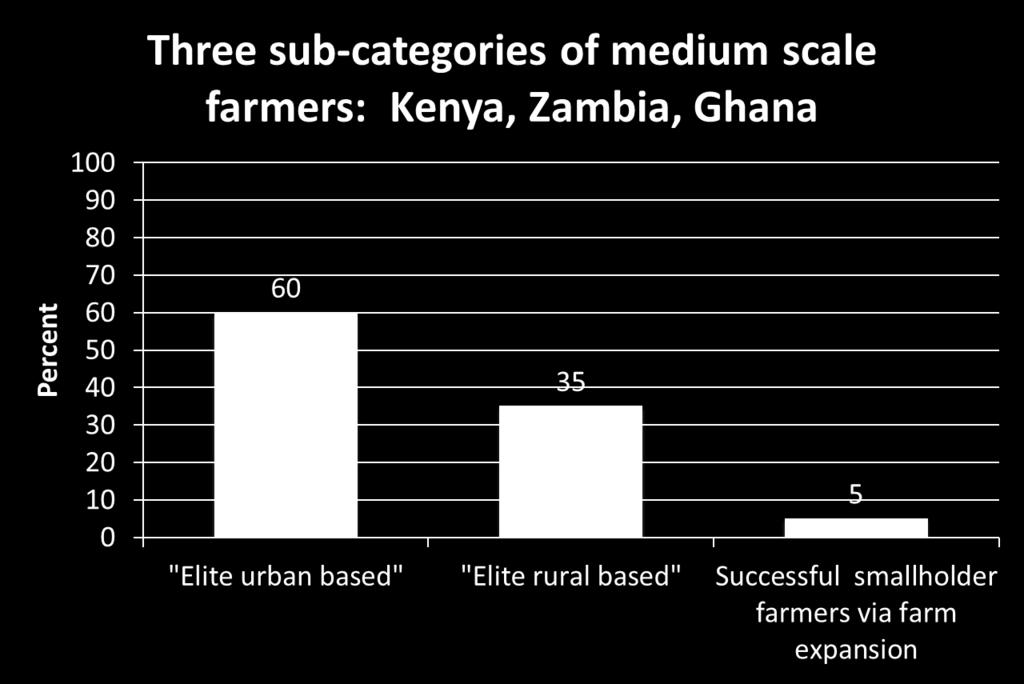
13 Characteristics of emergent farmers

14 Rise of the medium-scale farmers

15 Rise of the medium-scale farmers

16 Rise of the medium-scale farmers
17 Medium-scale investor farmers Mode of entry into medium-scale farming: acquired farm using non-farm income Zambia Kenya (n=164) (n=180) % of cases % men Year of birth Years of education of head Have held a job other than farmer (%) Formerly /currently employed by the public sector (%) Current landholding size (ha) % of land currently under cultivation Decade when land was acquired 1969 or earlier or later Source: MSU, UP, and ReNAPRI Retrospective Life History Surveys, 2015
18 Outline 1. Document how rapidly farm structure is changing 2. Causes of changing farm structure 3. Consequences 4. Comparison of cropping patterns between SS, MS and LS farms 5. Implications 18
19 Causes of changing farm size distributions 1. Rise in world food prices heightened investor interest in farmland 2. Urban farmer capture of land policy / farm lobbies 3. Rapid population growth Fragmentation/subdivision in areas of favorable mkt access Land inheritance declining rising land scarcity rising land prices Rising challenges of youth access to land outmigration 19
20 Sub-Saharan Africa: only region of world where rural population continues to rise past Total Rural Population (millions) China India Sub-Saharan Africa Other South Asia South-East Asia Source: UN
21 Mode of acquisition of all farm plots in Percent of plots Tanzania Percent of total farmland area Inherited 33.17% Gifted 10.33% Purchased 29.63% Borrowed 11.09% Rented 9.63% Other (squatting / cleared land/ allocated) 6.16% Observations 4,291 Other mode of acquisition 11.30% Rented 7.00% Borrowed 6.90% Purchased 36.46% Inherited/ gifted 38.34% Source: NPS 2014/15 21
22 Mean land prices in Tanzania: +53.9% in real terms in 6 years Source: NPS 2009, 2011, 2013,
23 Land values across Tanzania, 2009 to 2013 Land value (100,000s TSh/acre, real prices) 2009 to 2013 Test a (per year) 2009 = 2013 Median Mean Median Mean Median Mean Median Mean P-value PANEL A Whole country Zone Western Northern Central Southern Highlands Lake Eastern Southern Zanzibar PANEL B Plot size category 0-5 ha ha PANEL C Distance category (Distance from town) Tercile Tercile Tercile
24 Correlates of land values (pooled OLS, cultivated plots) Dependent variable: ln(land value, TSh/ acre, inflation adjusted) Coef. P-value Coef. P-value Area (acres, estimated) -0.07*** 0.00 Distance to road (km) -0.02*** 0.00 Area *** 0.00 Distance to town (km) *** = At residence 0.26*** 0.00 Distance to major market (km) ** = Formal document 0.22** 0.02 Population density (100s persons / km 2 ) 0.01*** = Less formal document 0.25*** 0.00 Average annual temperature (10s C) = Can be left uncultivated Average annual rainfall (100s mm) 0.04** = Good soil quality 0.12*** = Agro-ecological zone (AEZ) is warm / semiarid b = Bad soil quality = AEZ is warm / humid = No slope (flat) = AEZ is cool / semiarid = Steep slope = AEZ is cool / subhumid = Pre-harvest crop loss on plot = AEZ is cool / humid 0.59** = Erosion control 0.15*** = Year *** = Irrigated 0.35** = Year *** = Contains fruit trees or permanent crops 0.39*** 0.00 Constant 12.21*** 0.00 Proportion of crop value marketed 0.28*** 0.00 Region fixed effects (FE) Y 1= Rural household -0.22** 0.02 Observations 15,069 Adjusted R-squared 0.35 Mean variance inflation factor (VIF) 1.95 Standard errors clustered at district; *** p<0.01, ** p<0.05, * p<0.1 24
25 Adjusted price (2004=100) Output and factor price indices, rural Malawi, Sources: IHS for land and wages; FEWSNET for urea and maize Rental rate (MWK/ha) Agricultural wage (MWK/day) MWK/kg urea MWK/kg maize


26 Changes in farm structure in Ghana ( ) Ghana Number of farms % growth in number of farms % of total cultivated area ha 1,458,540 1,725, ha 578, , ha 116, , ha 38, , ha 18,980 46, >100 ha -- 6, * Total 2,211,900 3,102, Source: Ghana GLSS Surveys, 1992, 2013
27 27
28 Outline 1. Document how rapidly farm structure is changing 2. Causes 3. Consequences of changing farm structure 4. Comparison of cropping patterns between SS, MS and LS farms 5. Implications 28
29 Consequences of changing farm size distributions 1. Rising use of mechanization 2. Pulling in large-scale commodity traders 3. Greater inequality of farmland distribution 4. Some displacement 5. Rising land prices straining youth access to land 6. Multiplier effects of ag growth are changing 7. Governments may be losing ability to estimate national output 29
30 Nominal value of imports in 000 US$ Nominal value of tractor imports to Sub-Saharan Africa (excluding South Africa), $600,000 $500,000 $400,000 $300,000 $200,000 $100,000 $ Sub-Saharan Africa Southern Africa North Eastern Africa Western Africa Linear (Sub-Saharan Africa) Source: vanderwesthuisen, forthcoming 30
31 Value of Imports: US$ Thousand Nominal value of tractor imports in selective Sub-Saharan African countries ( ) $100,000 $90,000 $80,000 $70,000 $60,000 $50,000 $40,000 $30,000 $20,000 $10,000 $ Ghana Nigeria Kenya Tanzania Zambia Linear (Ghana) Linear (Nigeria) Linear (Kenya) Linear (Tanzania) Linear (Zambia) Source: vanderwesthuisen, forthcoming 31
32 GINI coefficients in farm landholding Period Movement in Gini coefficient: Ghana (cult. area) (GLSS) Kenya (cult. area) (KIHBS) Tanzania (landholdings) (LSMS) Tanzania (area controlled) (ASCS) Zambia (landholding) (CFS) Source: Jayne et al (JIA) 32
33 Comparison of farmland owned and land under cultivation in Tanzania: 2008 Agricultural Sample Census Survey vs LSMS/NPS Survey Farm land controlled Land under operation LSMS Ag Sample Census Survey % difference LSMS Ag Sample Census Survey % difference By holdings of: Million hectares Million hectares 0-5 ha ha Over 100 ha
34 Outline 1. Document how rapidly farm structure is changing 2. Causes 3. Consequences 4. Comparison of cropping patterns between SS, MS and LS farms 5. Implications 34
35 Average land area allocated to each land use, by category of landholding size Source: Agricultural Sample Census, 2008
36 Value of crop production, Tanzania, Millions TSh (2015 shillings) 1,400,000 1,200,000 1,000, , , , ,000 0 <= 5 ha Series1 Series2 Series3 Series4 450, , , , , , , ,000 50,000 0 Millions TSh (2015 shillings)500, ha Source: NPS, 2009, 2011, 2013, 2015
37 Cropping patterns,0-5 ha vs ha, Tanzania, 2009
38 Proportion of area to crops, Tanzania, 2009 Proportion of cropped area allocated to crop categories, by farm size > 1,000 ha 100-1,000 ha ha 5-20 ha <= 5 ha Maize Rice Other cereals Tubers Legumes & oilseeds Cash crops Vegetables Fruits Spices Flowers Source: Agricultural Sample Census Survey, 2009

39 Outline 1. Document how rapidly farm structure is changing 2. Causes 3. Consequences 4. Comparison of cropping patterns between SS, MS and LS farms 5. Implications for policy and research 39
40 Summary of main findings: 1. Important changes in the distribution of farm sizes Decline in share of farmland under 5 hectare farms Rise of medium-scale farms 2. Rising inequality of farmland distribution 3. Growing land scarcity driven by middle/high income urban people seeking to acquire land not just for land speculation, housing/properties, farming Rise of new towns converting formerly remote land into valued property 4. Results derived during a decade of very high food prices
41 Implications for policy 1. The transition issue How to transform African economies from current situation to more diversified and productive economies
42 Implications for policy (cont.) 2. Ag sector policies must anticipate and respond to rising land prices decline of land inheritance, land markets as increasingly important means of acquiring land
43 Implications for policy (cont.) 3. Agricultural productivity growth will be the cornerstone of any comprehensive youth livelihoods strategy: Ag productivity growth influences pace of labor force exit out of farming Labor productivity in broader economy

44 Implications for policy (cont.) 4. Mounting evidence that youth engagement in agriculture will depend on government actions influencing the profitability of small farms Rural transformation will depend on young peoples profitable engagement in farming in the context of rising land prices
45 2 Looming employment challenge in SSA [80+] [75-79] [70-74] [65-69] [60-64] [55-59] [50-54] [45-49] [40-44] [35-39] [30-34] [25-29] [20-24] [15-19] [10-14] [5-9] [0-4] Age pyramid: rural SSA, 2015 Male Female 62% < 25 years old -10% -8% -6% -4% -2% 0% 2% 4% 6% 8% 10%
46 Major research issues to guide agricultural policy: 1. Productivity differences between small and medium-scale farms limited evidence but reasons to believe that capitalized and educated MS farms may increasingly become more productive Main implications for economic transformation may pertain more to GE effects on employment and wages 2. Are there positive or negative spillover effects?
47 Major challenges/research issues for land policies 3. Provide stronger land rights for women: While many African countries have new laws recognizing gender equality, implementation is weak, especially given continued dominance of customary practices, which tend to discriminate against women 4. Distinguish between: Strengthening land rights on land that is currently utilized Deciding on how currently unutilized land is to be allocated who decides?

48 Thank You 48
49 Allocation of area of farms 0-5 ha, Tanzania, 'Typical' farm, 0-5 ha Hectares Maize Rice Other cereals Tubers Legumes & oilseeds Cash crops Vegetables Fruits Spices Timber Other Fallow Forest Other use
50 Allocation of area of farms 5-20 ha, Tanzania, 'Typical' farm, 5-20 ha Hectares Maize Rice Other cereals Tubers Legumes & oilseeds Cash crops Vegetables Fruits Spices Timber Other Fallow Forest Other use


51 10% Successful nonfarm Pulled out of agriculture In jobs with high barriers to entry Post-secondary education Invested in skills 40% Non-farm YOUTH LIVELIHOODS OPTIONS 62% < 25 years 30% Struggling nonfarm 50% Struggling farm Pushed out of agriculture Relatively unskilled / limited education Limited access to land / finance Mainly informal sector / wage workers Pushed into agriculture Few productive assets Poor access to land, finance, knowledge High concentration of poverty 80% 60% Farming 10% Successful farm Pulled into agriculture Good access to land, finance, etc. Favorable market access, infrastructure Diversified income sources


52 Structural transformation pathway 40% Non-farm 10% Successful non-farm 30% Struggling non-farm 70% Successful nonfarm Policies Inclusive economic growth Infrastructure R&D Education Post-secondary YOUTH LIVELIHOODS OPTIONS 62% < 25 years 60% Farming 50% Struggling farm 10% Successful farming 30% Successful farming Policies R&D / ext. Land access Finance Infrastructure and investments along value chain Irrigation Roads Electricity
53 What do we know about agricultural growth in Sub-Saharan Africa? Sources of growth: The views expressed are those of the author(s) and should not be attributed to the Economic Research Service or USDA. Source: Economic Research Service, international-agricultural-productivity/