COMMISSION OF THE EUROPEAN COMMUNITIES COMMISSION STAFF WORKING DOCUMENT. Accompanying the
|
|
|
- Ira Floyd
- 5 years ago
- Views:
Transcription
1 EN EN EN
2 COMMISSION OF THE EUROPEAN COMMUNITIES Brussels, SEC (2008) 2047 COMMISSION STAFF WORKING DOCUMENT Accompanying the FIFTH PROGRESS REPORT ON ECONOMIC AND SOCIAL COHESION Growing Regions, growing Europe {COM(2008) 371final} EN EN
3 COMMISSION STAFF WORKING DOCUMENT accompanying the Fifth Progress Report on economic and social Cohesion Growing Regions, growing Europe 1. FIGURES AND TABLES Figure 1 Convergence of GDP per head, employment rates and unemployment rates, Figure 1 - Dispersion of regional (NUTS2) key indicators (%) (coefficient of variation) GDP/head Employment rate 80 Unemployment rate Source: Eurostat Table 1: Main characteristics for the Convergence, Transition and Regional Competitiveness and Employment regions Conv Transition RCE EU27 Population share in 2005 in % Average annual change in population in % *** Number of regions* Employment rate in 2006 in %** Change in employment rate in percentage points ** Unemployment rate in 2006 in %*** Change in unemployment rate in percentage points *** GDP per head in 2005, EU27=100 **** Change in GDP per head in index points EU27=100 **** R&D as % of GDP, 2004 or most recent year * DEE0 (Sachsen-Anhalt) taken into account as Convergence region ** based on NUTS breakdown valid 1/1/2007 *** Excluding two UK, PT, DE and one Finish region (no data) *** excl. UKM5 and UKM6 (no data) Source: Eurostat and DG REGIO calculations EN 2 EN
4 Table 2: Employment and GVA share and change in six sectors, Share in 2005 in % Employment GVA Conv Transition RCE EU27 Conv Transition RCE EU27 Agriculture, hunting and fishing Total industry, including energy Construction Trade, transport & communication Financial and business services Other services Total Share of EU Average Annual Change in % Employment GVA Conv Transition RCE EU27 Conv Transition RCE EU27 Agriculture, hunting and fishing Total industry, including energy Construction Trade, transport & communication Financial and business services Other services Total Note: Due to the lack of regional data in the UK, national data was used and all of UK was considered as RCE. Source: Eurostat and DG REGIO calculations Table 3: Productivity by sector in 2005 by type of region 2005 GVA per person employed EU27=100 Conv Transition RCE EU27 Agriculture, hunting and fishing Total industry, including energy Construction Trade, transport & communication Financial and business services Other services Total Note: Due to the lack of regional data in the UK, national data was used and all of UK was considered as RCE. Source: Eurostat and DG REGIO calculations Table 4: Share of knowledge workers and population with high educational level by type of region, 2006 Conv Transition RCE EU27 Share of knowledge workers (ISCO 1,2,3) as % of total employment Change in share of knowledge workers in percentage points Share of population with high educational level (% of total population 25-64) Change in share of population with high educational level in percentage points Share of Human Resources in Science and Technology (core) (% of active population) Change in share of Human Resources in Science and Technology (core) The breakdown by category does not include FR9, DE41, DE42, UKM6 and UKM5 Source: Eurostat and DG REGIO calculations EN 3 EN
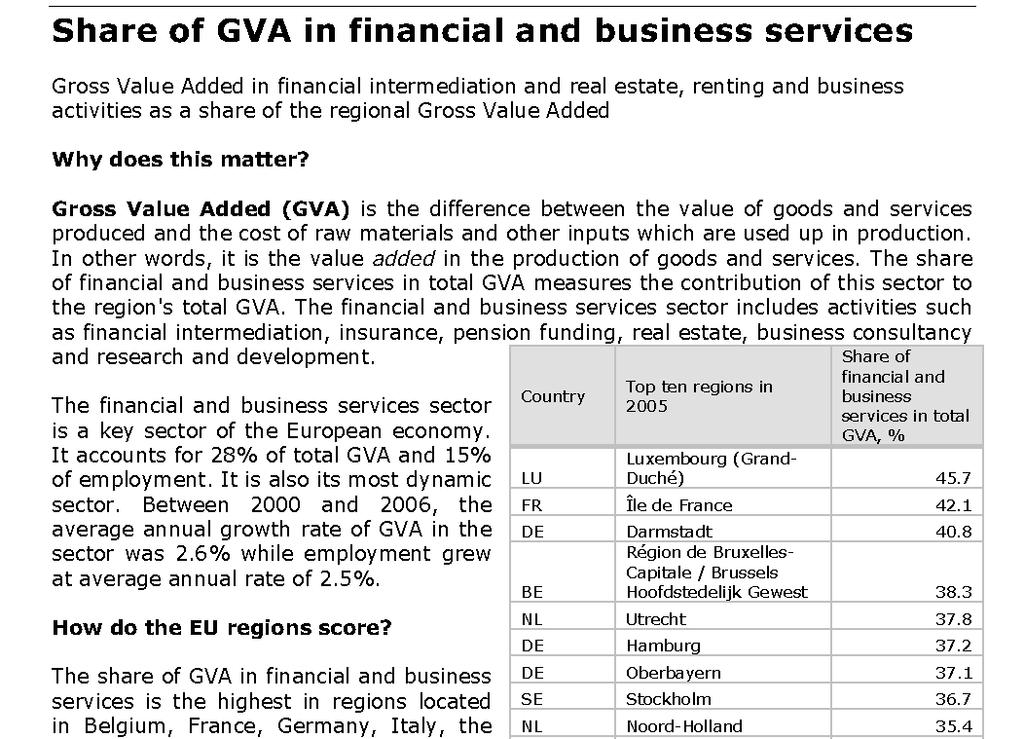
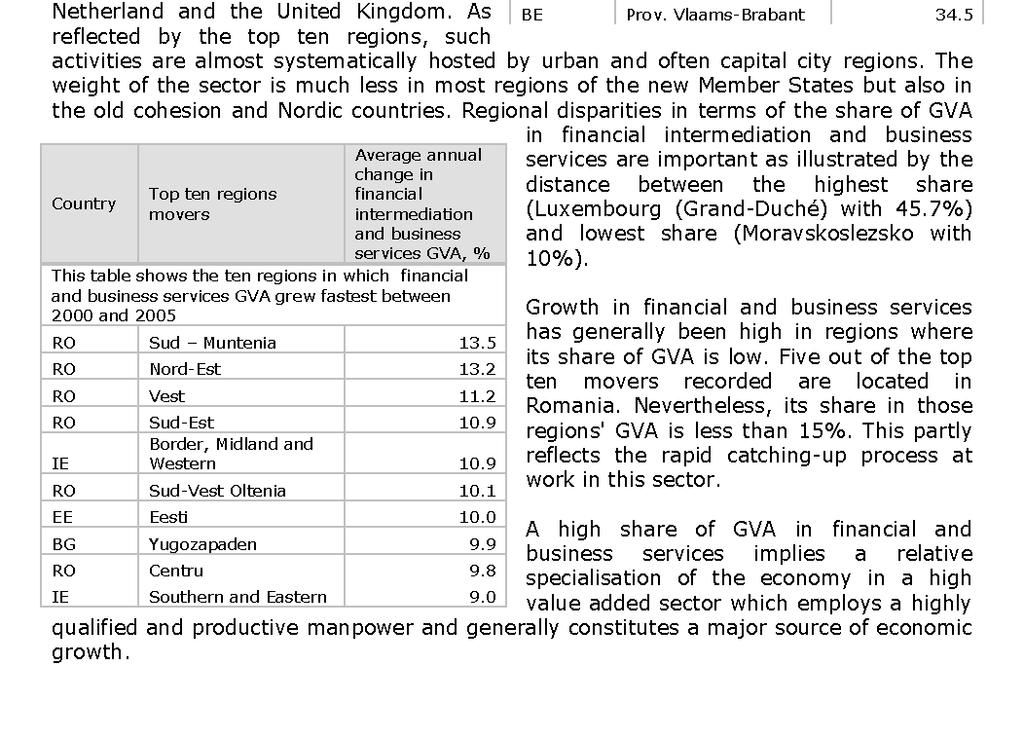
5 2. IDENTIFYING EUROPEAN HIGH GROWTH SECTORS At the national and European level, total employment and GVA can be broken down into 30 1 NACE categories based on the national accounts data. Regional accounts also provides a breakdown of employment and GVA but only in a six sector breakdown for NUTS2 regions. Therefore, growth sectors are first identified at the EU27 level based on the 30 sector breakdown. In a second step, these growth sectors are then related to the six sector breakdown at the regional level. At the European level, several sectors experienced high growth in GVA and/or employment. Figure 2 shows four quadrants according to GVA growth (above and below average) and employment growth (above and below) average. The quadrant where both employment and GVA growth is above the EU average were selected. Two more quadrants were partially considered. In one quadrant, GVA growth was above average but employment growth was below. The sectors where GVA growth was sufficiently high to compensate for lower employment growth or in some cases even employment decline were selected. In the other quadrant employment growth was above average, but GVA growth was below. Again in this quadrant only the sectors where high employment growth compensated for low GVA growth were included as growth sectors. The line on figure 2 shows this distinction. The second step of the selection involved considering whether all these sectors are drivers of economic growth. Two sectors were considered to be more beneficiaries than drivers of economic growth: Activities of households and Health and social work. Activities of households were excluded because it is a very small sector, especially in terms of GVA. The Health and social work sector was excluded as expenditure in this area contributes to well-being, but is not a main driver of the economy. Nevertheless, due to the ageing of the EU population, the Health and Social work sector will continue to grow and cover an important and growing share of total employment. The Education sector, which was not retained as growth sector due to its low GVA growth, is also likely to continue to grow given the increasing importance of education for the competitiveness of the EU, as mentioned in the Communication. The education and the health and social work sector, however, both share the characteristic that their performance cannot be determined from GVA or employment shares or growth. The main goal of these sectors is to increase the health and the education level of the EU's population. Therefore, increases in expenditure and employment in these sectors have to be assessed in the light of these goals. As such an analysis was not feasible within the confines of this communication and they were not included in the analytical section. As a result, nine sectors were identified as EU growth sectors (See Figure 2): Two services sectors with high productivity levels: Business activities (K) and Financial services. (J) 1 One category "Q: Extra-territorial organizations and bodies" was empty both at national and regional levels and has thus been excluded from this analysis. So the breakdown is officially in 17 and 31 categories respectively. To avoid confusion, as the graphs only show 16 and 30 categories, the text refers to 16 and 30 categories. EN 4 EN
6 Three services sectors with either high employment or GVA growth and average productivity: Trade (G); Hotels and restaurants (H); and transport and communication (I) Construction which experienced strong employment growth combined with a fairly strong, but below average, GVA growth (F) Three manufacturing sectors which achieved high GVA growth despite a decline in employment: Chemicals and man-made fibres, Electrical and optical equipment and Transport equipment. These three sectors together constitute the so-called high and medium-high tech manufacturing sector. (DG, DL, DM) In order to fit the format of regional data, these sectors are aggregated under broader categories. The first group falls under the heading Financial and business services (J+K), the second under Trade, transport and communication (G+H+I), and Construction (F) remains (See Figure 1). The fourth group is not identifiable at the regional level. Regional data combines the three manufacturing sectors with all other manufacturing sectors, several of which are in decline (see Figure 2), as well as Mining and Electricity, gas and water supply under the heading Industry (C+D+E). As a result, this aggregate can not be considered as a pure growth sector (See Figure 1). EN 5 EN
7 Figure 1: Table linking the NACE 30 sector breakdown at EU level to the 6 sector breakdown at regional level, identifying growth sectors NACE Code Data at National and European Level Full Name of Sector Productivity (EU27=100) A Agriculture, hunting and forestry 29 B Fishing 66 C Mining and quarrying 216 D Manufacturing 101 DA Manufacture of food products, beverages and tobacco 90 DB Manufacture of textiles and textile products 54 Growth Sector? NACE Code A+B Data at the regional level Growth Full Name of Sector Sector? Agriculture, hunting and fishing No DC Manufacture of leather and leather products 58 DD Manufacture of wood and wood products 64 DE Manufacture of pulp, paper and paper products; publishing and printing 114 DF Manufacture of coke, refined petroleum products and nuclear fuel 415 DG Manufacture of chemicals, chemical products and man-made fibres 205 Y C+D+E Industry In part DH Manufacture of rubber and plastic products 94 DI Manufacture of other non-metallic mineral products 100 DJ Manufacture of basic metals and fabricated metal products 94 DK Manufacture of machinery and equipment n.e.c. 106 DL Manufacture of electrical and optical equipment 108 Y DM Manufacture of transport equipment 120 Y DN Manufacturing n.e.c. 63 E Electricity, gas and water supply 271 F Construction 85 Y F Construction Y G Wholesale and retail trade; repair of motor vehicles, motorcycles and personal and household goods 77 Y G+H+I Y H Hotels and restaurants 66 Y I Transport, storage and communication 122 Y J Financial intermediation 207 Y K Real estate, renting and business activities 189 Y L Public administration and defence; compulsory social security 95 M Education 74 N Health and social work 77 O Other community, social and personal service activities 88 P Activities of households 29 J+K L thru P Trade, transport & communication Financial and business services Other services Y No EN 6 EN

8 Figure 2: Change in GVA and employment by sector in EU27, Change in GVA and employment by sector in the EU27, % Annual Average Change in employment, % 3% 2% 1% 0% -1% -2% -3% -4% EU27 Average change in employment Fishing Manufacture of textiles Manufacture of leather This line shows distinguishes sectors with a combined above average growth on GVA and employment (above the line) from those sectors with a below average growth (below the line) Manufacture of coke, petroleum and nuclear fuel Mining and quarrying Manufacturing n.e.c. Manufacture of wood Manufacture of paper and publishing Agriculture Social and personal services Manufacture of basic metals Hotels and restaurants Education Public administration etc Activities of households Manufacture of food Construction Manufacture of other non-metallic Electricity, mineral products gas and water supply Business activities Health and social work Trade Financial services Manufacture of rubber & plastic products Manufacture of machinery n.e.c. Transport and communication Manufacture of ransport equipment Manufacture of chemicals & man-made fibres Manufacture of electrical and optical equipment -5% -5% -4% -3% -2% -1% 0% 1% 2% 3% 4% 5% Bubble size reflects average employment Annual Average Change in GVA, and GVA share in 2005/2006 EU27 Average change in GVA EU Growth sectors in Green High and medium-high tech manufacturing EN 7 EN
9 3. SOURCES OF DATA AND REFERENCE YEARS The data presented in the fifth Progress Report is derived mainly from three sources: National accounts, Regional accounts and the Labour Force Survey. Due to the different rhythms at which these data sources are updated, the report contains a mix of end years. Below follows an overview of the availability of data by source: (1) National accounts 30 sector breakdown of GVA and employment From this source GVA was available up until 2006, while employment was only available up until 2005 (2) Regional accounts Regional accounts provides data on employment and GVA by sector, population and GDP up until Population and GDP are almost complete with only two new NUTS regions in Northern Scotland missing GVA for the 6 sector breakdown is complete with the exception of the UK Employment for the 6 sector breakdown is complete with the exception of the UK (3) Labour Force Survey This source provides a wide range of data including employment rates, unemployment rates, education levels, knowledge workers and employment by sector. Data is available up until Due to changes in the NUTS boundaries, time series may not cover the entire period Unemployment rate is complete with the exception of two new NUTS regions in Northern Scotland Employment by sector is complete. However to ensure a sufficiently large sample, the average of was used for employment in Trade, Hotels and Restaurants, High and medium-high manufacturing and Knowledge intensive services. Change in employment by sector could not be calculated for the smaller sectors as the changes were almost always within the margin of error. Therefore, national employment data from national accounts was used instead. This is the case for Trade, Hotels and Restaurants and High and medium-high tech manufacturing. Share of Knowledge workers is complete. High Education level is complete 4. DEFINITIONS 4.1. Human Resources in Science and Technology Core The group is defined by the OECD publication: "Manual on the measurement of human resources devoted to S&T "Canberra Manual" 1995 This indicator covers people who have successfully completed education at the third level in an S&T field of study and are employed in an S&T occupation. It is measured as a share of the economically active population. EN 8 EN
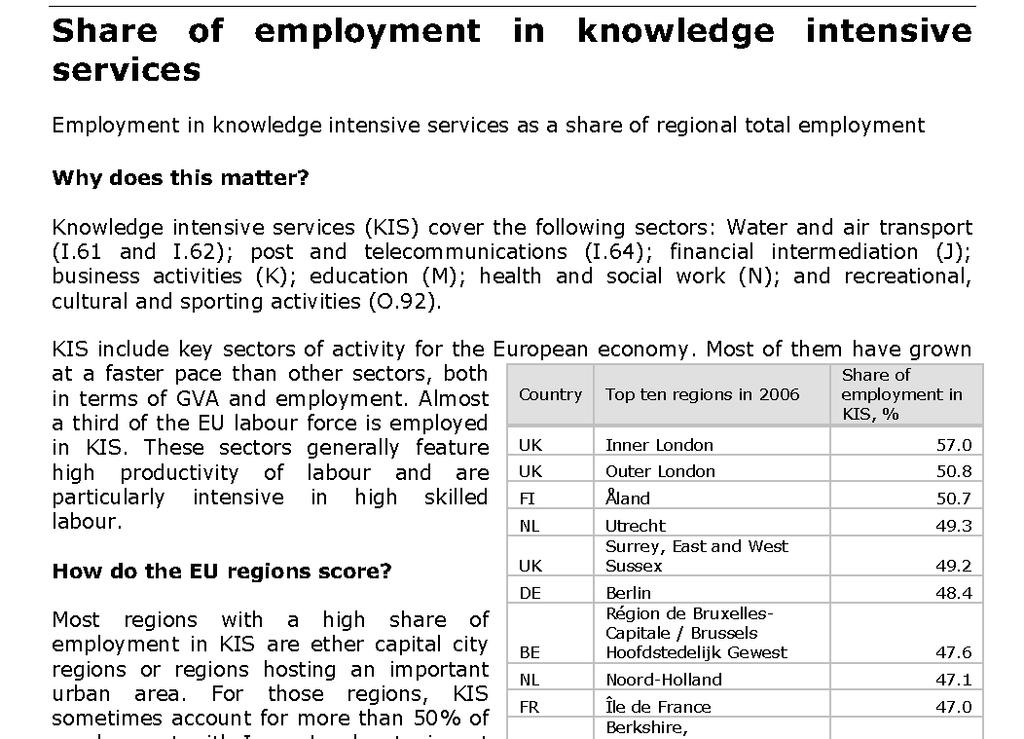
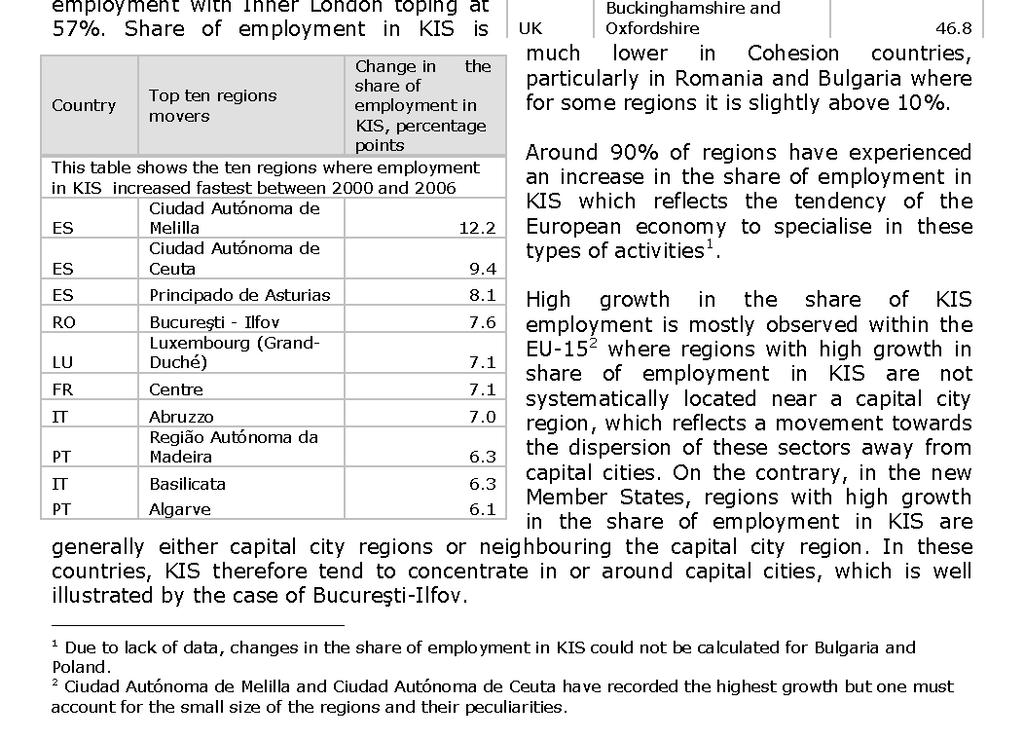
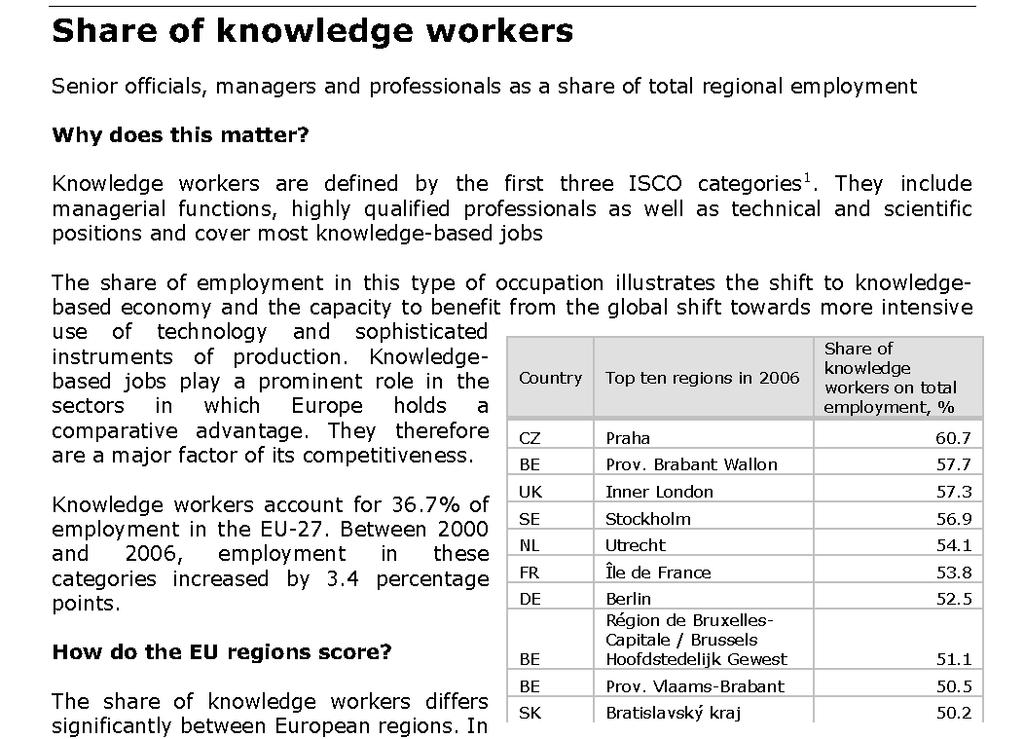
10 4.2. Knowledge Workers This defines employment by the type of occupation in all sectors. It covers the first three classes of the International Standard Classification of Occupations (ISCO) as defined by the International Labour Organisation classification: (1) legislators, senior officials and managers, (2) professionals and (3) technicians and associate professionals High and medium-high tech manufacturing Eurostat defines this group as the following NACE 2 digit codes: 24 Manufacture of chemicals and chemical product, 29 Manufacture of machinery and equipment n.e.c.; 30 Manufacture of office machinery and computers; 31 Manufacture of electrical machinery and apparatus n.e.c.; 32 Manufacture of radio, television and communication equipment and apparatus; 33 Manufacture of medical, precision and optical instruments, watches and clocks; 34 Manufacture of motor vehicles, trailers and semi-trailers; 35 Manufacture of other transport equipment, excluding 35.1 Building and repairing of ships and boats This group can be aggregated to the NACE codes DG, DL and DM with the only issue that it does not excluding 35.1 Building and repairing of ships and boats. This aggregation means that this sector can be identified in the 30 sector breakdown. This is also the definition that was used to measure employment Knowledge intensive services Eurostat defines knowledge intensive services as following: 61 Water transport; 62 Air transport; 64 Post and telecommunications; J: 65 to 67 Financial intermediation; K: 70 to 74 Real estate, renting and business activities; M: 80 Education; N: 85 Health and social work; 92 Recreational, cultural and sporting activities Due to the detailed breakdown of the NACE codes, only employment data based on the LFS is available. GVA can only be provided for a proxy which included 63 (Supporting and auxiliary transport activities; activities of travel agencies) and excludes 92 (Recreational, cultural and sporting activities), which was not used in this report. EN 9 EN
11 EN 10 EN
12 EN 11 EN
13 EN 12 EN
14 EN 13 EN
15 EN 14 EN
16 EN 15 EN
17 EN 16 EN
18 EN 17 EN
19 EN 18 EN
20 EN 19 EN
21 EN 20 EN
22 EN 21 EN
23 EN 22 EN
24 EN 23 EN
25 EN 24 EN
26 EN 25 EN
27 EN 26 EN
28 EN 27 EN