Purpose and Uses of ARMS Data
|
|
|
- Thomasine Camilla Lee
- 5 years ago
- Views:
Transcription
1 Purpose and Uses of ARMS Data Kevin L. Barnes Director, Western Field Operations USDA NASS James MacDonald USDA Economic Research Service ARMS Phase III National Workshop January 11, 2017 St Louis, Missouri

2 Challenge Facing ARMS Getting respondent cooperation
3 Challenge Facing ARMS
4 Can you answer questions from respondents? Who uses the data? What benefit is in it for me? How long will this take? Why are the questions so invasive? Why do you need my information?
5 Uses Outside USDA University Extension Congressional Information State Departments of Agriculture Independent Research Entities Media articles Data Requests Social Media
6 Research Organizations

7 Federal Reserve Federal Reserve --

8 State Departments of Agriculture Oregon State:
9 State Departments of Agriculture

10 State Departments of Agriculture

11 Influence on Policy

12 Influence on Policy

13 Influence on Policy
14 Influence on Policy USDA to Measure Financial Well-Being of the Dairy Sector The results of the 2016 ARMS will help USDA and other policymakers analyze the impacts of the new Dairy Margin Protection Program, introduced in the Agricultural Act of With operational costs driving structural changes within the dairy industry, this new program aims to help dairy producers when milk prices drop and feed prices remain high. USDA launched the program in 2015, making the current survey crucial to measuring its initial effects.
15 Influence on Policy The Idaho dairy industry in Idaho is comprised of both milk producers and milk processors and has experienced significant growth in the past three decades The Idaho dairy industry is now a mature industry cluster and major contributor to the state s economy. Using government and proprietary data to create an economic base model which captures the linkages between the dairy industry and the state s economy, we calculate the economic contributions of Idaho s dairy industry and found: The dairy industry supported 23,000 jobs and $6.6 billion of economic output across the entire Idaho economy in The dairy industry contributed over $2.2 billion to the state s gross domestic product. The dairy industry generated over $2.5 billion in domestic and foreign exports (sales outside of the state) which represents new dollars injected into the state s economy in In terms of economic output, the dairy industry represents 30% of the agricultural sector in Idaho.
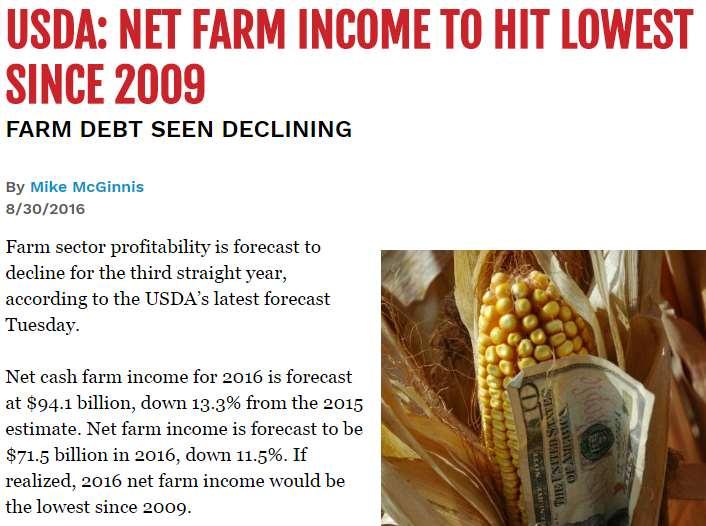
16 Media Articles Successful Farming Magazine


17 Social Media Facebook Twitter
18 Major ERS Uses of ARMS Data Financial reporting & other data releases On farm sector, farm businesses, farm households Via ERS webinars, web data-tool, & postings ERS reports on policy-relevant issues Posted on website and available to all ERS custom reports (staff analyses) Unpublished, for policymakers; Quick turnaround

19 ARMS Uses: Financial reporting Net cash income forecast to fall 14.4% from 2015 Note net farm income vs. net cash income Net farm and net cash hit records in 2013
20 ERS Farm Financial Reporting That s the 2016 forecast. ERS also provides estimates of what did happen. For the headline numbers, as well as for component expense and revenue items. For farm sector, and breakouts ARMS provides about ¾ of the data used in the farm sector accounts.


21 ARMS Detail Allow Us to Break Down Changes in Net Farm Income Notice: declining cash receipts, from falling commodity prices, drive this decline But prices haven t fallen enough to trigger large increases in government payments

22 ARMS Supports Forecasts for Regions Net cash income is forecast to fall in all regions but the Mississippi Portal, but there s substantial variation.

23 Compare to Particularly the Northern Great Plains, Prairie Gateway, and Mississippi Portal What happened? Drought, but price increases and crop insurance offset production declines for crops. Livestock hit by drought and feed price increases.

24 We can focus in on farms that are highly leveraged
25 Input providers Who Wants This Information? Not Just Policymakers Cash income drives equipment purchases. What will equipment/chemical/seed/feed demand look like? Lenders & Investors What are the risks? What guidelines should I use? Poor information is worse than pessimistic info Extension and farm advisors They are how information and advice get to farmers
26 Use in Policymaking Congress, USDA, and others use ARMS-based data Including National Corn Growers, American Soybean Association, National Pork Producers, American Farm Bureau, and other farm groups Easy access to fundamental & detailed finance data ERS reports are widely available; Congress and USDA also ask for custom reports Informs Farm Bill discussions, & implementation And other agriculture-related policy
 How tax proposals work 2) Full impacts of farm policies 3) How changes in the farm economy from crop prices, drought, an export boom--affect farm households")
27 ERS Also Uses ARMS to Estimate Farm Household Income Net of farm expenses, and including income from off-farm sources Provides a direct measure of how farmers are doing, not just farm businesses Household income needed to assess: 1) How tax proposals work 2) Full impacts of farm policies 3) How changes in the farm economy from crop prices, drought, an export boom--affect farm households

28 Farms vary a lot; detail, provided by ARMS, matters Residence farms: farming is not the principal occupation, & sales are less than $350,000 Intermediate farms: farming is the principal occupation, & sales are less than $350,000 Commercial farms: sales of at least $350, percent of U.S. farms are commercial, while 31 percent are intermediate and 59 percent are residence farms
29 Household Data Use: Income Volatility Farm household income = farm + off-farm income Farm income is share of farm-related net income that goes to principal operator s household (can be negative) Off-farm income includes off-farm wages and salaries, other business income, capital gains, and transfers to the household Farm households face greater income risk than non-farm households: Fluctuations in yields, prices, land rents, input prices (business risk) Rare events such as disease, droughts, flooding (production risk) Changes in government policies Farm households experience a median change 8 times greater than non-farm households
30 Farm incomes are volatile Farm Income $250,000 $200,000 $150,000 $100,000 $50,000 $0 -$50,000 The average across all farms seems to rise steadily. But individual farms show great volatility, with losses in some years, and wide swings. -$100, Median Income, All Commercial Farms Typical Commercial Farm This is net income from farming, for commercial farms (at least $350,000 in sales).
31 Why Does Risk & Income Volatility Matter? For design of farm programs: Consider the shift away from direct payments and toward crop insurance and other risk-based policies. Has policy played a role in declining volatility? The fact of high income volatility affects how we design other policies Such as tax & conservation policies Income risks affect farmer decisions Planting, fertilizer use, capital investments
32 Uses: ARMS in National Economic Accounts ERS farm income estimates enter into: National Economic (GDP) accounts State Personal Income & Local Area Income estimates GDP estimates used for national economy measurement and policymaking Farm income is small share of national GDP But an important source of year-to-year variation
33 ARMS Uses: State & Local Income Estimates Formula allocation of federal funds Medicaid, Supplemental Security Income Agricultural research & extension, USDA ag lending Local planning of public investment Public utilities, highways, hospitals Private investment Local retail & wholesale facilities

34 From U.S. Farmland Ownership, Tenure and Transfer: 10 percent of US Farmland expected to transfer in From 2014 ARMS/TOTAL. First landownership survey since Identified ownership patterns, rental arrangements, methods of land acquisition. Things we learned:
 cases (2010 and 2016), gains reductions in Chinese poultry")
35 Example of a custom report: ARMS data used to support market access for US poultry. China imposes tariffs on imports of US poultry products, on grounds that US government subsidizes production. US government uses ARMS data and ERS reports to show how broiler production is organized and financed US wins World Trade Organization (WTO) cases (2010 and 2016), gains reductions in Chinese poultry tariffs
36 A Summary: Major Uses/Users of ARMS data are Farm Financial (Net Farm Income) reporting and forecasts Custom Reports for policy makers who affect farmers everyday Special Reports that answer questions on current hot topics Major information source for Farm Bills and Ag Policy Agricultural Component of GDP Part of Formulas to Allocate Tax Dollars Crop Insurance and Disaster damage estimates Lenders, Manufacturers, Suppliers, & Retailers decisions Farm Commodity groups, for analysis and advocacy Data Summaries Available to all through the web tool
37 Why is ARMS Valuable? It s Representative, Comprehensive, Objective Links Enterprise, Whole Farm, & Household Tracks Income Statement & Balance Sheet Items Links to production and marketing decisions
38 That Value Comes from a Full Team ERS Objective analyses & economic expertise NASS Survey design, management, & production expertise NASDA enumerators Producer cooperation & guidance, ground truthing Producers Time, knowledge, thoughtfulness
39 Policymakers Policy Decisions Will be Made with or Without ARMS Some have farm backgrounds, most don t Those that do can t just rely on background, experience They re all busy, so they rely on others for information ARMS provides accurate data on U.S. agriculture Better information makes for better decisions
40 Can you answer questions from respondents? Who uses the data? What benefit is in it for me? How long will this take? Why are the questions so invasive? Why do you need my information?
41 Thank You!