WORLD S LEADING ANIMAL PROTEIN PRODUCER. Beef Market Update. October 3, 2018
|
|
|
- Denis Parker
- 5 years ago
- Views:
Transcription


1 WORLD S LEADING ANIMAL PROTEIN PRODUCER Beef Market Update October 3, 2018


2 Beef market update The US cattle inventory continues to expand but at a slow rate as more females have moved to slaughter Cattle on feed inventories remain record large as placements have stayed above one year ago Slower fed cattle slaughter has kept the inventory of marketready cattle ample Cattle weights have stayed close to one year ago Beef production has been constrained somewhat due to slaughter capacity and labor availability Choice & prime grading has stayed close to last year s level Consumer demand has been excellent and has been the market driver demand has been boosted by a positive economic outlook Beef export demand continues to show double digit growth in 2018 African Swine Fever, trade disputes, and trade agreements have dominate the news 2


3 Drought monitor & 90 day precip departure from normal 3
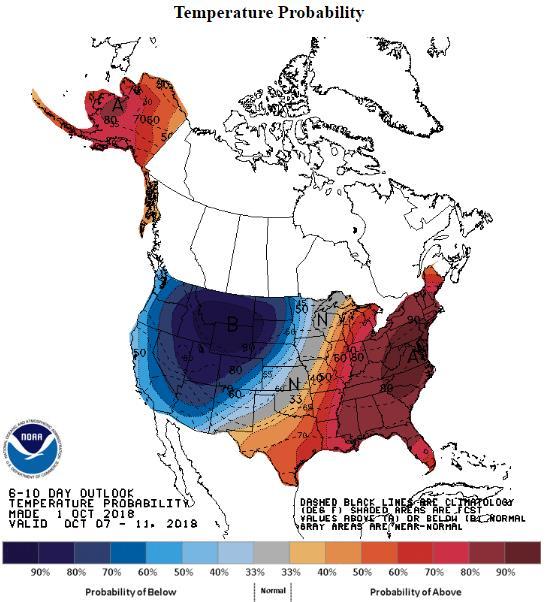
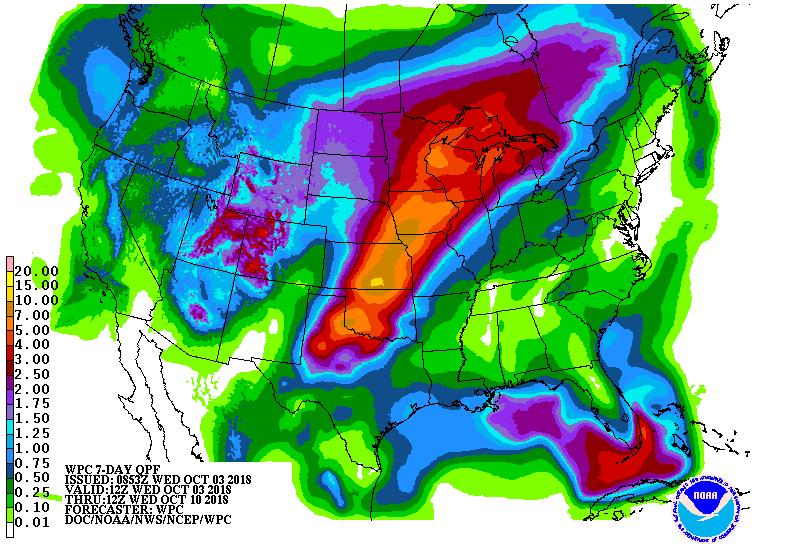
4 7 day precipitation and 6-10 day temperature 4
5 Retail sales percent change year ago Advanced Retail Sales - Percent Change Year Ago (%) 12.00% 10.00% Food Services and Drinking Places Grocery Stores 10.1% 8.00% 6.00% 4.8% 4.00% 2.00% 0.00% 5
6 Jan-12 Jul-12 Jan-13 Jul-13 Jan-14 Jul-14 Jan-15 Jul-15 Jan-16 Jul-16 Jan-17 Jul-17 Jan-18 Jul-18 Real expenditures 6.0% 5.0% 4.0% 3.0% 2.0% 1.0% 0.0% Personal Consumption Expenditure (% Change Y/Y) % y/y Aug-18 PCE 3.0% Retail 3.9% Food service 5.5% -1.0% PCE Food-Retail Food Service - Meals & Beverages -2.0% 6
7 2018 year-to-date summary Year to date Difference % 18/17 Cattle Slaughter (k head) 23,678 24, % Weights (pounds) % Production (m pounds) 19,195 19, % Exports (m pounds) 1,572 1, % Jan-July Imports (m pounds) 1,813 1, % Jan-July Steer Price ($/cwt) (4.9) -4.0% Comprehensive Cutout ($/cwt) % 7
8 2018 year-to-date summary by class Year to date Difference % 18/17 Cattle Slaughter (k head) 23,678 24, % Steers & Heifers 18,991 19, % Cows + Bulls 4,687 5, % Below lags 2 weeks Steers 12,057 11,908 (148) -1.2% Heifers 5,902 6, % Percent heifers 32.9% 34.8% 1.9% Dairy Cows 2,117 2, % Beef Cows 1,923 2, % Total Cows 4,039 4, % 8
9 COLD STORAGE 9
10 Cold storage stocks by species 1,000,000 Beef, Pork, Chicken & Turkey Stocks (m pounds) 900, , , , , , , , ,000 0 Pork Beef Chicken Turkey 10
11 Cold storage stocks by species 3,000,000 Beef, Pork, Chicken & Turkey Stocks (m pounds) 2,500,000 2,000,000 1,500,000 1,000, ,000 0 Pork Beef Chicken Turkey 11
12 Boneless beef stocks 550 Boneless Beef Stocks (million pounds) 500 Boneless Beef Stocks (million pounds) Jan Feb Mar Apr May June Jul Aug Sep Oct Nov Dec Avg End of August boneless beef stocks were 459 million pounds up 5% from one year earlier Boneless beef stocks increased by nearly 15 million pounds in August The five-year average movement in August is million pounds 12
13 Beef cut stocks Beef Cut Stocks (million pounds) Jan Feb Mar Apr May June Jul Aug Sep Oct Nov Dec Beef Cut Stocks (million pounds) Avg Beef cut stocks at the end of August were 45 million pounds up 19% from one year earlier Beef cut stocks increased by nearly 5 million pounds in August well above the average movement of -1.4 million pounds 13
14 CATTLE ON FEED 14
15 Cattle on feed Cattle on Feed Sep 1 Sep 1 Head % (1000 head) Year Ago Yr Ago AZ % CA % CO % ID % IA % KS 2,220 2, % MN % NE 2,150 2, % OK % SD (15) 93.0% TX 2,590 2, % WA % 11,500 11,000 10,500 10,000 9,500 9,000 Sept 1 - US Total Cattle on Feed Inventory (1000 head) 5.3% -0.5% 3.6% 2.8% -3.0% 2.7% 1.5% -1.1% -7.5% -1.3% 5.9% Other States % 8,500 US 10,504 11, % Trade estimate 11, % IA+MN+SD 975 1, % IA+MN+NE+SD 3,125 3, % OK+TX 2,905 3, % 8, Avg 15
16 Cattle on feed top 5 states & Far West Cattle on Feed - CO, KS, NE, TX & OK (1000 head) Cattle on Feed - AZ & CA (1000 head) 9, ,000 8, , ,400 8, , ,800 7,600 Jan Feb Mar Apr May Jun Jul Aug Sep Oct Nov Dec Ag 600 Jan Feb Mar Apr May Jun Jul Aug Sep Oct Nov Dec Ag September 1 cattle on feed in the 5-state area were 8,540k head - up 5.0% or 405k head from year prior Arizona and California cattle on feed were up 156k head or 23.5% from last year s level 16
17 Cattle on feed share by state groups evolution 35.0% Cattle on Feed - State Group Shares (% of total) 30.0% 25.0% 20.0% 15.0% 10.0% Share of Cattle on Feed Inventory AZ+CA IA+MN+NE+ SD KS OK+TX 5 Area Sep % 29.2% 20.0% 27.8% 77.0% Sep % 31.1% 19.5% 27.8% 77.3% Sep % 31.7% 19.3% 26.9% 76.1% Sep % 29.9% 20.8% 27.7% 77.0% Sep % 29.8% 21.1% 27.7% 77.4% Sep % 30.0% 20.8% 27.0% 76.8% 5.0% 0.0% Jan-13 Jan-14 Jan-15 Jan-16 Jan-17 Jan-18 AZ+CA IA+MN+NE+SD KS OK+TX The most noticeable share increase has been in Arizona and California 17
18 Cattle on feed >120 days August 1 - Cattle on Feed >120 Days (1000 head) 3,800 3,600 3,607 3,640 3,400 3,200 3,000 2,800 2,862 2,889 3,011 3,045 2,789 3,058 3,270 3,072 3,154 2,600 2,400 2,384 2,200 2, Avg September 1 cattle on feed >120 days were 3,640k head - up 18.5% or 568k head from year prior 18
19 August cattle placements August Placements (1000 Head) 2,400 2,200 2,000 1,800 2,061 2,109 2,283 2,191 2,007 1,777 1,725 1,879 1,928 2,070 1,804 1,632 1,600 1,400 1,200 1, Avg August placements were 2,070k head up 142k head or 7.4% from one year earlier August placements were up 5.3% from the five-year average 19
20 Placement evolution Placements - Change from Year Prior (1000 head) % 13.9% 10.2% % 0.8% 4.4% 7.3% 0.2% 1.3% 7.9% 7.4% % -8.3% 20
21 Cattle placements USDA vs Trade 200 Placements - USDA less Trade Average (1000 head) Placements continue to come in above the trade average estimate The last time placement were below the trade average guess was for the July 2017 placement estimate) 21
22 August placements weights % Placements by Weight Category (1000 head) -2.1% 10.0% 17.5% -11.1% Placements by weight Head % (1000 head) Year Ago Yr Ago < 600 lbs % lbs % lbs % lbs (10) -2.1% lbs (30) -11.1% >1000 lbs % Total 1,928 2, % % Avg Placement Wgh (10) 98.7% < 600 lbs lbs lbs lbs lbs >1000 lbs Placements continue to be skewed toward the lighter weight categories 22
23 SUPPLY, DEMAND & PRICES 23
24 FI steer weights 910 FI Steer Dressed Weights (pounds) During week ending September 15, FI steer weights were 896 pounds unchanged from week prior and down one pound from one year ago Avg Steer weights were expected to gain 2 to 3 pounds week-on-week 24
25 US cattle slaughter 680 FI Cattle Slaughter (1000 head) Avg Last week s cattle slaughter was 650k head up 0.4% from one year earlier During the last four weeks, cattle slaughter was up 1.5% from the year prior s level Year to date, cattle slaughter was up 2.7% with the 2017 level 25
26 US steer & heifer slaughter 550 FI Steer & Heifer Slaughter (1000 head) Avg 350 Last week, steer & heifer slaughter was 518k head down 1.0% from one year earlier During the last the four weeks, fed slaughter was up 0.5% from year prior and was up 1.7% year-to-date 26
27 US cow & bull slaughter 140 FI Cow + Bull Slaughter (1000 head) Avg 80 Last week, cow & bull slaughter was 132k head up 6.2% from one year earlier During the last the four weeks, cow & bull slaughter was up 5.5% from year prior and was up 6.7% year-to-date 27
28 Cash cattle prices Market Cash Steers ($/cwt) Avg Last week, the weekly average cash steer price decreased to $ per cwt up $0.04 per cwt from the previous week and up 2.4% from last year s level 28
29 Comprehensive cutout export volume 1750 Loads Sold - Total Export (loads) Avg Last week, export sales volume decreased from week prior and were down 20.3% from last year s figure During the last four weeks, total export sales volume was down 12.4% from last year s level 29
30 USDA/FAS Export outstanding sales Beef Export Sales (1000 mt) Outstanding sales (mt) as of Sep % YOY CANADA 4,467 7, % CHINA % HONG KONG 19,616 31, % JAPAN 25,540 35, % SOUTH KOREA 26,371 29, % MEXICO 11,828 13, % PHILIPPINES 1,100 1, % TAIWAN 9,670 8, % OTHER 4,381 7, % KNOWN 103, , % During the week ending September 20, net sales were 16.0 kmt unchanged from last year s level During the last four weeks, total beef net export sales were up 36% from year prior Outstanding sales were up 32% from last year s level 30
31 Comprehensive cutout 245 Comprehensive Cutout ($/cwt) Avg Last week, the comprehensive cutout decreased to $ down $0.98 from week prior and up 3.4% from one year ago 31
32 Choice primal prices Rib Primal ($/cwt) Chuck Primal 9$/cwt) Avg Round Primal ($/cwt) Avg Avg Loin Primal ($/cwt) Avg 32
33 Choice primal prices, grinds and trim Brisket Prmal ($/cwt) Beef 50s ($/cwt) Avg Avg 250 Beef 90s ($/cwt) 250 Ground Beef 81% Lean ($/cwt) Avg Avg 33
34 Choice + Prime & Select Grading Percent Prime + Choice Grading Avg Percent Select Grading Avg The percent prime + choice increased week-on-week and was below last year s level (percent) 9/22/18 9/15/18 9/23/17 Prime Choice Prime + Choice Select No roll
35 Jan-98 Jan-99 Jan-00 Jan-01 Jan-02 Jan-03 Jan-04 Jan-05 Jan-06 Jan-07 Jan-08 Jan-09 Jan-10 Jan-11 Jan-12 Jan-13 Jan-14 Jan-15 Jan-16 Jan-17 Jan-18 Prime + Choice grading 85.0% USDA Steer & Heifer Prime + Choice Grade (percent) 80.0% 75.0% 70.0% 65.0% 60.0% 55.0% 50.0% 45.0% Prime + Choice % 52 Week Average 35
36 Choice Select spread 35 Choice-Select Spread ($/cwt) Avg The choice-select spread gained ground last week 36
37 Branded programs- percent of weekly volume 25.5% Branded Volume % of Total 23.5% 21.5% 19.5% 17.5% 15.5% 13.5% 11.5% 9.5% 7.5% Jan-10 Jan-11 Jan-12 Jan-13 Jan-14 Jan-15 Jan-16 Jan-17 Jan-18 Branded Volume % of Total 52 week avg 37