Marketing Corn and Soybeans During the Growing Season Quarterly Zoom Marketing Meeting, June 13, 2018
|
|
|
- Ethel Rose
- 5 years ago
- Views:
Transcription
1 Marketing Corn and Soybeans During the Growing Season Quarterly Zoom Marketing Meeting, June 13, 2018 Dr. S. Aaron Smith Crop Marketing Specialist, Assistant Professor, and Extension Economist Department of Agricultural and Resource Economics University of Tennessee Institute of Agriculture Crop Economics
2 Overview Current market factors Quick supply and demand update Corn pricing Soybean pricing
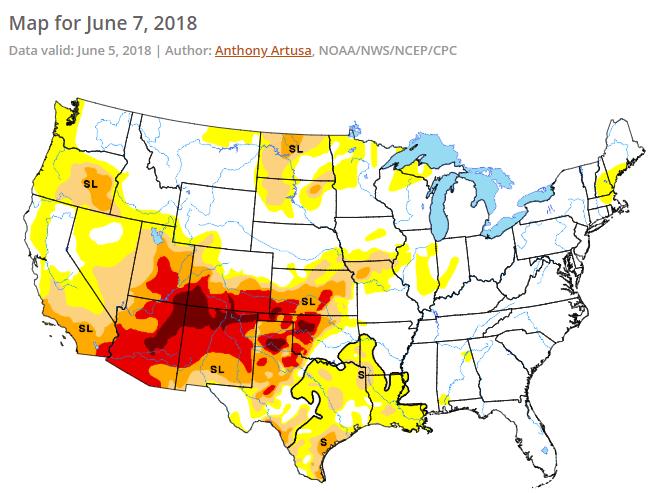
3 Current Market Factors Bullish Global demand Domestic demand Argentina's smaller crop Global economic expansion Bearish USD strength Interest rates Weather to date Unknown Trade (China, NAFTA, and other) Currency exchange (Brazil, Argentina) Weather moving forward
4
5
6
7 Within the last 2 weeks U.S. Trade War with China Joint Statement of the U.S. and China Regarding Trade Consultations Hold on Tariffs. Deal to lift sanctions on Chinese telecom giant ZTE. China announced previously promised cut in tariffs on imported cars and auto parts. China scrapped an ongoing antidumping investigation on U.S. sorghum. President - Tweeted massive amounts of agricultural product will be flowing to China one of the best things to happen to our farmers in many years. The White House walked back the on hold declarations on the $50 billion in tariffs on Chinese goods; announced tariffs will be imposed June 30 th, final list to be announced by June 15. Source: Muhammad SEEC Presentation
8 Corn Supply and Demand June WASDE 2018/19 Projected May 2018/19 Projected June Change Previous Month Change Previous Year 2014/ / / /18 Est. Planted and Harvested Acres & Yield Acres Planted (Million) Acres Harvest (Million) U.S. Yield (Bu/Acre) Supply (Million Bushels) Beg. Stocks 1,232 1,731 1,737 2,293 2,182 2, Production 14,216 13,602 15,148 14,604 14,040 14, Total Supply 15,479 15,401 16,942 16,942 16,272 16, Use & Ending Stocks (Million Bushels) Feed and Residual 5,280 5,114 5,472 5,500 5,375 5, Ethanol 5,200 5,224 5,432 5,575 5,625 5, Food, Seed & Industrial 1,401 1,424 1,451 1,465 1,490 1, Exports 1,867 1,901 2,293 2,300 2,100 2, Total Use 13,748 13,664 14,649 14,840 14,590 14, U.S. Ending Stocks 1,731 1,737 2,293 2,102 1,682 1, Foreign Stocks 6,529 6,685 6,664 5,484 4,583 4, Price and Stocks to Use Ratio U.S. Avg. Price ($/Bu) $3.70 $3.61 $3.36 $3.25-$3.55 $3.30-$4.30 $3.40-$4.40 $0.00 $0.40 U.S. Stocks/Use 12.59% 12.71% 15.65% 14.78% 11.53% 10.79% -0.7% -3.99%
9 Planted (million acres) Brazilian Corn Acres Planted, 2000/01 to 2017/ nd Crop Corn st Crop Corn Source: CONAB 12.51


10 Timing the Brazilian crop makes it to the global market.
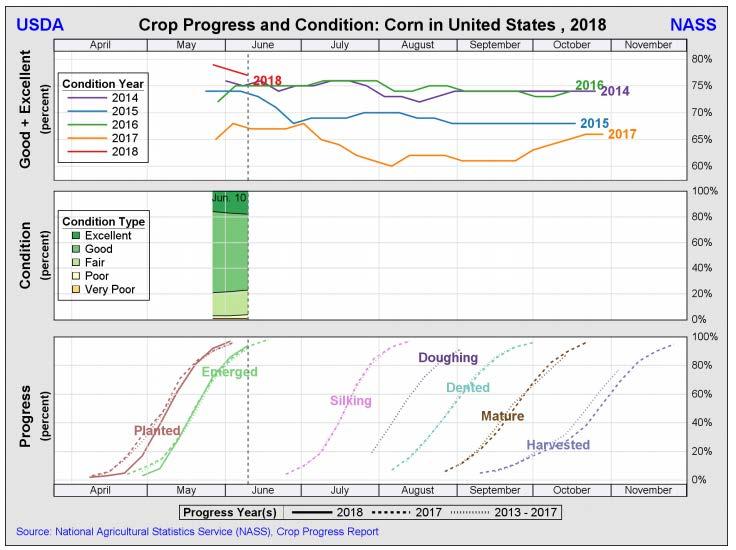
11 December Corn Futures and Tennessee Production Stages 550 Pre-planting Planting & Emergence Tassel, Pollination, & Silk Dough, Dent, & Mature Harvest Post-Harvest Price (cents/bu) Jan 1-Feb 1-Mar 1-Apr 1-May 1-Jun 1-Jul 1-Aug 1-Sep 1-Oct 1-Nov 1-Dec
12 Continued volatility driven by weather and trade uncertainty!
13 0.40 Monthly Average Corn Basis, Basis ($/bu) Jan Feb Mar Apr May Jun Jul Aug Sep Oct Nov Dec Memphis Lower-Mid
14 Corn - Net Return Table ($/acre) $550 Cost of Production Yield (bu/acre) (350) (330) (310) (290) (270) (250) (230) (210) (190) (170) (150) 2.25 (325) (303) (280) (258) (235) (213) (190) (168) (145) (123) (100) 2.50 (300) (275) (250) (225) (200) (175) (150) (125) (100) (75) (50) 2.75 (275) (248) (220) (193) (165) (138) (110) (83) (55) (28) (250) (220) (190) (160) (130) (100) (70) (40) (10) (225) (193) (160) (128) (95) (63) (30) (200) (165) (130) (95) (60) (25) Price 3.75 (175) (138) (100) (63) (25) ($/bu) 4.00 (150) (110) (70) (30) (125) (83) (40) (100) (55) (10) (75) (28) (50) (25)
15 Soybean Supply and Demand June WASDE 2018/19 Projected May 2018/19 Projected June Change From Previous Month Change 2017/18 to 2018/ / / / /18 Est. Planted and Harvested Acres & Yield Acres Planted (Million) Acres Harvest (Million) U.S. Yield (Bu/Acre) Supply (Million Bushels) Beg. Stocks Production 3,927 3,926 4,296 4,392 4,280 4, Total Supply 4,052 4,140 4,515 4,718 4,835 4, Use & Ending Stocks (Million Bushels) Crushing 1,873 1,886 1,901 2,015 1,995 2, Exports 1,842 1,942 2,174 2,065 2,290 2, Seed and Residual Total Use 3,862 3,944 4,213 4,213 4,420 4, U.S. Ending Stocks Foreign Stocks 2,658 2,687 3,240 2,893 2,771 2, Price and Stocks to Use Ratio U.S. Season Price ($/bu) $10.10 $8.95 $9.47 $9.40 $8.75-$11.25 $8.75-$11.25 $0.00 $0.60 U.S. Stocks/Use 4.95% 4.99% 7.17% 12.66% 9.39% 8.70% -3.27% -3.95%

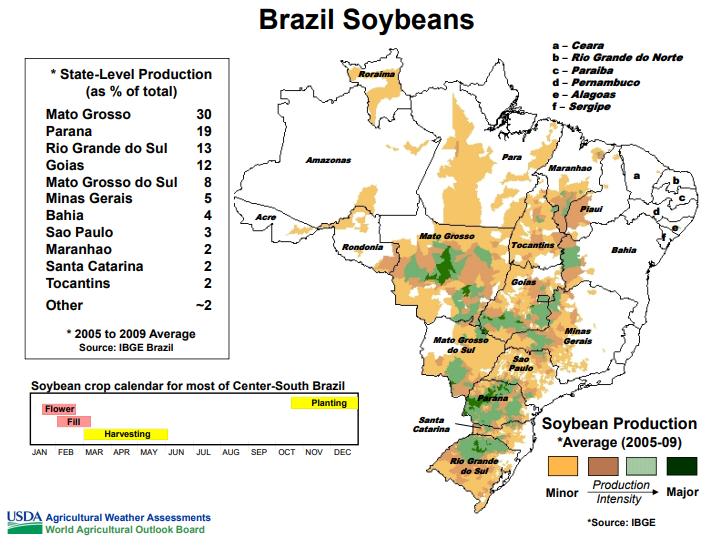
16 Argentina will continue to reduce its soybean export tax despite their planned efforts to enact deficit cuts under its $50 billion funding deal with the IMF.
17

18 U.S. soybean exports by destination market: 2017 (Total exports = $21.6 billion)

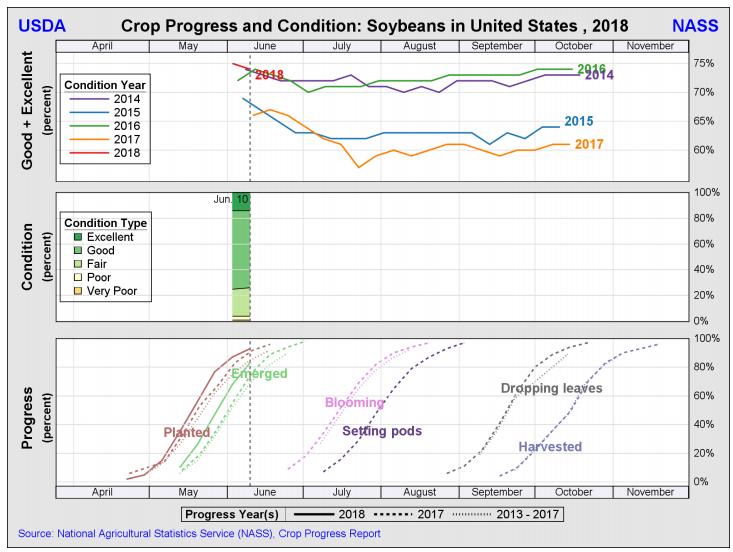
19 Price (cents/bu) November Soybeans Futures and Tennessee Production Stages Pre-Planting Planting & Emergence Blooming & Setting Pods Dropping Leaves & Mature Harvest & Post- Harvest Jan 1-Feb 1-Mar 1-Apr 1-May 1-Jun 1-Jul 1-Aug 1-Sep 1-Oct 1-Nov

20 $0.95 Decline in 2+ weeks
21 0.30 Tenessee Soybean Basis Price ($/bu) (0.10) Jan Feb Mar Apr May Jun Jul Aug Sep Oct Nov Dec (0.20) (0.30) Northwest Lower-mid
22 Soybean - Net Return Table ($/acre) $415 Cost of Production Yield (bu/acre) (265) (228) (190) (153) (115) (78) (40) (3) (260) (221) (183) (144) (105) (66) (28) (255) (215) (175) (135) (95) (55) (15) (250) (209) (168) (126) (85) (44) (3) (245) (203) (160) (118) (75) (33) (240) (196) (153) (109) (65) (21) (235) (190) (145) (100) (55) (10) Price 9.25 (230) (184) (138) (91) (45) ($/bu) 9.50 (225) (178) (130) (83) (35) (220) (171) (123) (74) (25) (215) (165) (115) (65) (15) (210) (159) (108) (56) (5) (205) (153) (100) (48) (200) (146) (93) (39) (195) (140) (85) (30) (190) (134) (78) (21)
23 So Now What? Stay the course Do not make a hasty decision (avoid emotional decisions) Now is not the time to rush into the market Stick with you marketing plan Crop insurance/forward pricing/harvest sales/storage Know your cost of production and how it changes through the season (simple matrix) Know your local basis and harvest basis June 29 Acreage Report could be interesting Evaluate opportunities should they present themselves
24 Crop Economics: Questions? THANK YOU!