Sustainability metrics associated with product quality and land use.
|
|
|
- Marcus Lane
- 5 years ago
- Views:
Transcription


1 Global Conference on Sustainable Beef Kilkenny, October 2018 Sustainability metrics associated with product quality and land use. M.R.F. Lee, T. Takahashi, G.A. McAuliffe, J.P. Domingues and M. Tichit
2 Global Challenges for Food Security Increasing population Increasing urbanisation Climate change Soil health Demand for animal protein
3 Population Year AD 2050 Now 2000 Billions

4 Global mean warming 2.8 o C Much of land area warms by 3.5 o C Arctic warms by 7 o C

5
6 Understanding soil health Evidence for a link between soil structure and nutrient use efficiency (e.g. exoenzymes, assimilation vs. dissimilation) Soil microbiomes are sensitive to soil management (at multiple levels) and adapt and self-manage in response Soil connected porosity controls diffusion, imposing constraints upon respiration and metabolism - but areas of low diffusion may be advantageous for exoenzyme activity modelling of exoenzyme efficiency in these soil structures is underway


7 Gene Abundance d crit =3µm d crit =7µm d crit =10µm Pore Topology Bare Fallow Arable Grassland HIGH diffusive flow LOW Exoenzyme Secretion HIGH LOW Cell Motility Anaerobic Respiration Anaerobic metabolism of aromatic compounds

8 Increasing Demand for Meat
9 Extra Planets?
10 Global Warming potential mass based assessment (CO2eq/kg product)
11 Accounting for nutritional quality: e.g. omega-3 Most livestock LCA studies treat the end product (meat) as a homogenous good but... Species System Study Omega-3 DHA + EPA (mg/100 g meat) (mg/100 g meat) ω-6:ω-3 Beef Concentrate Warren et al Forage (2008a) Chicken Intensive Givens et al Free range (2011) Lamb Lowland Whittington et al Upland (2006) Pork Intensive Enser et al. (1996) Grass-based beef production systems produce meat that has: Higher omega-3 fats Lower omega-6:omega-3 ratios Higher levels of vitamin E
12 Accounting for nutritional quality: omega-3 Species System Mass-based GWP (kg CO 2 -eq/kg meat) Quality-based GWP (kg CO 2 -eq/g omega-3) Quality-based GWP (kg CO 2 -eq/g DHA + EPA) Beef Concentrate Forage Chicken Intensive Free range Lamb Lowland Upland Pork Intensive McAuliffe et al. (2018) Food and Energy Security
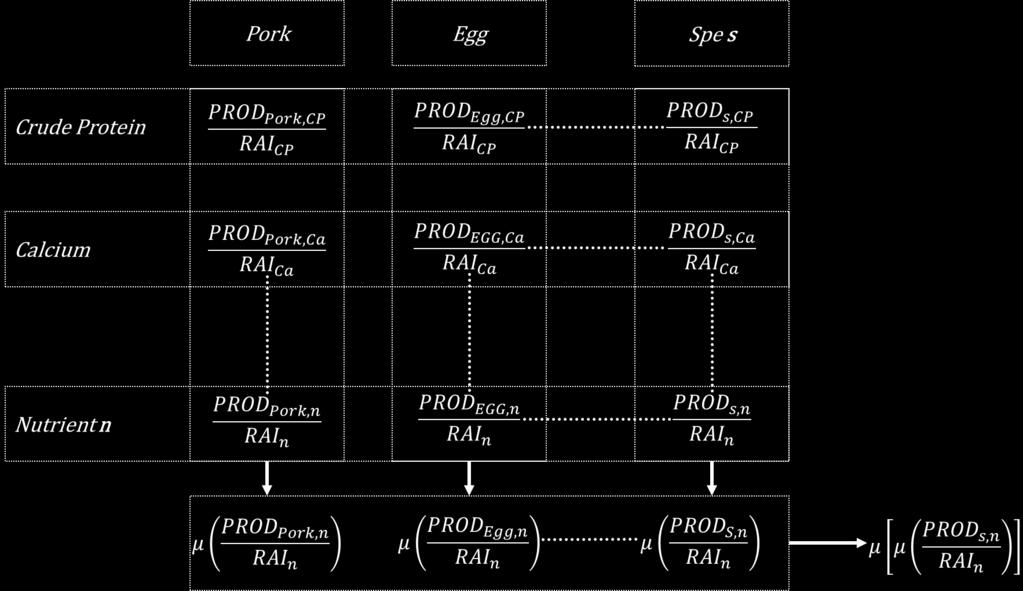
13 Accounting for nutritional quality: nutrient index (NI) (contents per 100 g meat) Beef Chicken Lamb Pork Nutrient Unit RDI Concentrate Forage Intensive Free range Lowland Upland Intensive Protein g MUFA g EPA+DHA mg Ca mg Fe mg Riboflavin mg Folic acid µg Vitamin B12 µg Se µg Zn mg Na g SFA g Red: nutrients to be discouraged
14 % RDI/100 g meat Accounting for nutritional quality: nutrient index (NI) 35 Based on 10 encouraged nutrients - 2 discouraged Average % RDI satisfied across all nutrients (100% = all nutrients satisfied solely by this commodity) Saarinen et al. (2017) Journal of Cleaner Production Beef performs best Concentrate Forage Intensive Free range Lowland Upland Intensive Beef Chicken Lamb Pork
15 kg CO 2 -eq/100 g meat Baseline: conventional GWP (mass-based) 3 Mass based global warming potential Concentrate Forage Intensive Free range Lowland Upland Intensive Beef Chicken Lamb Pork Chicken performs best
16 kg CO 2 -eq/1% RDI kg CO 2 -eq/100 g meat Mass-based GWP vs NI-based GWP Mass based global warming potential Concentrate Forage Intensive Free range Lowland Upland Intensive Beef Chicken Lamb Pork NI based global warming potential Concentrate Forage Lowland Upland Intensive Free range Intensive Beef Lamb Chicken Pork McAuliffe et al. (2018) Food and Energy Security Beef performs best
17 ALU (m 2 ) Accounting for other metrics: arable land use (ALU) 0.9 Arable land use per 100 g meat Concentrate Forage Chicken Lowland Upland Pork Beef Wilkinson and Lee (2018) animal Lamb Lamb performs best
18 ALU (m 2 /1%RDI) ALU (m 2 ) Finally: Arable land use (ALU) per NI provision Arable land use per 100 g meat Concentrate Forage Chicken Lowland Upland Pork Beef Lamb NI based arable land use Concentrate Forage Chicken Lowland Upland Pork Beef Lamb Lamb performs best
 Ruminant share: 0 1 based on livestock units NI: accounts for meat, milk and eggs GWP: based on life cycle assessment (LCA) ALU: includes displaced land outside")
19 Upscaling the framework Objective: to test the hypothesis that ruminants can provide more nutrients for humans per ha of arable land than monogastrics Case study: INRA France Sample: 571 agricultural land units (petites régions agricoles) Ruminant share: 0 1 based on livestock units NI: accounts for meat, milk and eggs GWP: based on life cycle assessment (LCA) ALU: includes displaced land outside PRA (Tichit et al., 16:45 today)

20 Nutrient Index n = 571 Nutrient delivery per region from livestock (people/pra)
 n =")
21 Global Warming Potential kg CO 2 eq GWP from livestock (CO2eq/PRA) n = 571
 ha n =")

22 Arable Land Use for Livestock (including displacement) ha n = 571 Arable land use for livestock including imports into region (ha/pra)
23 NI per ALU Mirrors the tendency of Aggregate data of greater NI from cattle regions Each dot represents a PRA and their average LU/ha
24 NI per GWP Monogastric regions improved But ruminant regions kept up due to high nutrient density High nutrient density affects GWP distribution
25 NI per GWP Ruminants can be better or worse Bimodal distribution of extensive regions Extensive regions can perform very well due to low ALU
26 NI per ALU NI per GWP
27 NI per ALU NI per GWP Good performers
28 NI per ALU Good performers NI per GWP are good performers
29 NI per ALU NI per GWP
30 NI per ALU NI per GWP Efficient dairy farms
31 ALU use (m 2 /1%RDI) kg CO 2 -eq/100 g meat What is sustainability? Mass based global warming potential NI based arable land use Concentrate Forage Chicken Lowland Upland Pork Beef Lamb


32 Livestock of course are more than food Livestock are part of the solution for sustainable global food security But great care must be given in developing metrics when determining their role


33 Soil to Nutrition Institute Strategic Programme Mechanistic understanding Targeted interventions Food Systems Private and public good Micro-scale processes which drive nutrient use Management impacts on nutrient use Delivering fitfor-purpose metrics to benchmark and improve nutrient use


34

35