NEWA berry models how you can make them work for you
|
|
|
- Sibyl Harris
- 5 years ago
- Views:
Transcription

1 NEWA berry models how you can make them work for you Juliet Carroll, NYS IPM, Cornell University

2 NEWA is a crowd-sourced, open-access weather network Producers share weather data through NEWA Weather is tabulated in hourly and daily summaries Rain, temperature, humidity, leaf wetness, solar radiation, wind These data run 40 agriculture decision support tools Plus five new berry tools. Funded by the NYS Berry Growers Assoc!
3 Top 3 reasons to use NEWA 1. IPM forecast tools for plant diseases & insects 2. Crop management tools 3. Weather data Real-time & historical Tools show 5-day forecast Query-based Decision support User input biofix Interactive user interface Better IPM, reduced pesticide use, improved environmental protection. Better crop management, improved crop quality, improved yield. Enhanced decision support.


4 NEWA s Home Page Blue menu on all NEWA pages Weather Data Pest Forecasts Station Pages Crop Management Crop Pages About Weather Stations Blue menu: interactive tools The map saves your location Website rebuild in 2019! smart phone friendly


5 Rainwise, Inc. weather stations


6 Where to find weather data On the main menu, click on Weather Data On the Station Page, use the Quick Links for current-year monthly summaries.


7 Hourly and daily weather for the station Hourly data Daily summary


8 4 berry models being tested in 2018 insects blueberry maggot cranberry fruitworm diseases strawberry anthracnose strawberry Botrytis mummy berry of blueberry for 2019 You can help test them! Contact Juliet Carroll,

9 Blueberry maggot DD model Model predicts emergence of blueberry maggot (BBM) adult flies. Based on trap catch data from Michigan State University. Used to time placement of monitoring traps for IPM. BBM has patchy distribution. Will address Canadian Quarantine requirements. Field validation in 2018.


10 Cranberry fruitworm DD model On blueberry. On cranberry. Model to time insecticide applications. Based on biofix of first trap catch. Collaborating with Rufus Isaacs at MSU and Hilary Sandler, UMass Cranberry Station. Field validation in 2108.

11 Strawberry Botrytis (gray mold) Model predicts infection risk. Based on research at Ohio State University and Florida State University. Used to time fungicide applications. Will be on the same page with anthracnose risk. Field validation in 2018.

12 Strawberry anthracnose Model predicts infection risk. Based on research at Ohio State University and Florida State University. Used to time fungicide applications. Will be on the same page with Botrytis risk. Field validation in 2018.


13 Mummy berry of blueberry Highbush blueberry. Primary infection of emerging shoots. Several models in North America. highbush / lowbush primary / secondary infections Looking at two possible models for primary infection. Field validation in 2019.

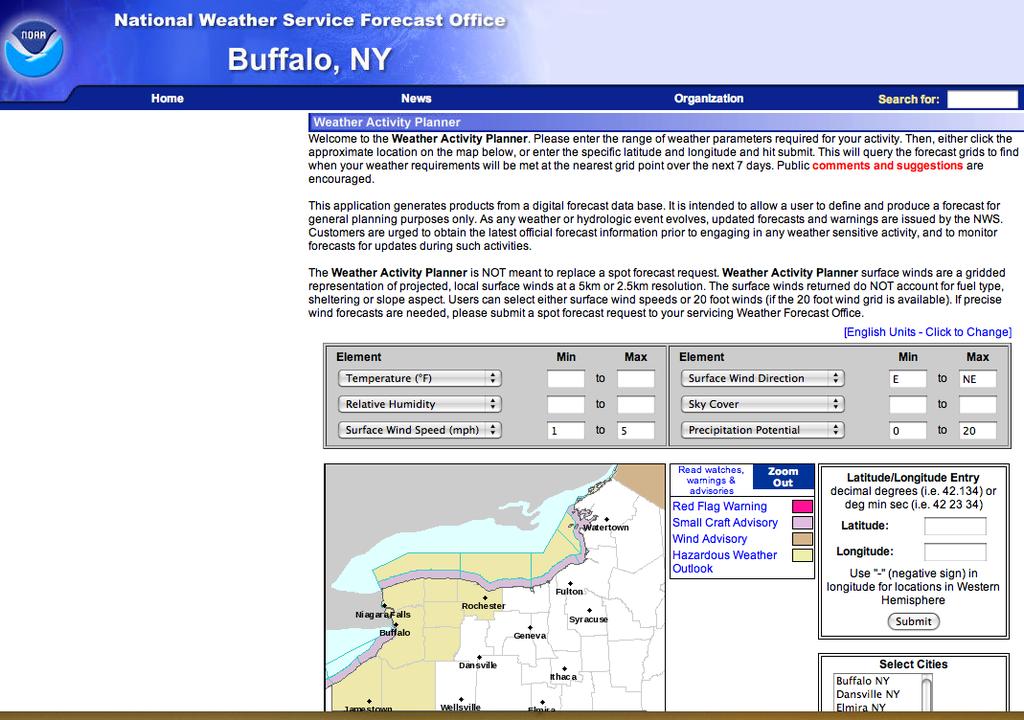
14 NOAA Activity Planner
15

16


17 Degree day tools Monthly reports Custom reports

18 Degree day calculator On the Main menu, click Weather data, select Degree day calculator
19 How can people use NEWA tools? Pesticide application timing Protect crops when sprays are necessary Protect the environment when sprays aren t necessary When to set traps for monitoring insects When to scout for plant disease symptoms Documentation for crop insurance Freeze damage Disease outbreaks Irrigation timing Open access Real-time Query-based Decision support

20 What growers say about NEWA (2007 survey) Growers can save, on average, $19,500/yr in spray costs and prevent $264,000/yr in crop loss as a direct result of using NEWA pest forecast models. 99% of NEWA users would recommend NEWA to farmers.

21

22
23 Thank you! any questions? newa.cornell.edu NEWA Coordinator Dan Olmstead Berry IPM Juliet Carroll