2016 Economic Summit Iowa Farm Bureau Meat Export Outlook
|
|
|
- Cameron Brooks
- 5 years ago
- Views:
Transcription

1 2016 Economic Summit Iowa Farm Bureau Meat Export Outlook Erin Borror USMEF Economist June 27, 2016 Des Moines

2 USMEF s Global Offices and Representatives


3 Membership Membership is comprised of nine sectors: Beef/Veal Producing and Feeding Pork Producing and Feeding Lamb Producing and Feeding Packing and Processing Purveying and Trading, including Jobbing, Retailing and Wholesaling Oilseeds Producing Feedgrains Producing Farm Organizations Supply and Service Organizations /Agribusiness

4 Pork The competitive landscape China Japan Mexico
5 Europe & U.S. account for about 70% of global exports 8,000,000 Top Pork Exporters, including variety meats 7,000,000 6,000,000 5,000,000 Mexico 29% Chile 4,000,000 33% 32% 31% 31% 30% Brazil Canada 3,000,000 32% US EU28 2,000,000 1,000, f Source: Global Trade Atlas, USMEF estimates, U.S. market share is noted
6 Global pork imports: record-large in 2015 and again in 2016, driven by China 8,000,000 Top Pork Importers, including variety meats Metric tons 7,000,000 6,000,000 5,000,000 4,000,000 3,000,000 2,000,000 1,000,000 23% 22% hina s share of imports - 12% 17% 14% 17% 16% 18% 16% 17% 19% 19% 18% 40% 30% 29% 31% 31% 32% 26% 22% 23% f Source: Global Trade Atlas, USMEF estimates Others NZ C Am Taiwan S. Am Canada Aus Russia ASEAN Korea U.S. Mexico Japan China/HK
7 Global hog prices- opportunities and fierce competition $2.50 Global Estimated Hog Carcass Prices $2.00 U.S. $/pound $1.50 $1.00 $0.50 $0.00 Japan Korea China Taiwan Mexico Chile U.S. EU Canada Brazil May-15 May-16

8 Metric tons U.S. exports & growth prospects 3,000,000 2,500,000 2,000,000 1,500,000 1,000, ,000 Top 5 markets will continue to account for >80% of U.S. export volume, but will decline from 87% estimated for 2016 U.S. Pork & Variety Meat Exports & Forecast 2016F: 2.3 mmt, +8%; $5.78 B, +4% Others ASEAN Aus/NZ C/S Am Korea Canada Japan China/HK Mexico - Source: USDA/FAS & USMEF estimates Future growth requires an increase in U.S. market share
9 Source: Global Trade Atlas, USMEF est The harsh reality 50% U.S. Share of Pork Imports 45% 40% 35% 30% 25% 20% 15% 10% Japan Australia Korea China/HK Taiwan Philippines 5% 0%
10 EU exports shifted with the loss of the Russian market, and are growing! Metric tons EU pork exports, excluding variety meats 2,000,000 1,800,000 1,600,000 1,400,000 1,200, ,290 1,000, , , , , % -2.8% $5.8 B $5.6 B $5.05 B Source: Global Trade Atlas Others Russia South Africa New Zealand Singapore Taiwan Philippines Australia United States Korea South Japan China/HK
11 Source: Global Trade Atlas EU export boom continues in 2016 Metric tons 800, , , , , , , ,000 0 EU Pork & Variety Meat Exports: Jan-April +78% Jan-April 2016 exports: mmt, +37%!! +22% +42% +22% +204% J-Ap '14 J-Ap '15 J-Ap '16
12 Source: Global Trade Atlas The EU is dominating global trade 250,000 Pork Exports, excluding variety meats, monthly 200,000 Metric tons 150, ,000 EU28 U.S. Canada Brazil 50,000 0
13 China s imports are supply/price driven 120,000 EU pork exports to China & China/EU Hog Price Ratio 2.80 Metric tons exported 100,000 80,000 60,000 40,000 20,000 0 Jan-11 Apr Jul Oct Jan-12 Apr Jul Oct Jan-13 Apr Jul Oct Jan-14 Apr Jul Oct Jan-15 Apr Jul Oct Jan-16 Apr China/EU hog price ratio EU pork to China China/EU hog price ratio
14 Source: Global Trade Atlas, USMEF est And Europe remains the dominant supplier Pork & Variety Meat Exports to China/Hong Kong 200, , ,000 50,000 EU28 U.S. Canada Brazil Chile 0 01/ / / / / / / / / / / / / / / / /2016

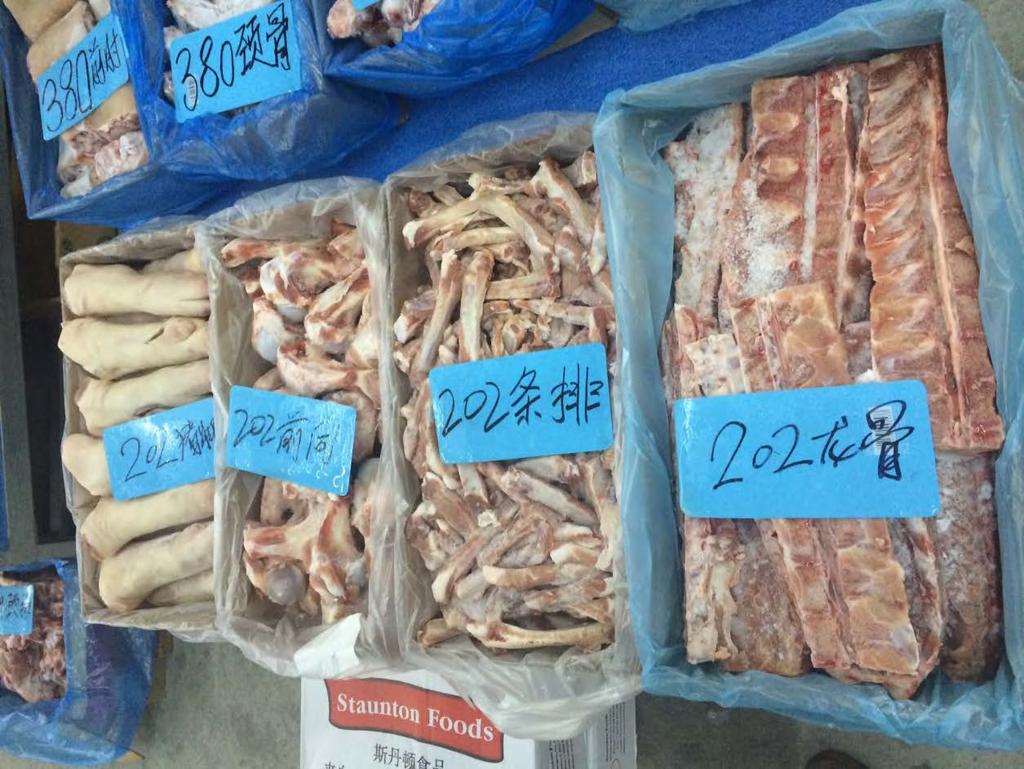
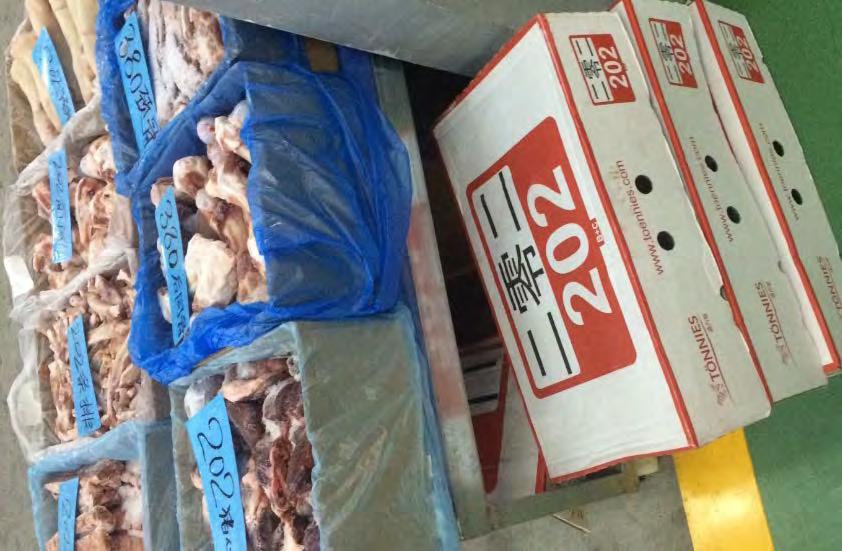
15 U.S. competitiveness is cut-based
16
17 The cure for high prices is high prices China s new environmental regulations Change in corn policy 5 year plan and shift in hog producing regions The market will cycle, but More end users now have experience with imported pork Meeting China s requirements will remain key to doing business volatility In China, everything is possible, but nothing is easy. 100% 90% 80% 70% 60% 50% 40% 30% 20% 10% 0% Structural Shift in China s Hog Farms Boyar estimates & MOA 3% 4% Integrator 6% 40% 41% Scale farm 45% 57% 55% Household 49% f
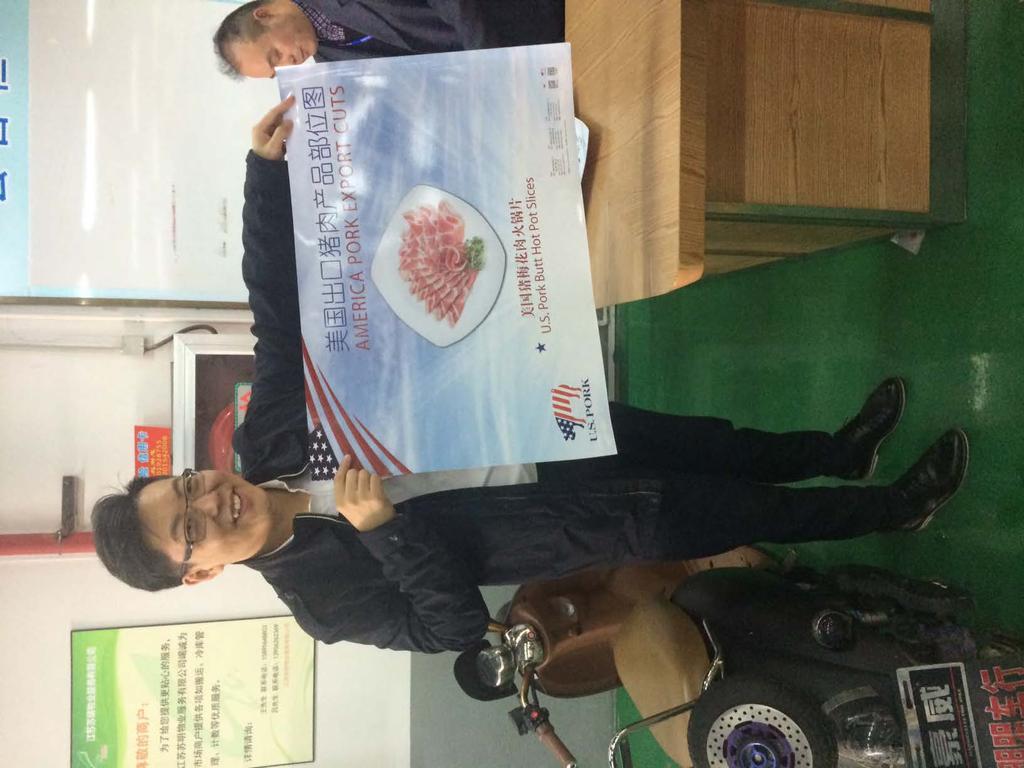
18 Market access, risks & opportunities SPS-related market access issues China, Russia, Taiwan TPP Opportunities are real EU standards Risk of inaction: going backwards in our highest-value market Beyond market access Marketing & positioning U.S. pork to help win back market share
19 Source: Global Trade Atlas & USMEF estimates Japan s imports of U.S. pork 450,000 Japan s imports of U.S. pork 400, , ,000 Metric tons 250, , ,000 Other processed GSP Frozen Chilled 100,000 50, f Loins, tenderloins, ct butts, single-ribbed bellies

20 Source: Global Trade Atlas & USMEF estimates We must defend our chilled market share 400,000 Japan s imports of chilled pork 350, , ,000 Metric tons 200, ,000 Mexico Canada U.S. 100,000 50, f


21 Japanese ham & sausage manufacturers embracing European pork Spain Italy
22 Mexico: 4 consecutive years of record U.S. pork exports 70,000 U.S. pork exports to Mexico & U.S. ham prices in pesos U.S. pork exports to Mexico, mt 65,000 60,000 55,000 50,000 45,000 40,000 35, U.S. Hams in pesos/kg 30,000 Jan-11 Mar-11 May-11 Jul-11 Sep-11 Nov-11 Jan-12 Mar-12 May-12 Jul-12 Sep-12 Nov-12 Jan-13 Mar-13 May-13 Jul-13 Sep-13 Nov-13 Jan-14 Mar-14 May-14 Jul-14 Sep-14 Nov-14 Jan-15 Mar-15 May-15 Jul-15 Sep-15 Nov-15 Jan-16 Mar-16 May-16 - U.S. exports U.S. hams in pesos/kg U.S. market share: 2012: 90% 2013: 88% 2014: 86% 2015: 83%

23 Beef Competitive landscape & growth potential Japan Korea
 (100,000) (150,000) (200,000) (250,000) Source: Global Trade Atlas & USMEF")
24 2015 beef export volume decreased for the top 4 exporters 100,000 50, Change in metric tons - (50,000) (100,000) (150,000) (200,000) (250,000) Source: Global Trade Atlas & USMEF estimates
25 And decreases were widespread on the importing (demand) side 150, , Change in metric tons 50,000 - (50,000) (100,000) (150,000) (200,000) (250,000) Russia G. China Venezuela Indonesia Mexico Iran Japan Chile Egypt Brazil Algeria EU28 Taiwan Canada Thailand South Africa Philippines Cote d'ivoire Malaysia Singapore S. Korea U.S. Source: Global Trade Atlas & USMEF estimates

26 Some price convergence starting in late 2015 $6.50 Competitor Beef Carcass Prices, $/kg Weekly since Aug 2011 $6.00 $5.50 $5.00 $4.50 $4.00 $3.50 $3.00 USA Ireland Australia Brazil Uruguay $2.50 $ Aug 28-Sep 23-Nov 18-Jan 14-Mar 9-May 4-Jul 29-Aug 24-Oct 19-Dec 13-Feb 10-Apr 5-Jun 31-Jul 25-Sep 20-Nov 15-Jan 12-Mar 7-May 2-Jul 27-Aug 22-Oct 17-Dec 11-Feb 8-Apr 3-Jun 29-Jul 23-Sep 18-Nov 13-Jan 9-Mar 4-May

27 The worst is behind us 2016f: 1.11 mmt, +4% $6.4 billion, +1% 1,400,000 U.S. Beef & Variety Meat Exports & Forecast Metric tons 1,200,000 1,000, , , , ,000 - Others Taiwan Mid East Canada China/Hong Kong Korea Mexico Japan Top 7 account for 90% of export volume Source: USDA/FAS & USMEF, volumes include variety meats
28 Our forecast growth markets for Forecast Change in Export Volume Growth in 2016 exports, mt 50,000 45,000 40,000 35,000 30,000 25,000 20,000 15,000 10,000 5, % +18% +11% +25% +7% +10% Total Korea Japan ASEAN Taiwan Central America With China still a major missed opportunity 2016f: 1.11 mmt, +4% $6.6 billion, +5%
29 Time to buy back market share & grow demand 700, , , Beef & Variety Meat Imports from U.S. & Others Metric tons 400, , , ,000 - U.S. Competition Source: Global Trade Atlas & USMEF estimates
30 Australia as the primary competitor 350, , , Beef & Variety Meat Imports Metric tons 200, , ,000 50,000 - Japan U.S. Australia Others Korea Source: Global Trade Atlas & USMEF estimates

31 Australia s exports have indeed slowed with production: Q1 status Production: 532,683 mt, -17% COF: 914,902 head, -5% Total exports: 245,590, -17% Grain-fed exports: 62,282 mt, +3% Japan 29,208 mt, -18% Korea 13,187 mt, +63% China 5,154 mt Source: MLA ALFA, MLA

32 Yen/kg TPP urgency For 1kg of short plate at $2/lb, from Australia and the U.S.: 27.5% duty A$2/lb 50% difference in price % consumption tax 38.5% duty US$2/lb 0 Australia U.S. Short plate Duty Consumption tax

33 High prices for domestic beef are helping demand for U.S. Choice/Prime $12.00 $10.00 Beef Carcass Prices $/pound $8.00 $6.00 $4.00 $2.00 $0.00 Japan wagyu Korea hanwoo Japan dairy China U.S. Australia May-15 May-16 Source: USMEF Tokyo, USMEF Seoul, USDA, MLA

34 Growing imports of chilled U.S. beef Japan Korea 45,000 18,000 40,000 16,000 35,000 14,000 30,000 12,000 25,000 10,000 20,000 8,000 15,000 6,000 10,000 4,000 5,000 2,000 0 Australia U.S. - Australia U.S. J-Ap '14 J-Apr '15 J-Apr '16 J-Ap '14 J-Apr '15 J-Apr '16
35 Japan s feeder cattle prices soar with the shrinking calf crop Source: ALIC, average for black-haired wagyu steers & heifers $7,500 $7,000 $6,500 Wagyu Feeder Cattle, Average Price Per Head $7,272 U.S.$/head $6,000 $5,500 $5,000 $4,500 $4,000 Jan,2012 Mar May Jul Sep Nov Jan,2013 Mar May Jul Sep Nov Jan,2014 Mar May Jul Sep Nov,2014 Jan,2015 Mar May Jan-April average weight: 616 lb, so prices averaged $10.97/lb! Jul Sep Nov Jan,2016 Mar
36 China s remains fastest growing beef import market 250,000 China s Beef Imports: Jan-May +63% 200,000 Metric tons 150, ,000 50,000 Canada Argentina New Zealand Australia Uruguay Brazil Source: Global Trade Atlas


37 Thanks to your support, we are adding value through red meat exports Every pound of U.S. pork exported represents nearly 3 pounds of U.S. corn, soybeans, and DDGS. Source: USDA Baseline Projections, World Perspectives, Inc. Every pound of U.S. beef exported represents more than 4 pounds of U.S. corn and DDGS. U.S. red meat exports in 2016 will utilize more than 385 million bushels of U.S. corn. U.S. red meat exports in 2016 will utilize nearly 60 million bushels of U.S. soybeans Red Meat Exports Value to Iowa Corn $2.966 billion Value to Iowa DDGS $715 million

 Growth in U.S.")
38 Summary Exports are rebounding this year, with growth expected over the outlook & critical for producer bottom-lines Market access issues continue to limit U.S. export growth potential Relatively tight global supplies and stable demand should support trade & keep a floor on prices (shorterterm for pork) Growth in U.S. production helps us regain competitiveness Strong US$ remains a challenge High quality remains key

39 Thank You! For more information: Erin Borror
40 U.S. Pork Exports Value to Iowa Corn & DDGS $300 $250 $USD millions $200 $150 $100 Corn DDGS $50 $ Source: USDA Baseline Projections, World Perspectives, Inc.
41 U.S. Beef Exports Value to Iowa Corn & DDGS $180 $160 $140 $USD millions $120 $100 $80 $60 $40 $20 Corn DDGS $ Source: USDA Baseline Projections, World Perspectives, Inc.